Publication number: ELQ-11615-1
View all versions & Certificate

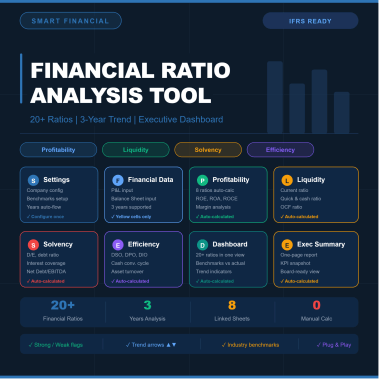
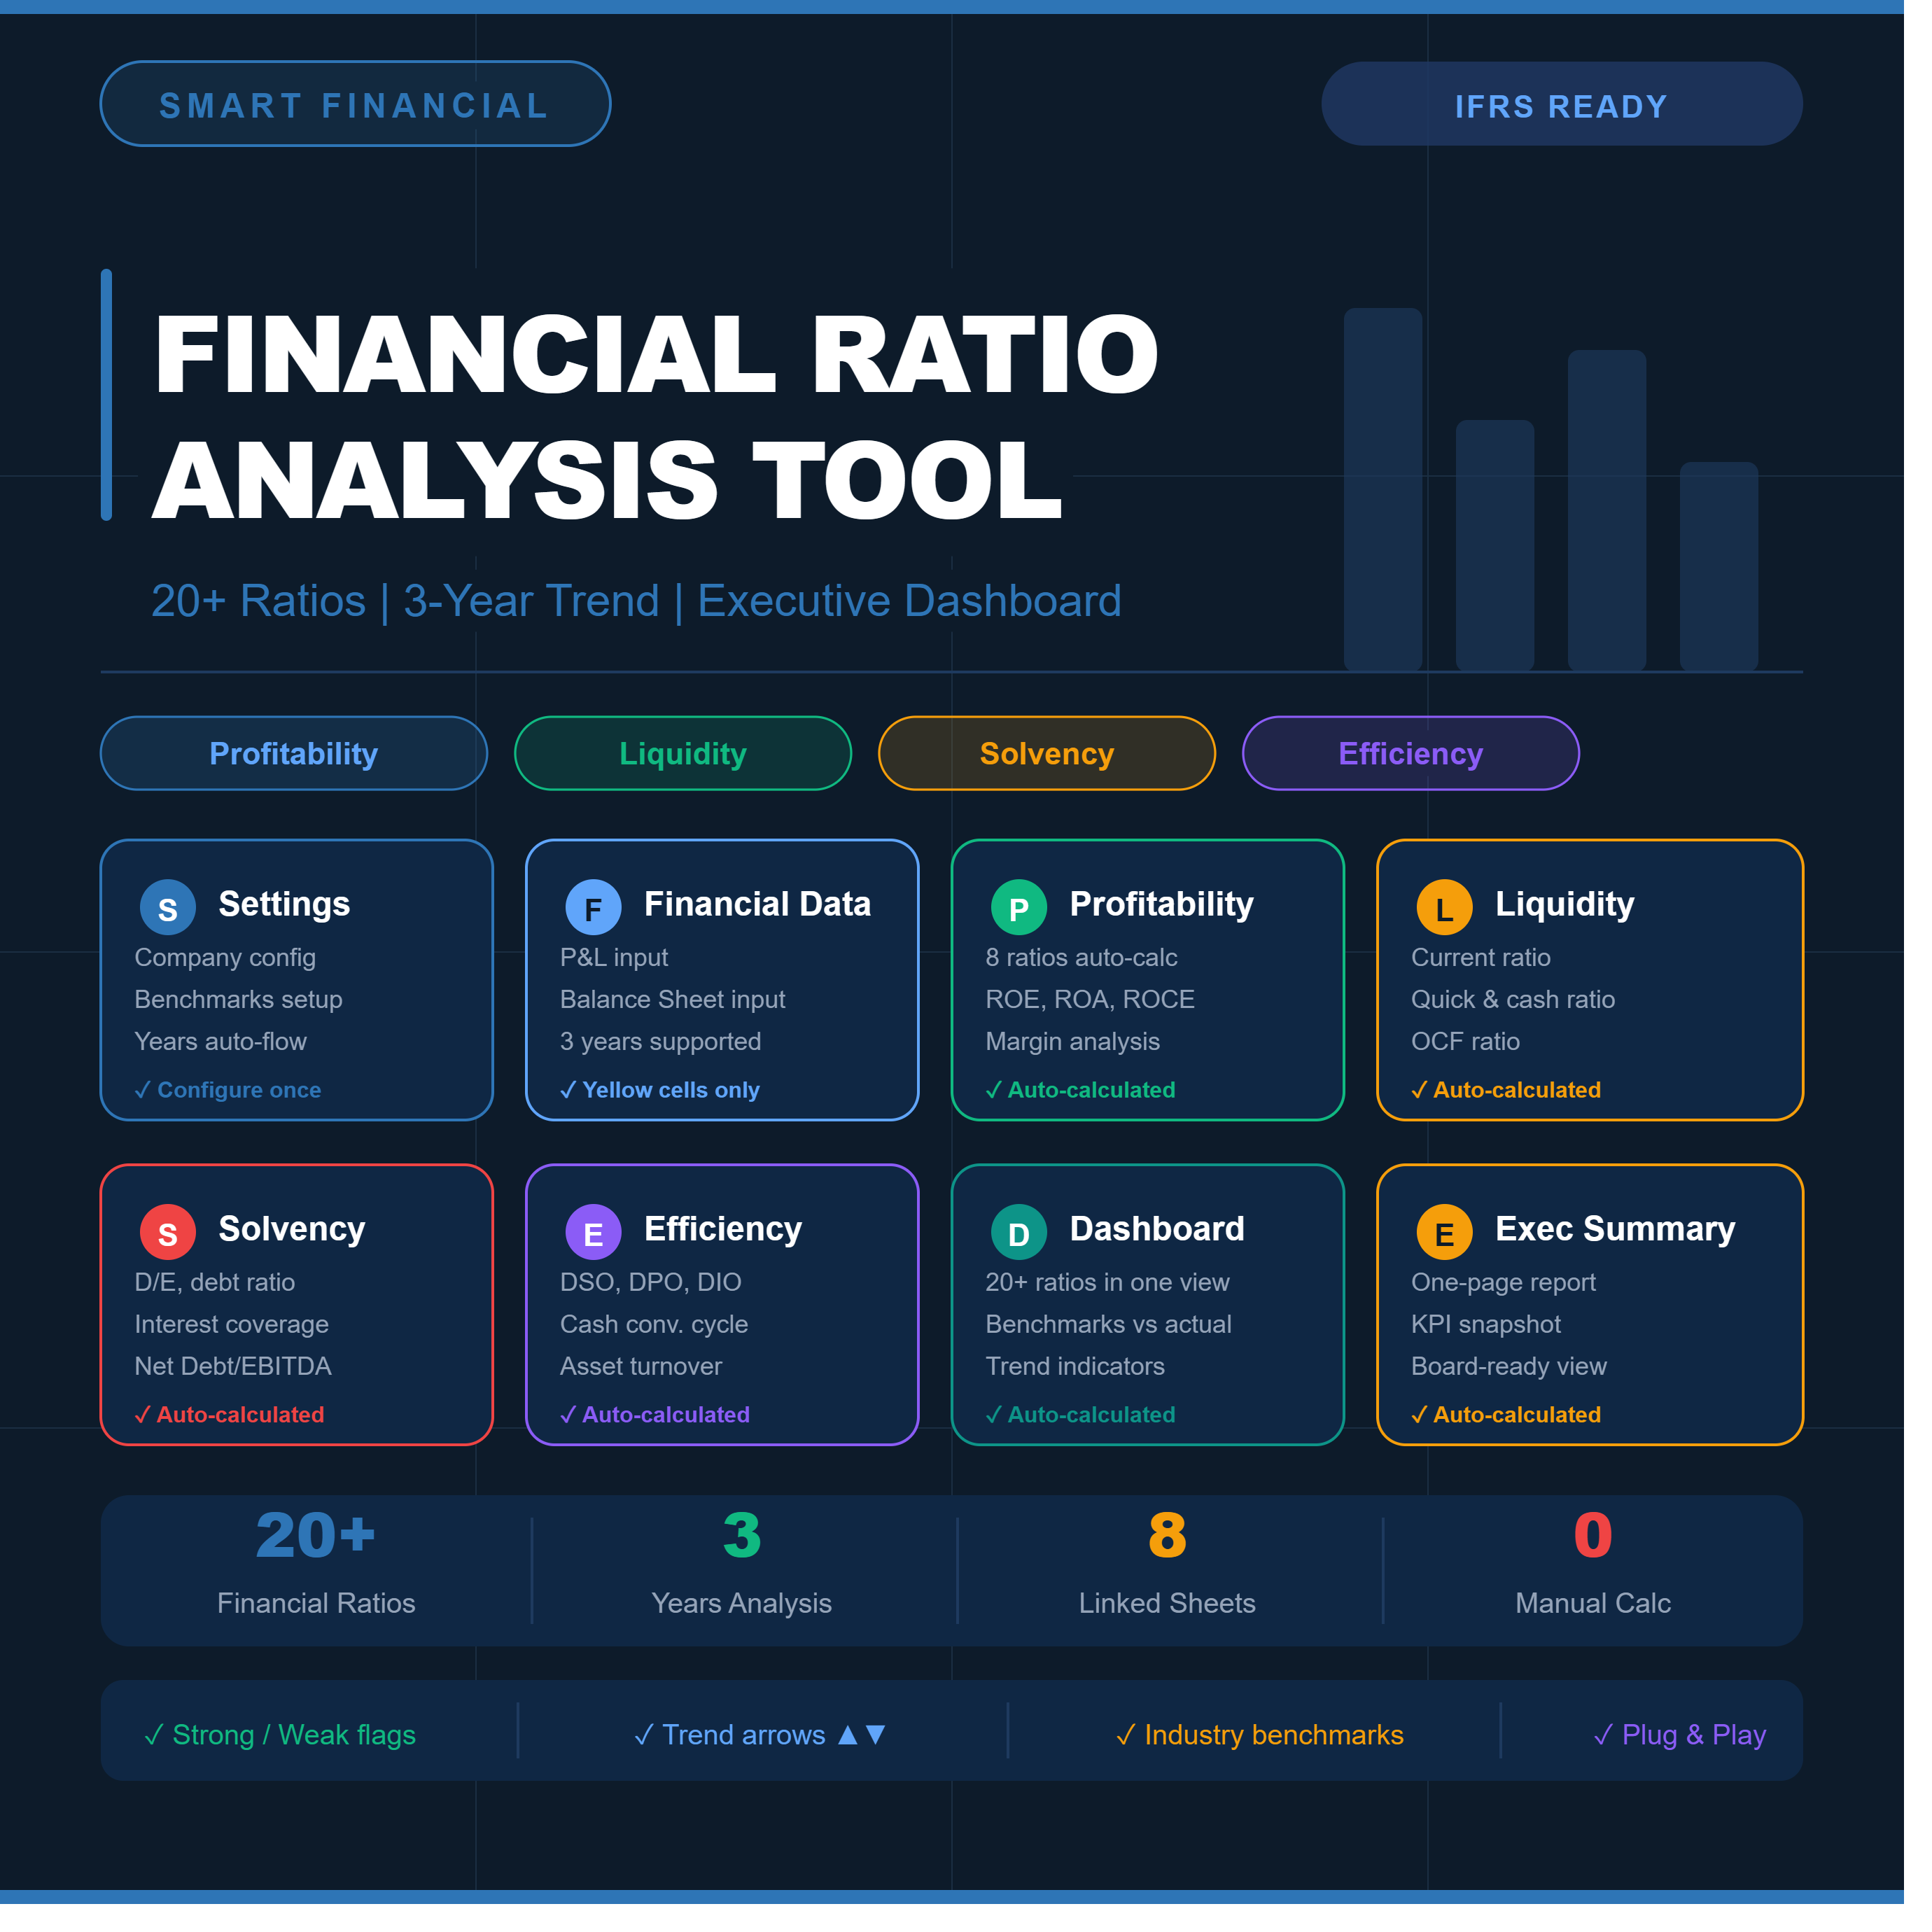
Financial Ratio Analysis Tool | 20+ Ratios | 3-Year Trend | Profitability, Liquidity, Solvency & Efficiency | Automated
Professional Excel Financial Ratio Analysis Dashboard with automated KPI reporting, trend analysis, and 3-year financial performance evaluation.
Financial Ratio Analysis Dashboard & KPI Reporting Tool (Excel)
Transform raw financial statements into actionable business insights with this comprehensive Financial Ratio Analysis Excel Template. Designed for accountants, finance professionals, business owners, analysts, consultants, and students, this tool automatically calculates key financial ratios and presents results through a professional dashboard and executive summary.
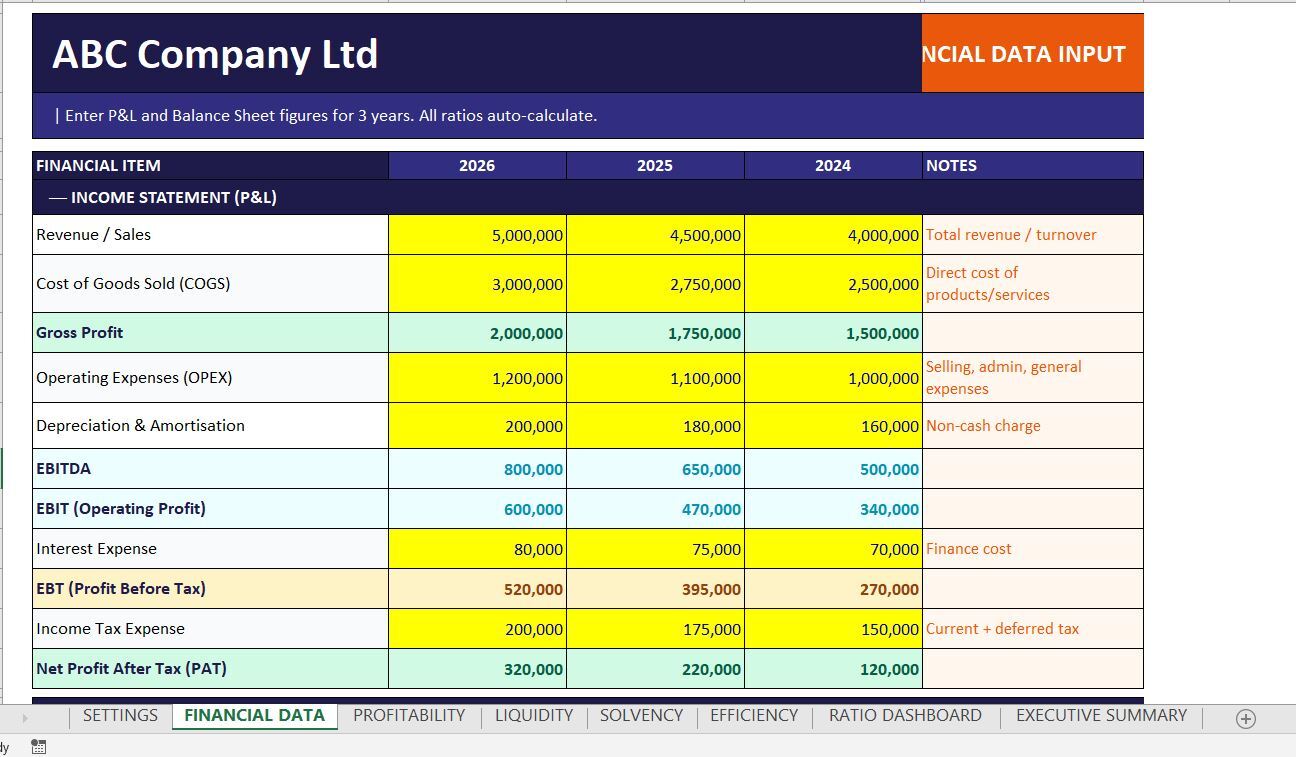
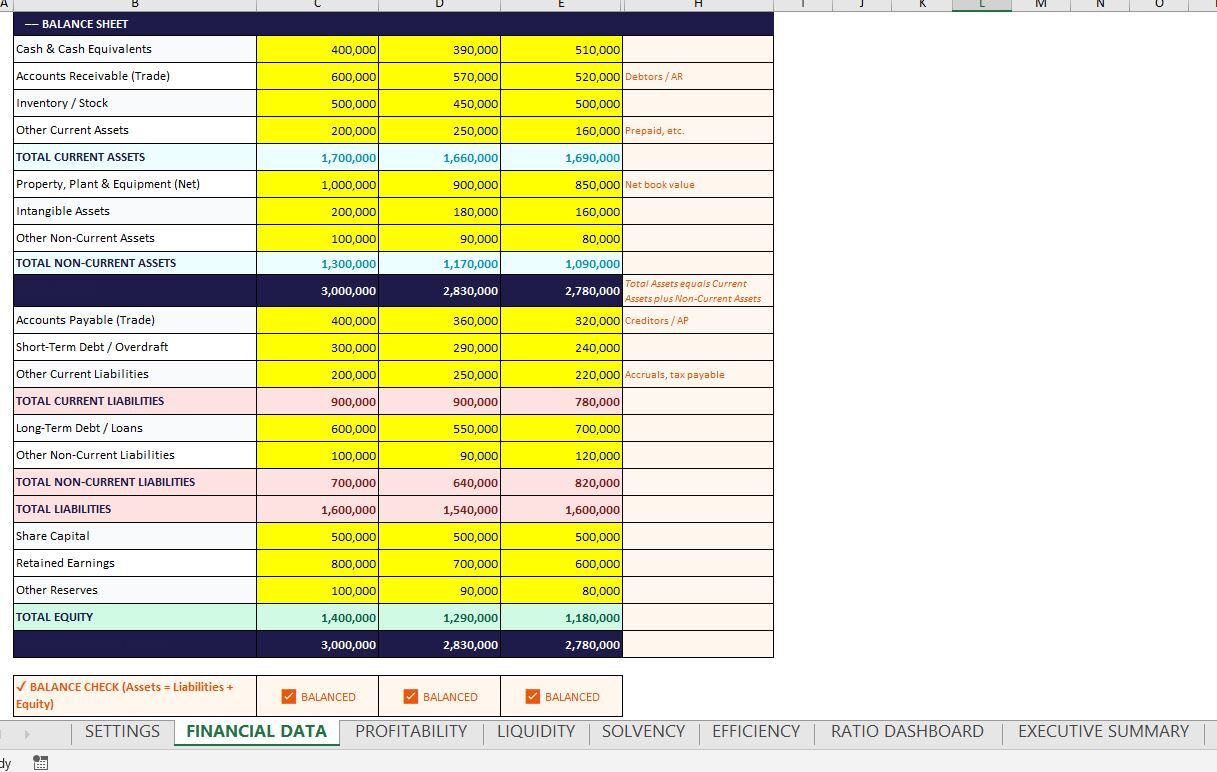
Simply enter your Income Statement and Balance Sheet figures for up to three financial years, and the workbook instantly generates detailed ratio analysis, trend indicators, financial health assessments, and management reports.
Key Features
✅ Automated Financial Ratio Calculations
✅ 3-Year Comparative Analysis
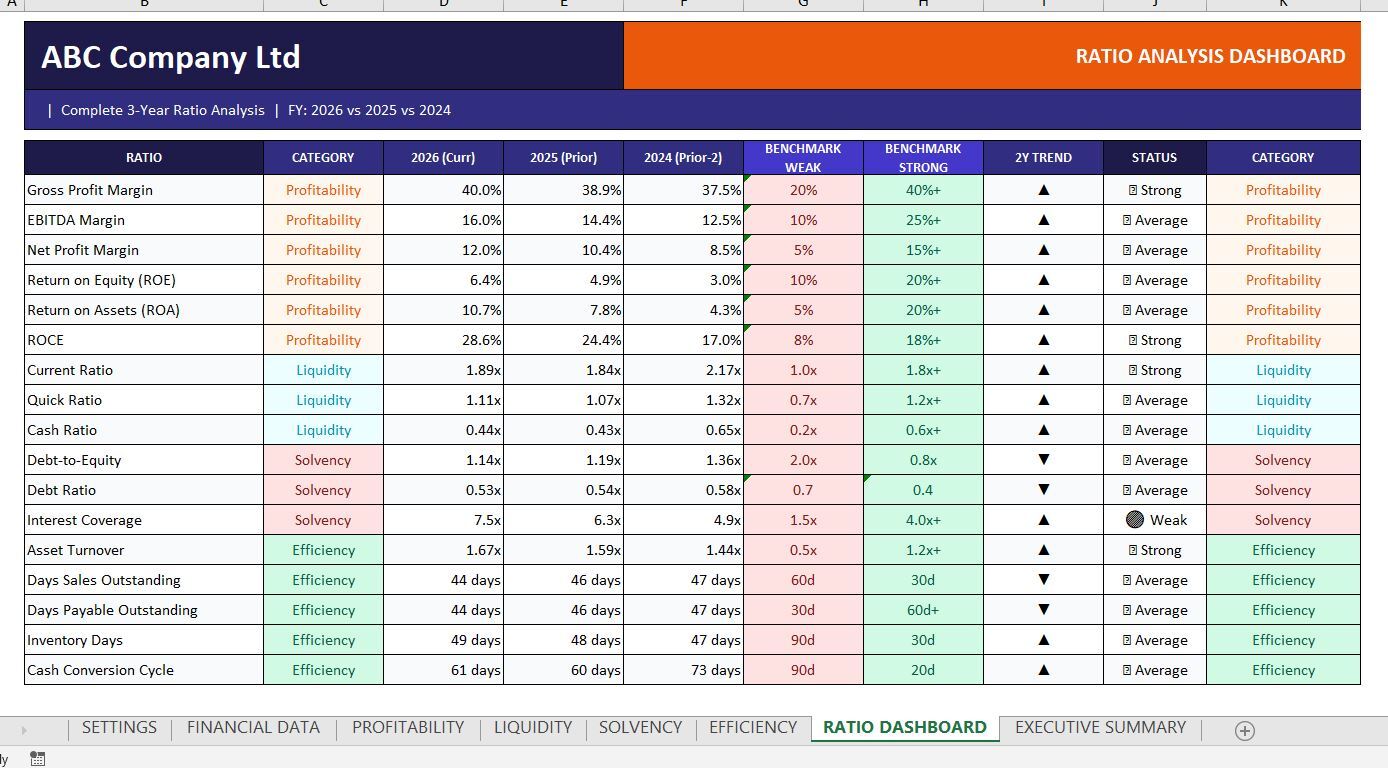
✅ Interactive Ratio Dashboard
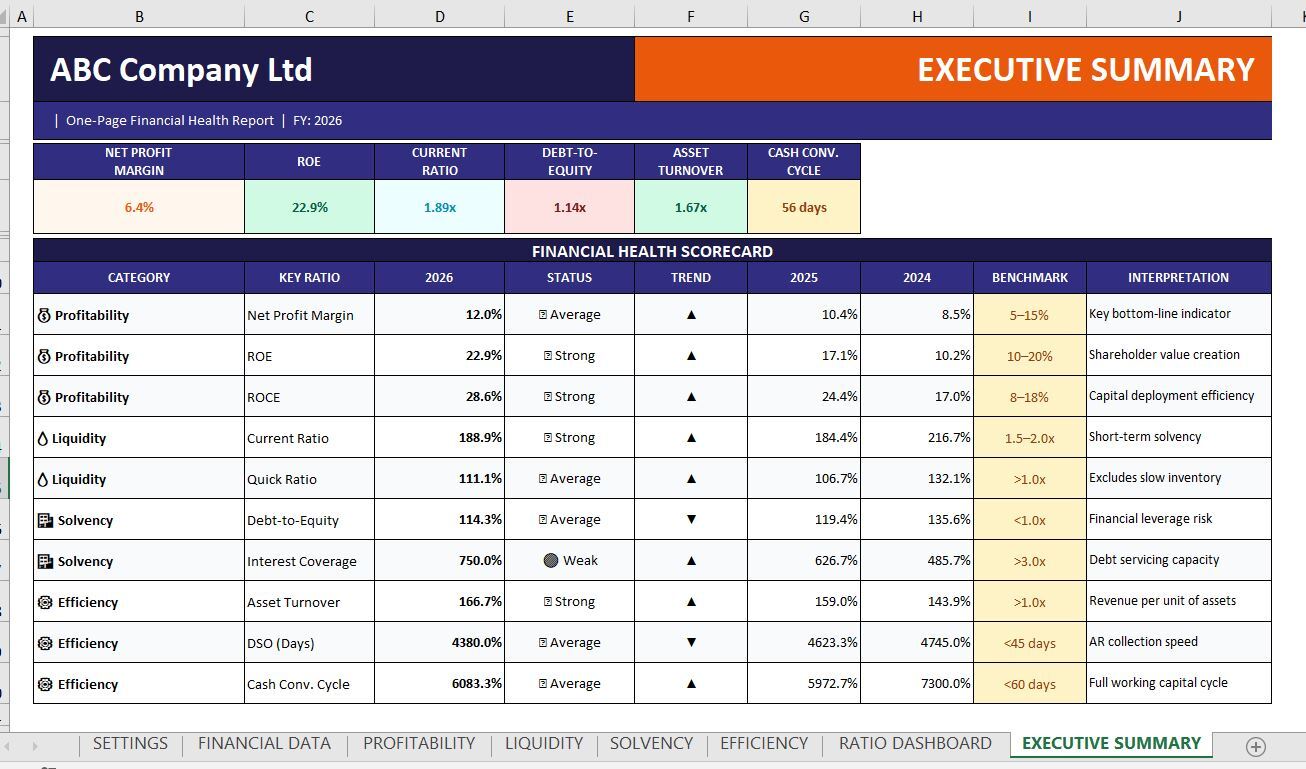
✅ Executive Summary Report
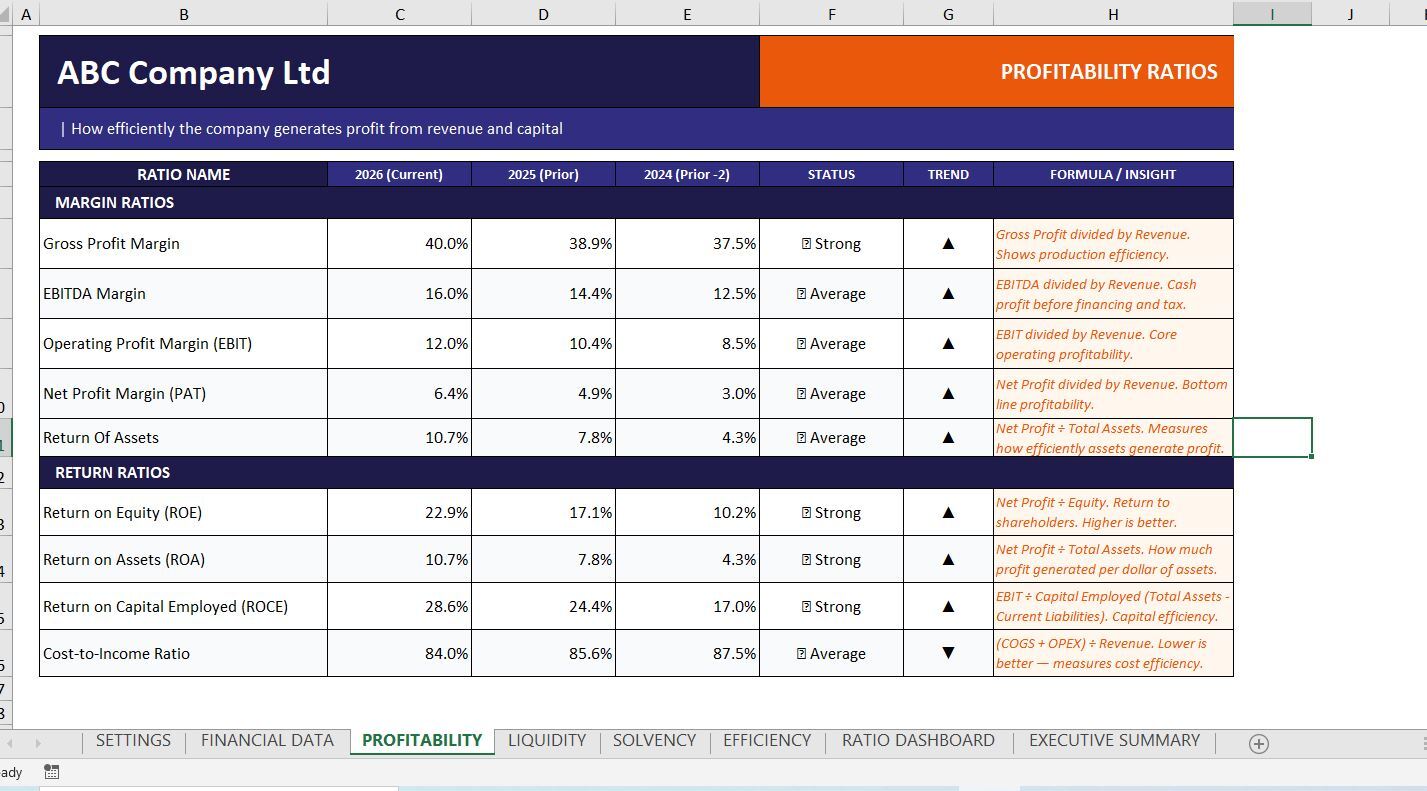
✅ Profitability Analysis
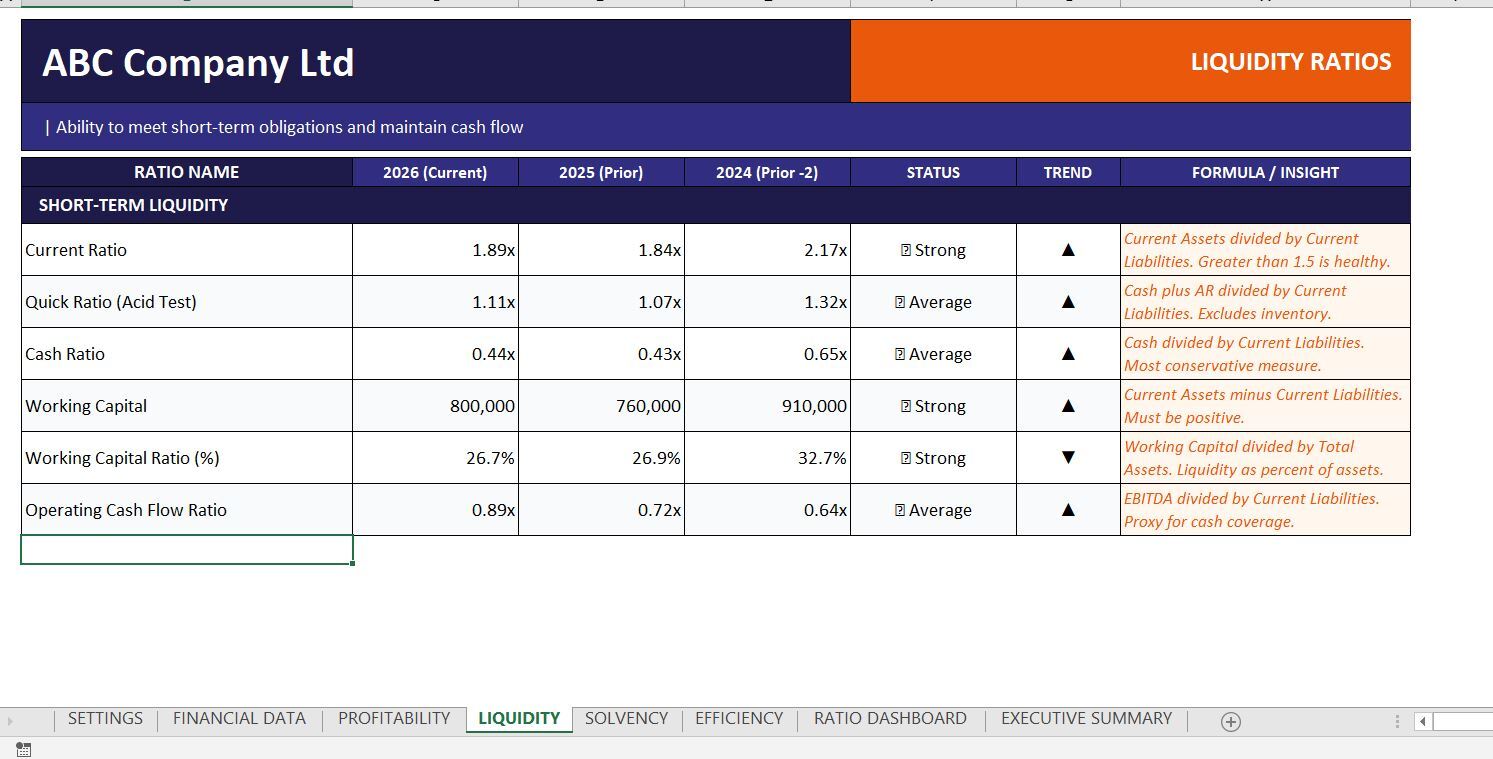
✅ Liquidity Analysis
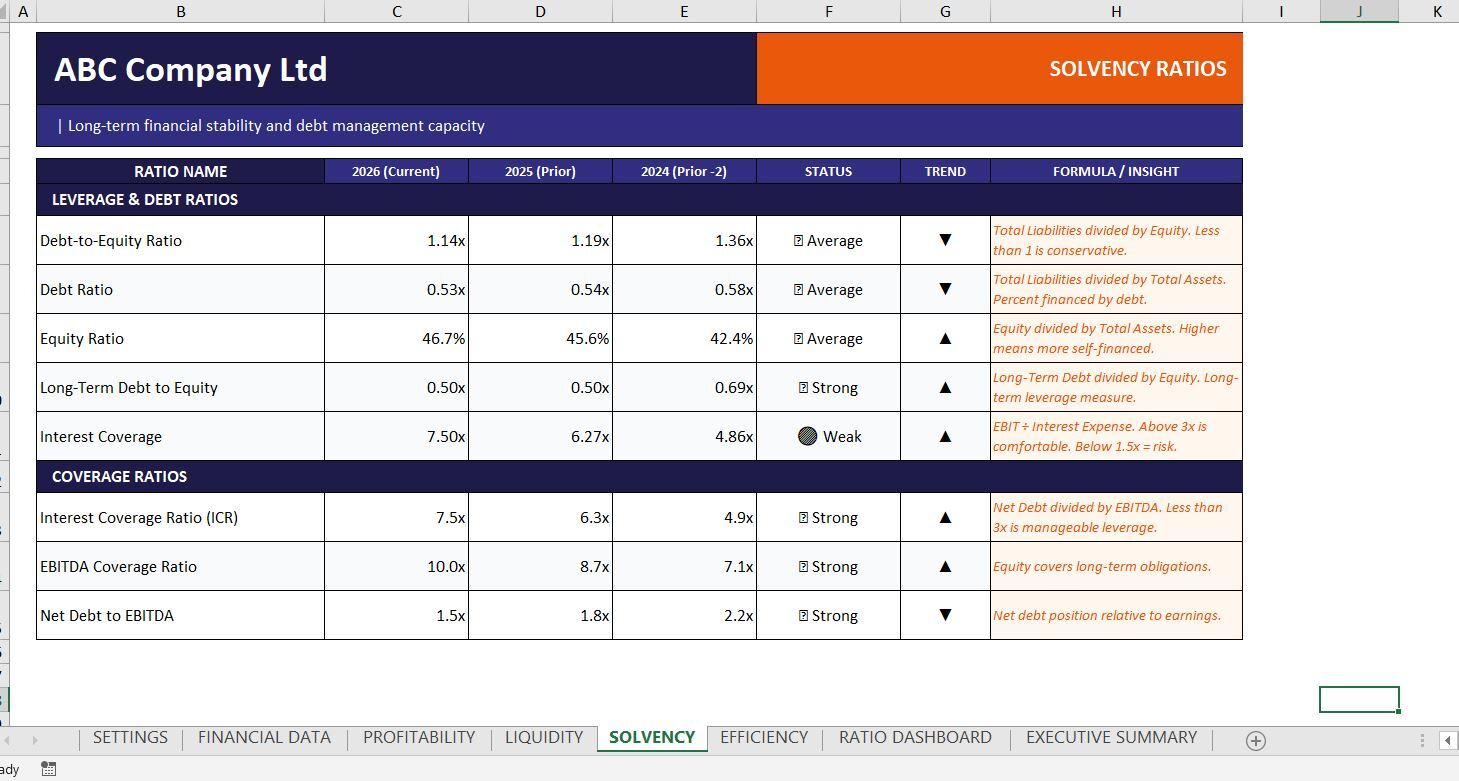
✅ Solvency & Leverage Analysis
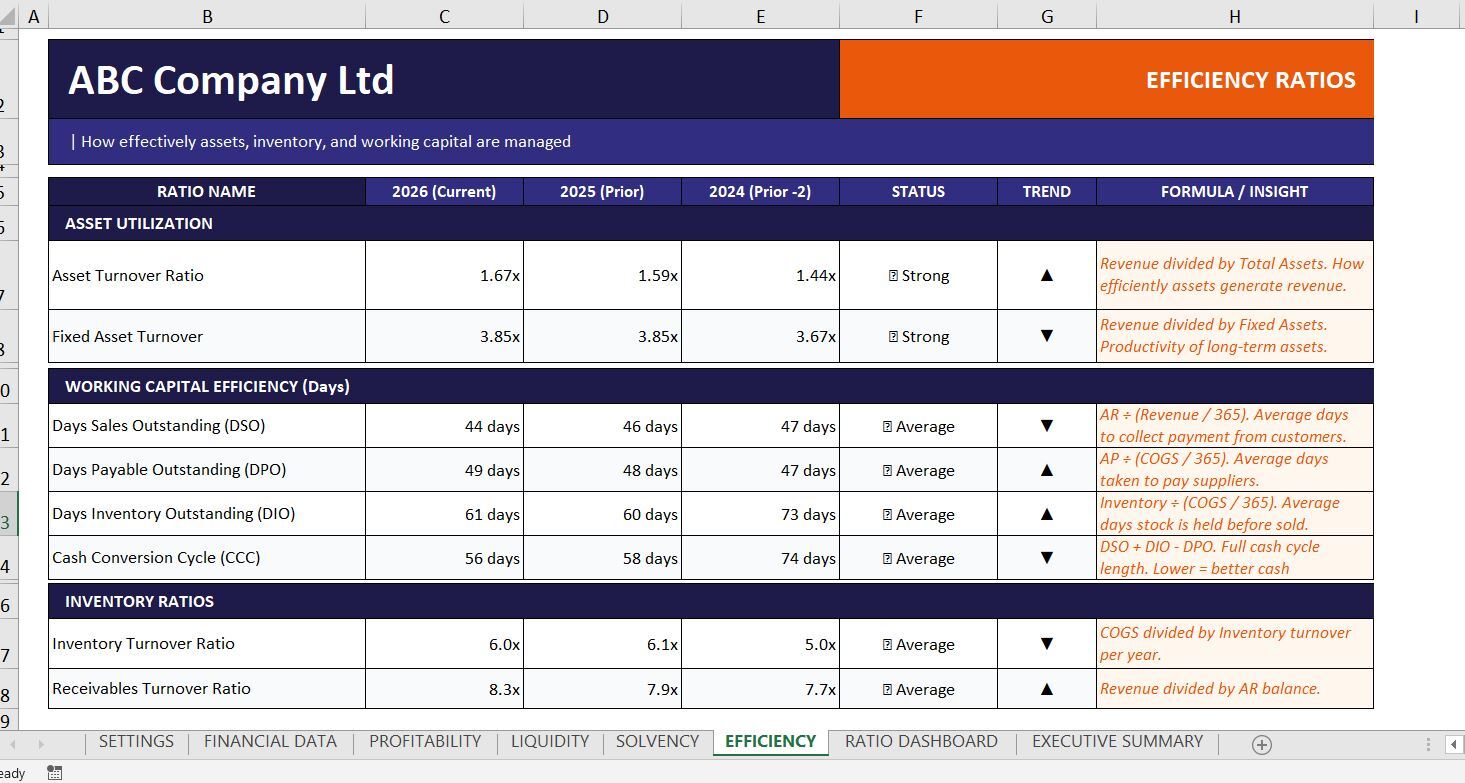
✅ Efficiency & Working Capital Analysis
✅ Built-in Trend Indicators
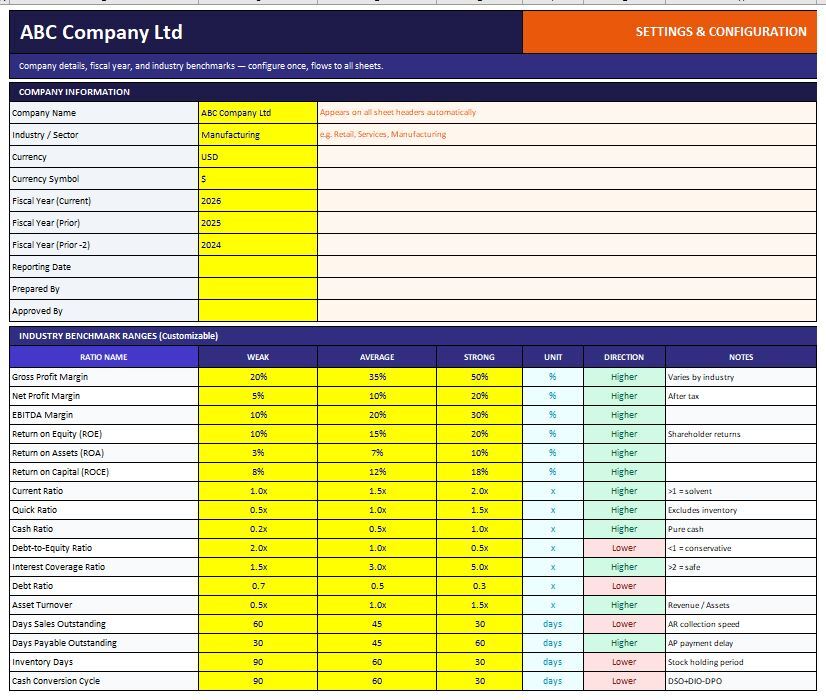
✅ Benchmark-Based Performance Assessment
✅ No VBA or Macros Required
✅ Fully Editable Excel Workbook
Ratios IncludedProfitability Ratios
- Gross Profit Margin
- EBITDA Margin
- Operating Profit Margin (EBIT)
- Net Profit Margin
- Return on Assets (ROA)
- Return on Equity (ROE)
- Return on Capital Employed (ROCE)
- Cost-to-Income Ratio
- Current Ratio
- Quick Ratio (Acid Test)
- Cash Ratio
- Working Capital
- Working Capital Ratio
- Operating Cash Flow Ratio
- Debt-to-Equity Ratio
- Debt Ratio
- Equity Ratio
- Long-Term Debt to Equity
- Interest Coverage Ratio
- EBITDA Coverage Ratio
- Net Debt to EBITDA
- Asset Turnover Ratio
- Fixed Asset Turnover
- Days Sales Outstanding (DSO)
- Days Payable Outstanding (DPO)
- Days Inventory Outstanding (DIO)
- Cash Conversion Cycle (CCC)
- Inventory Turnover Ratio
- Receivables Turnover Ratio
The workbook includes a dedicated Ratio Analysis Dashboard that consolidates key performance indicators into a single view, making it easier to evaluate financial health, identify trends, and communicate results to management, investors, lenders, or stakeholders.
The Executive Summary provides a concise overview of profitability, liquidity, solvency, and operational efficiency, allowing quick assessment without reviewing multiple worksheets.
Ideal For:
- Accountants
- Financial Analysts
- CFOs & Finance Managers
- Auditors
- Business Consultants
- SMEs & Business Owners
- Investment Analysis
- Academic & Professional Training
- Financial Statement Review
- Settings & Configuration
- Financial Data Input
- Profitability Ratios
- Liquidity Ratios
- Solvency Ratios
- Efficiency Ratios
- Ratio Analysis Dashboard
- Executive Summary
- Save hours of manual ratio calculations
- Improve financial analysis accuracy
- Monitor business performance trends
- Support strategic decision-making
- Generate professional management reports
- Identify strengths, weaknesses, and financial risks quickly
Compatible with Microsoft Excel 2016, 2019, 2021, and Microsoft 365.
This Best Practice includes
1 Excel workbook Ready to Use and 1 sample Excel File
