Originally published: 25/01/2021 14:15
Publication number: ELQ-89127-1
View all versions & Certificate
Publication number: ELQ-89127-1
View all versions & Certificate

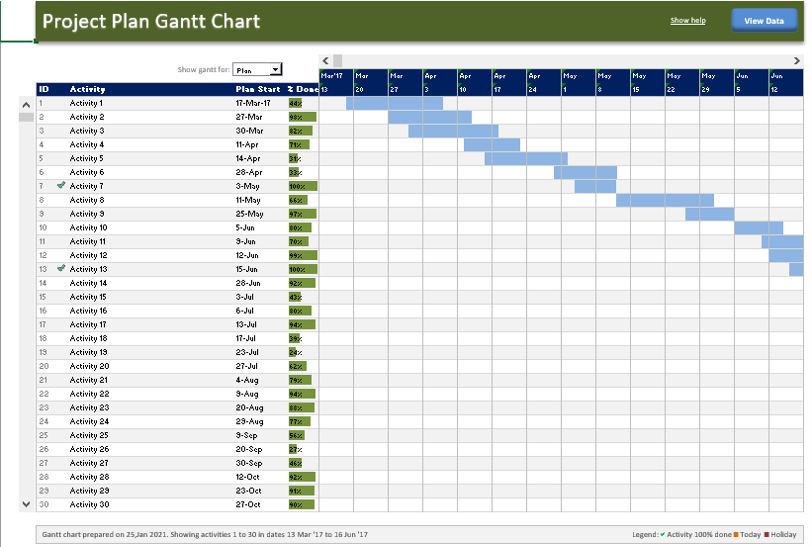
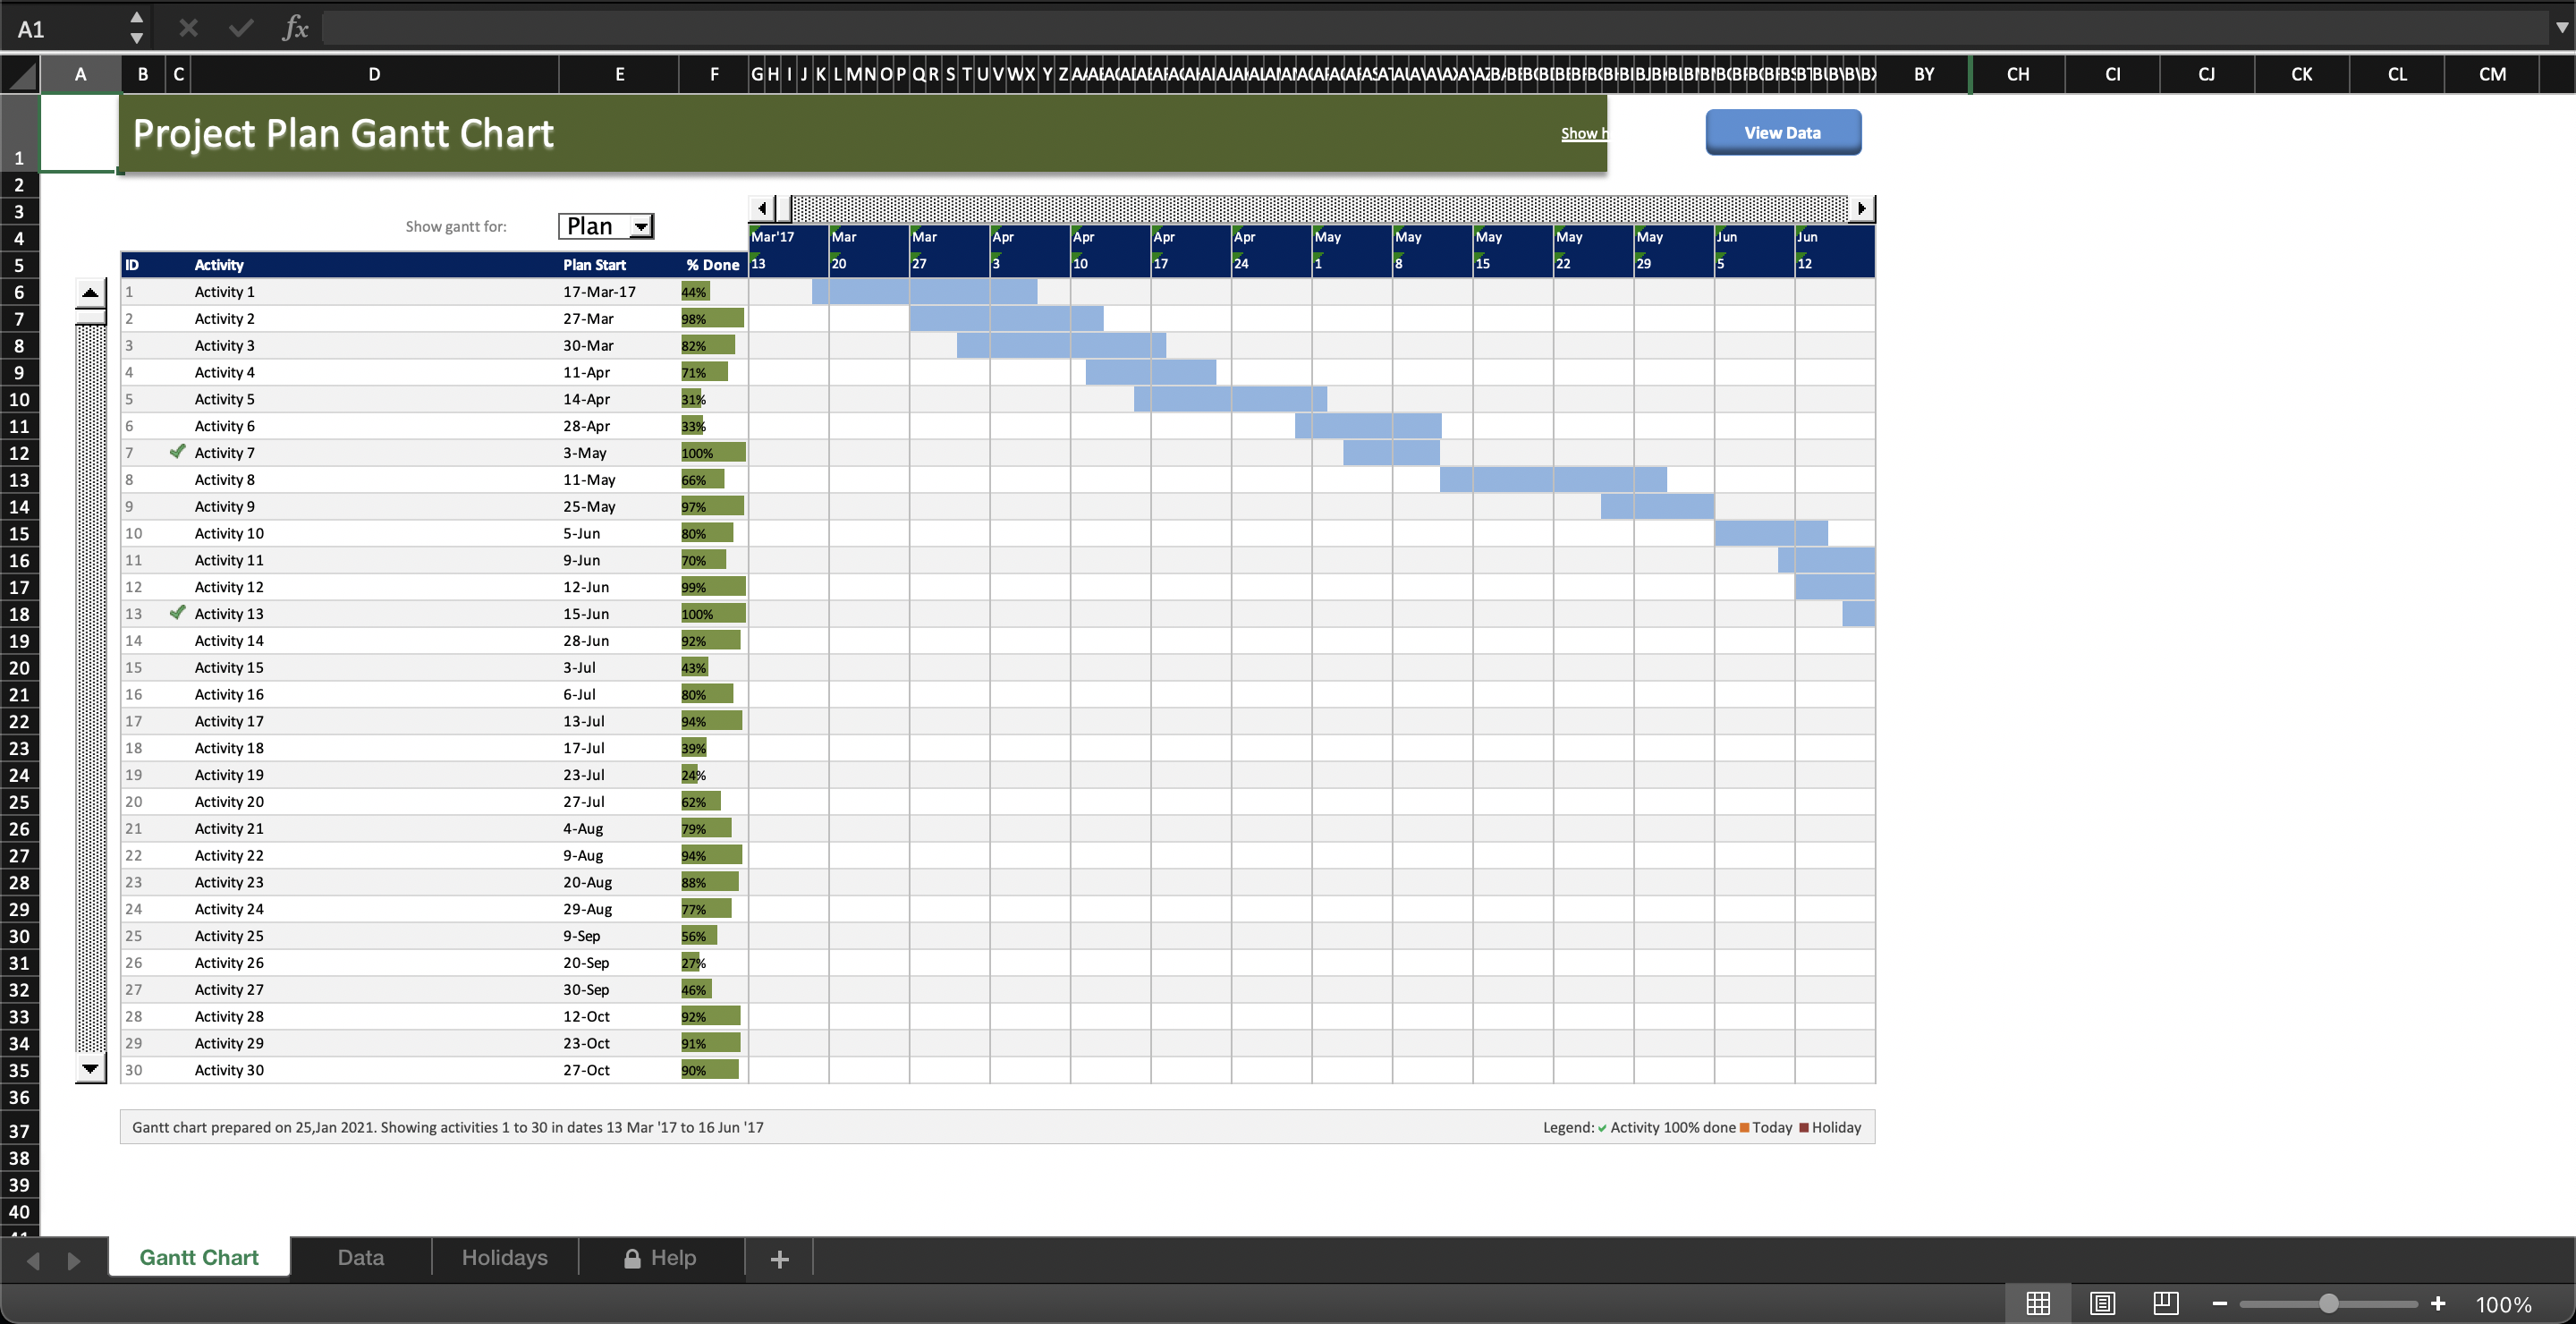
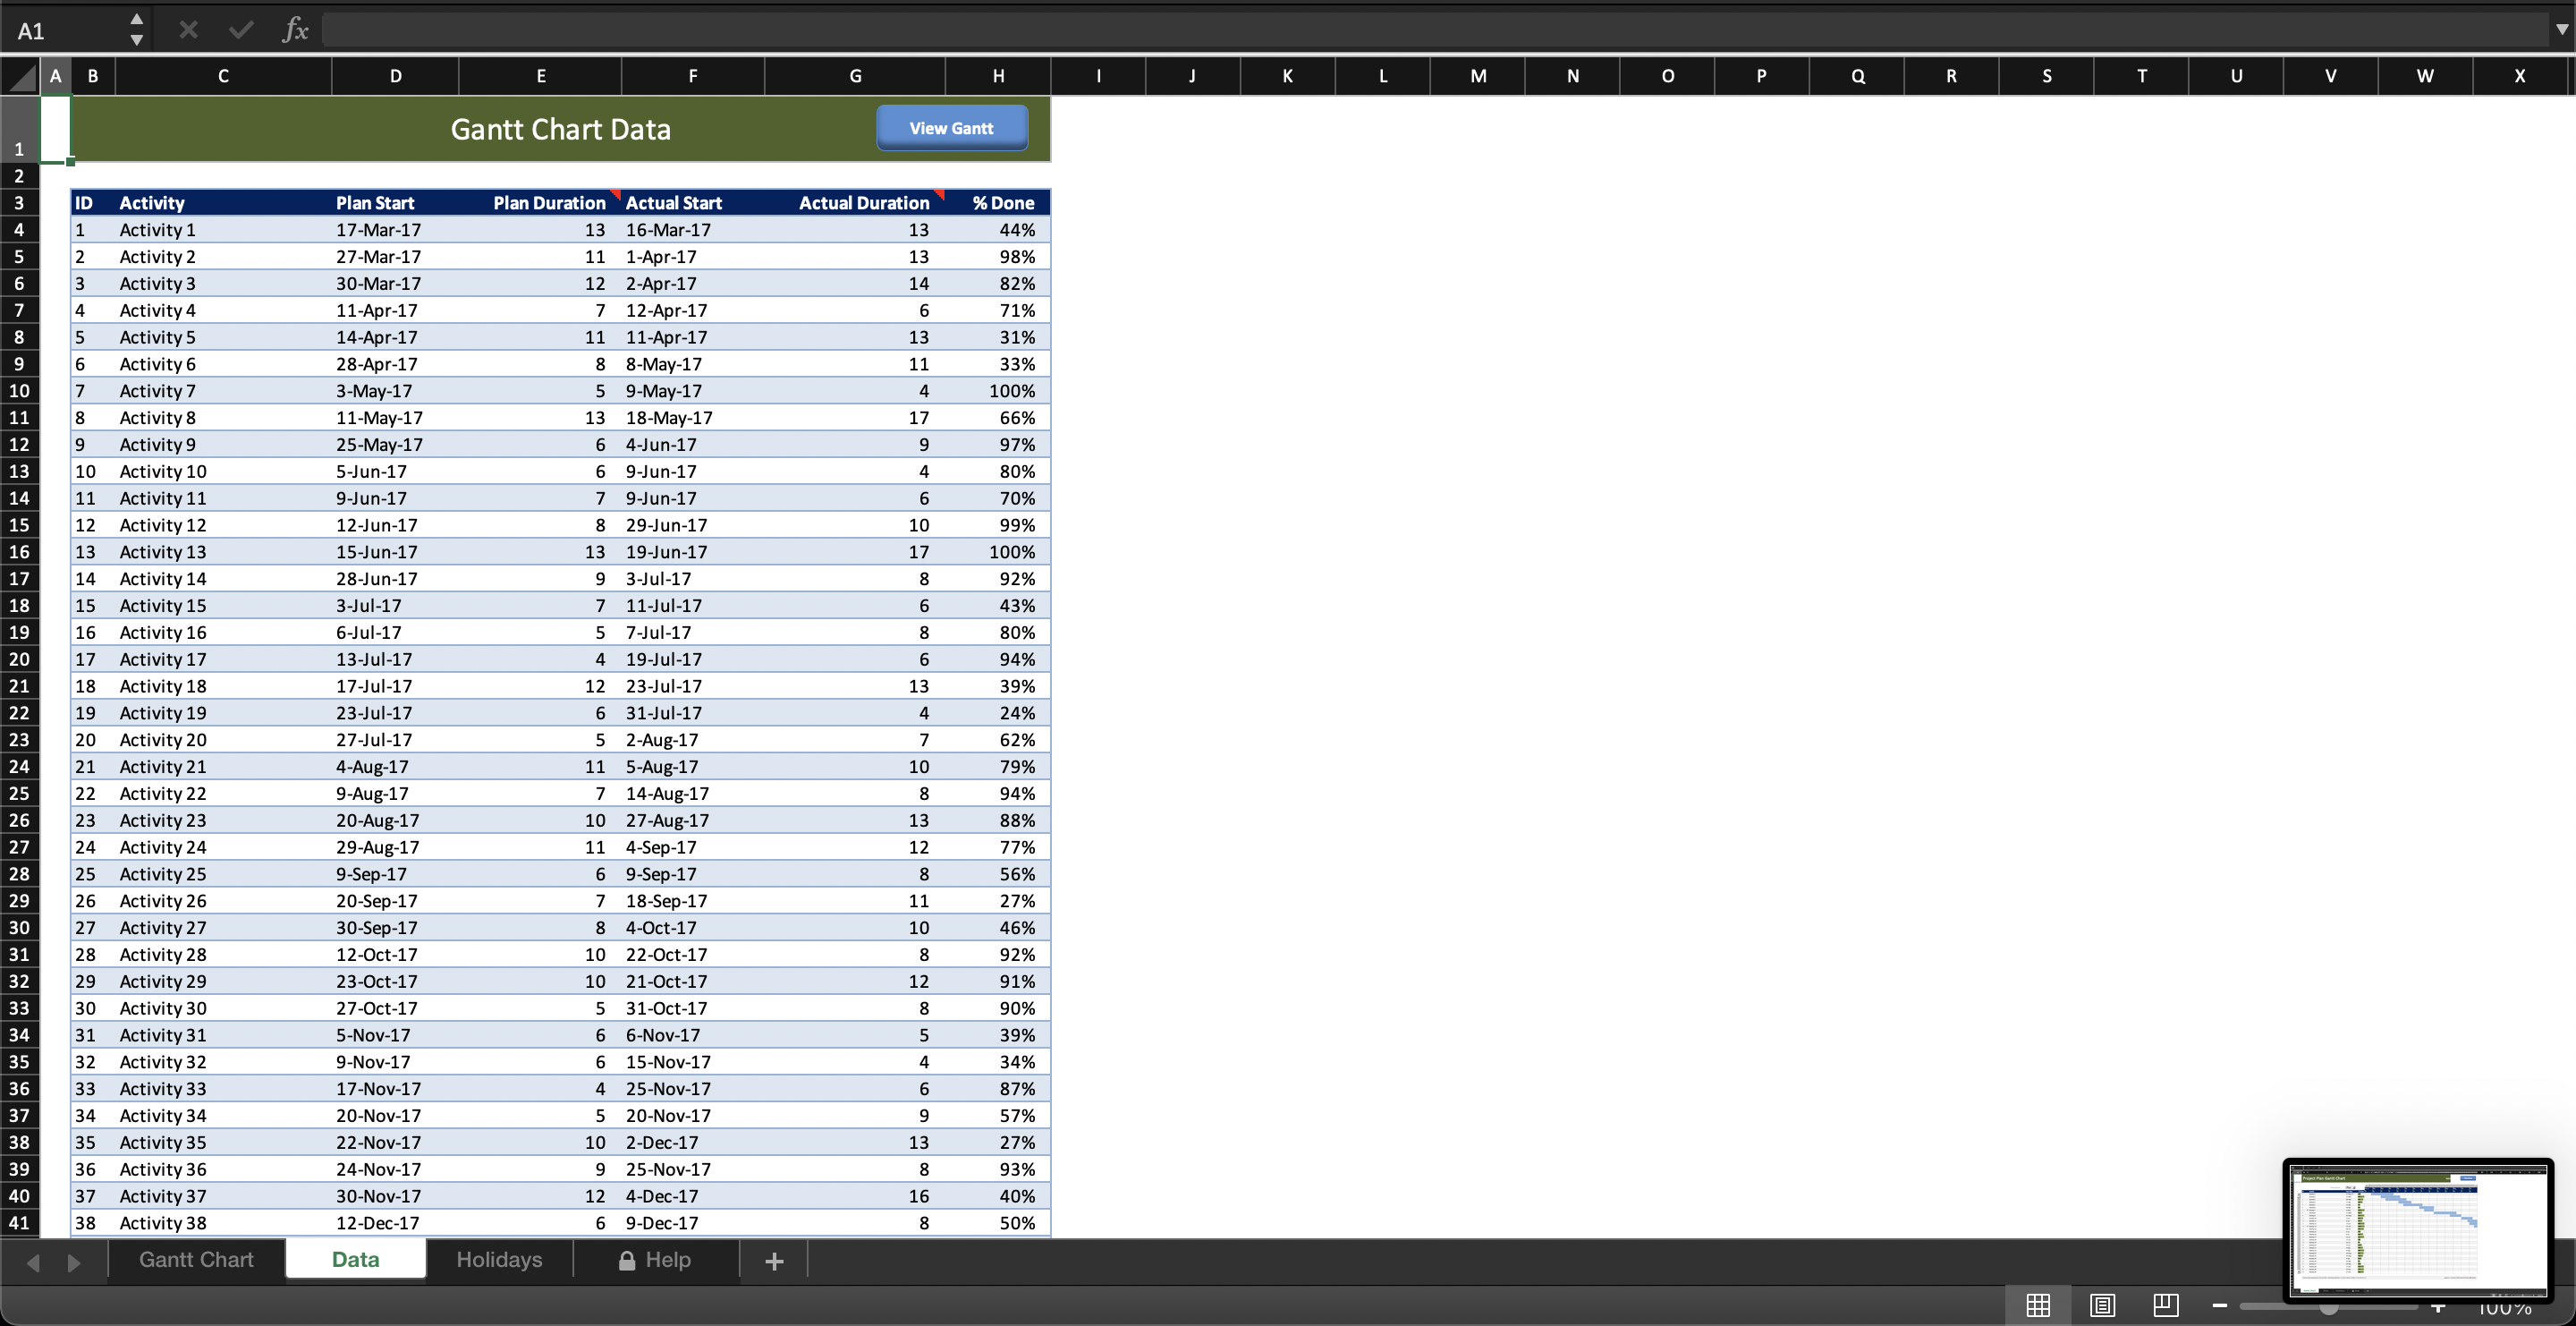
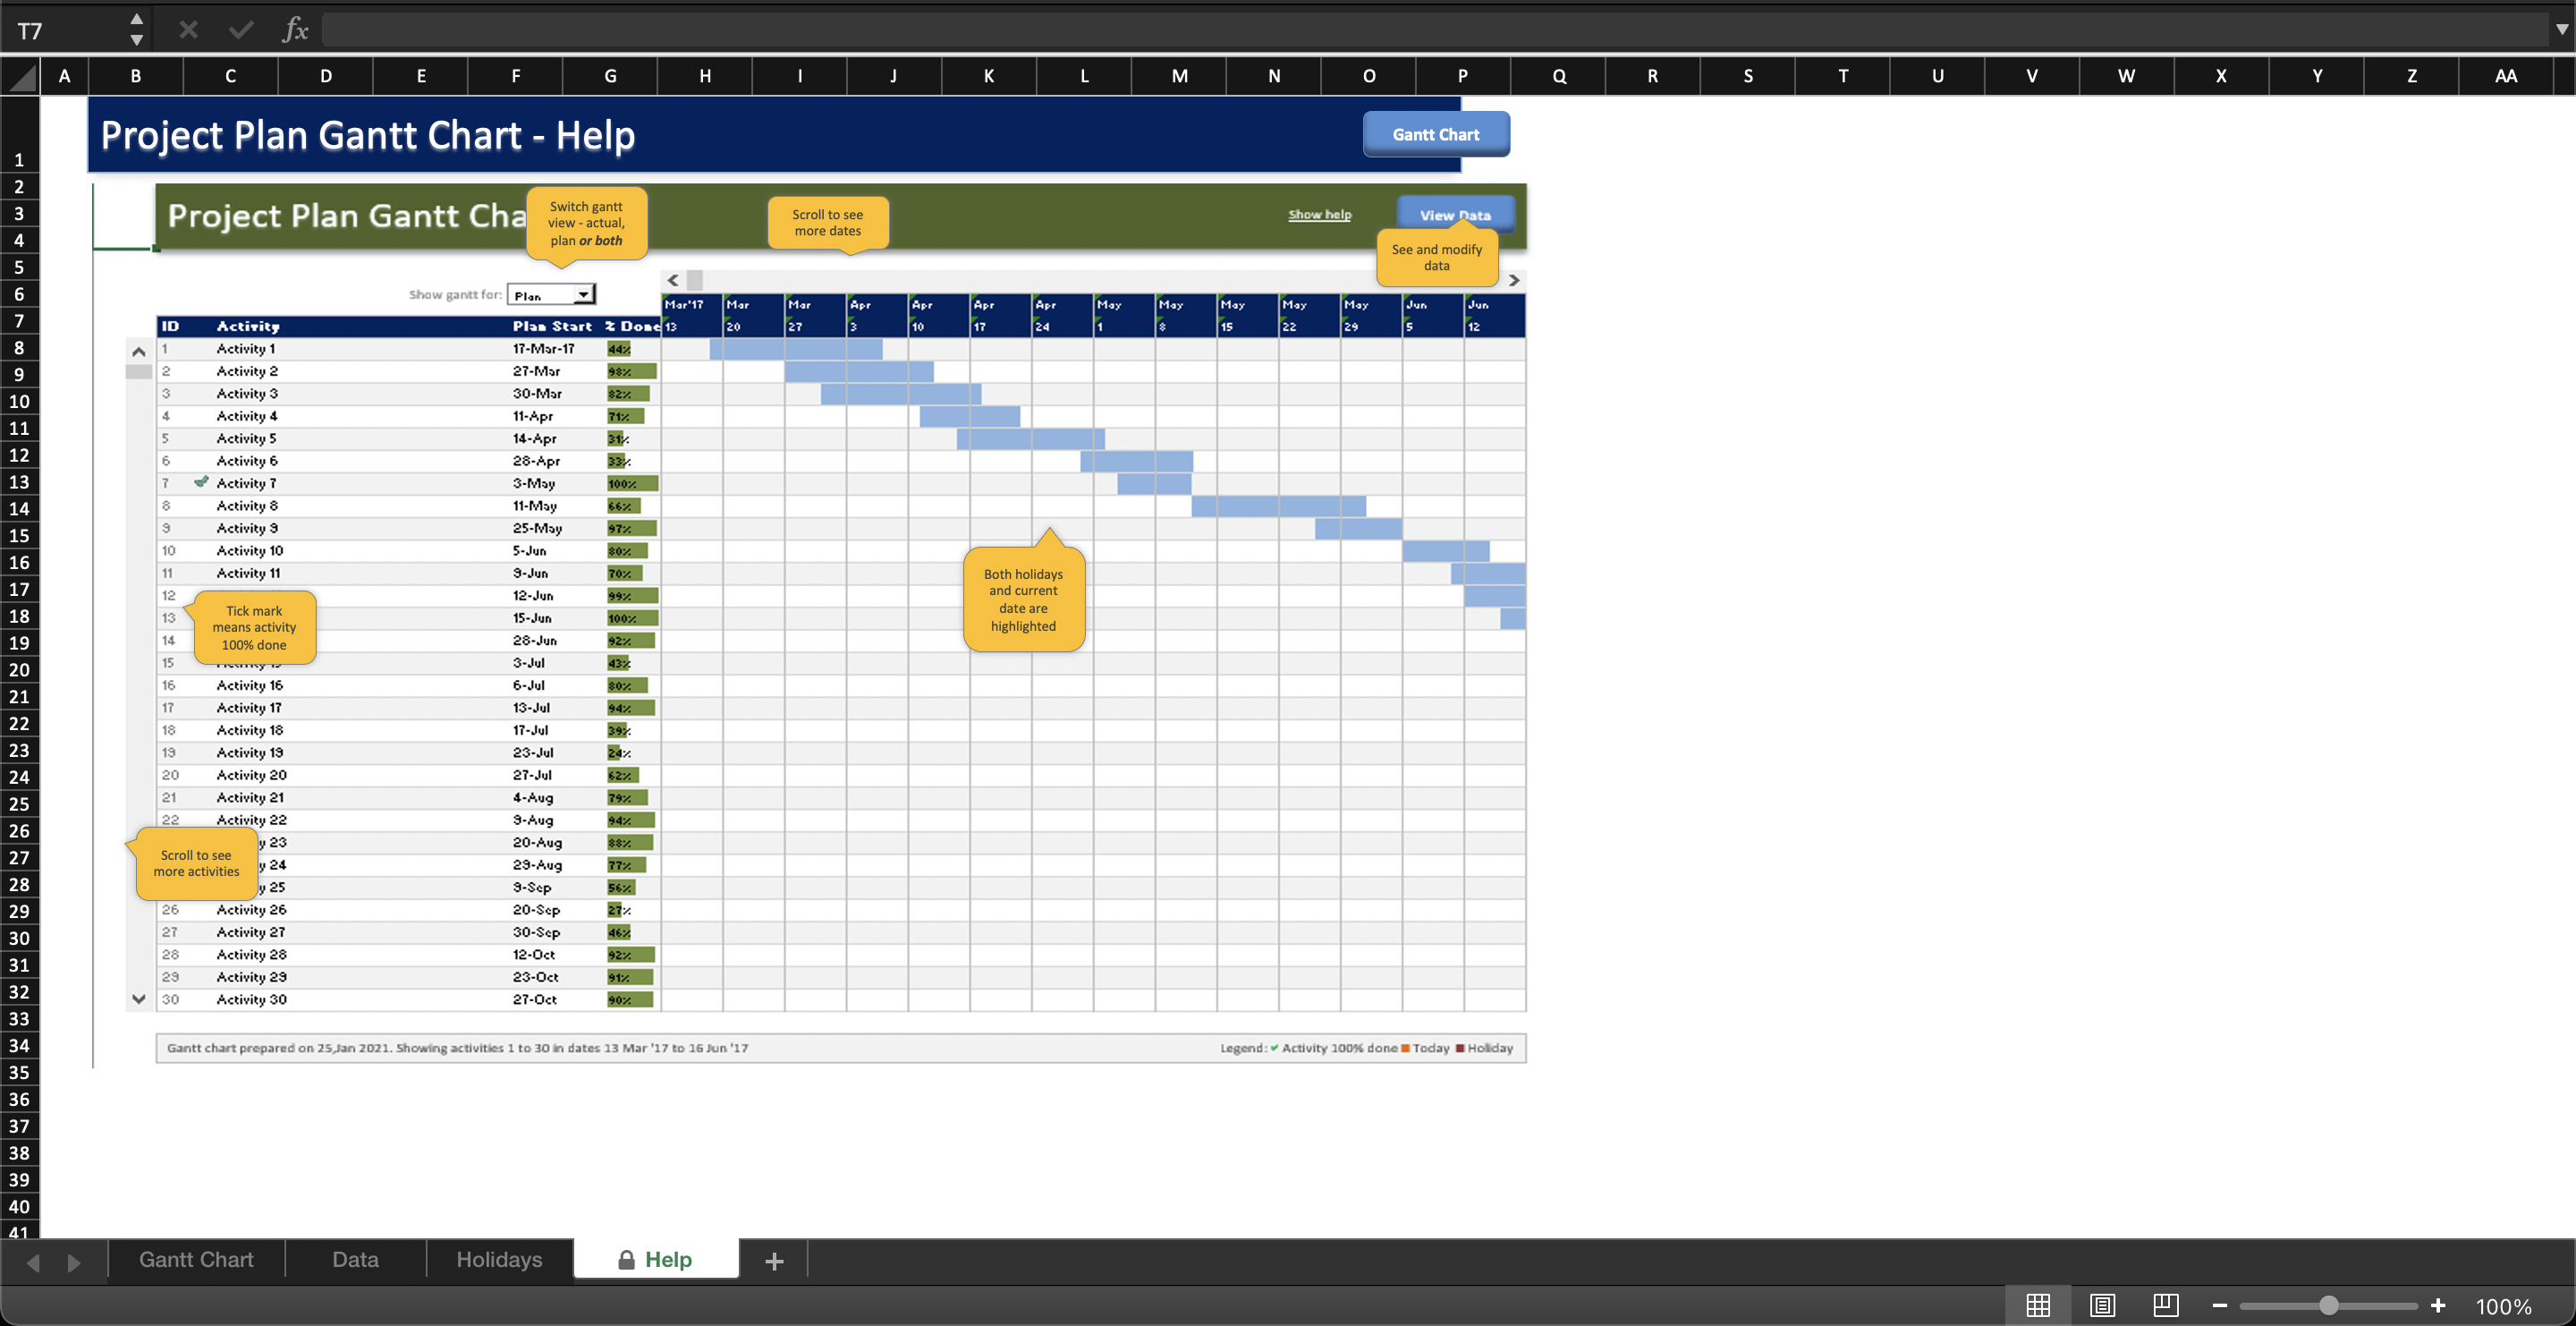
Project Plan Gantt Chart Template
Project Plan Gantt Chart Template in Microsoft Excel to download.
Founder & CEO - Excel Basement, Microsoft MVP (Excel) 2025, MCT, MSOM, Excel & POWER BI Trainer & Consultant, MBA (MIS), Emerging Data ScientistFollow 463
