
Originally published: 05/11/2021 09:45
Last version published: 18/12/2023 08:26
Publication number: ELQ-59134-2
View all versions & Certificate
Last version published: 18/12/2023 08:26
Publication number: ELQ-59134-2
View all versions & Certificate

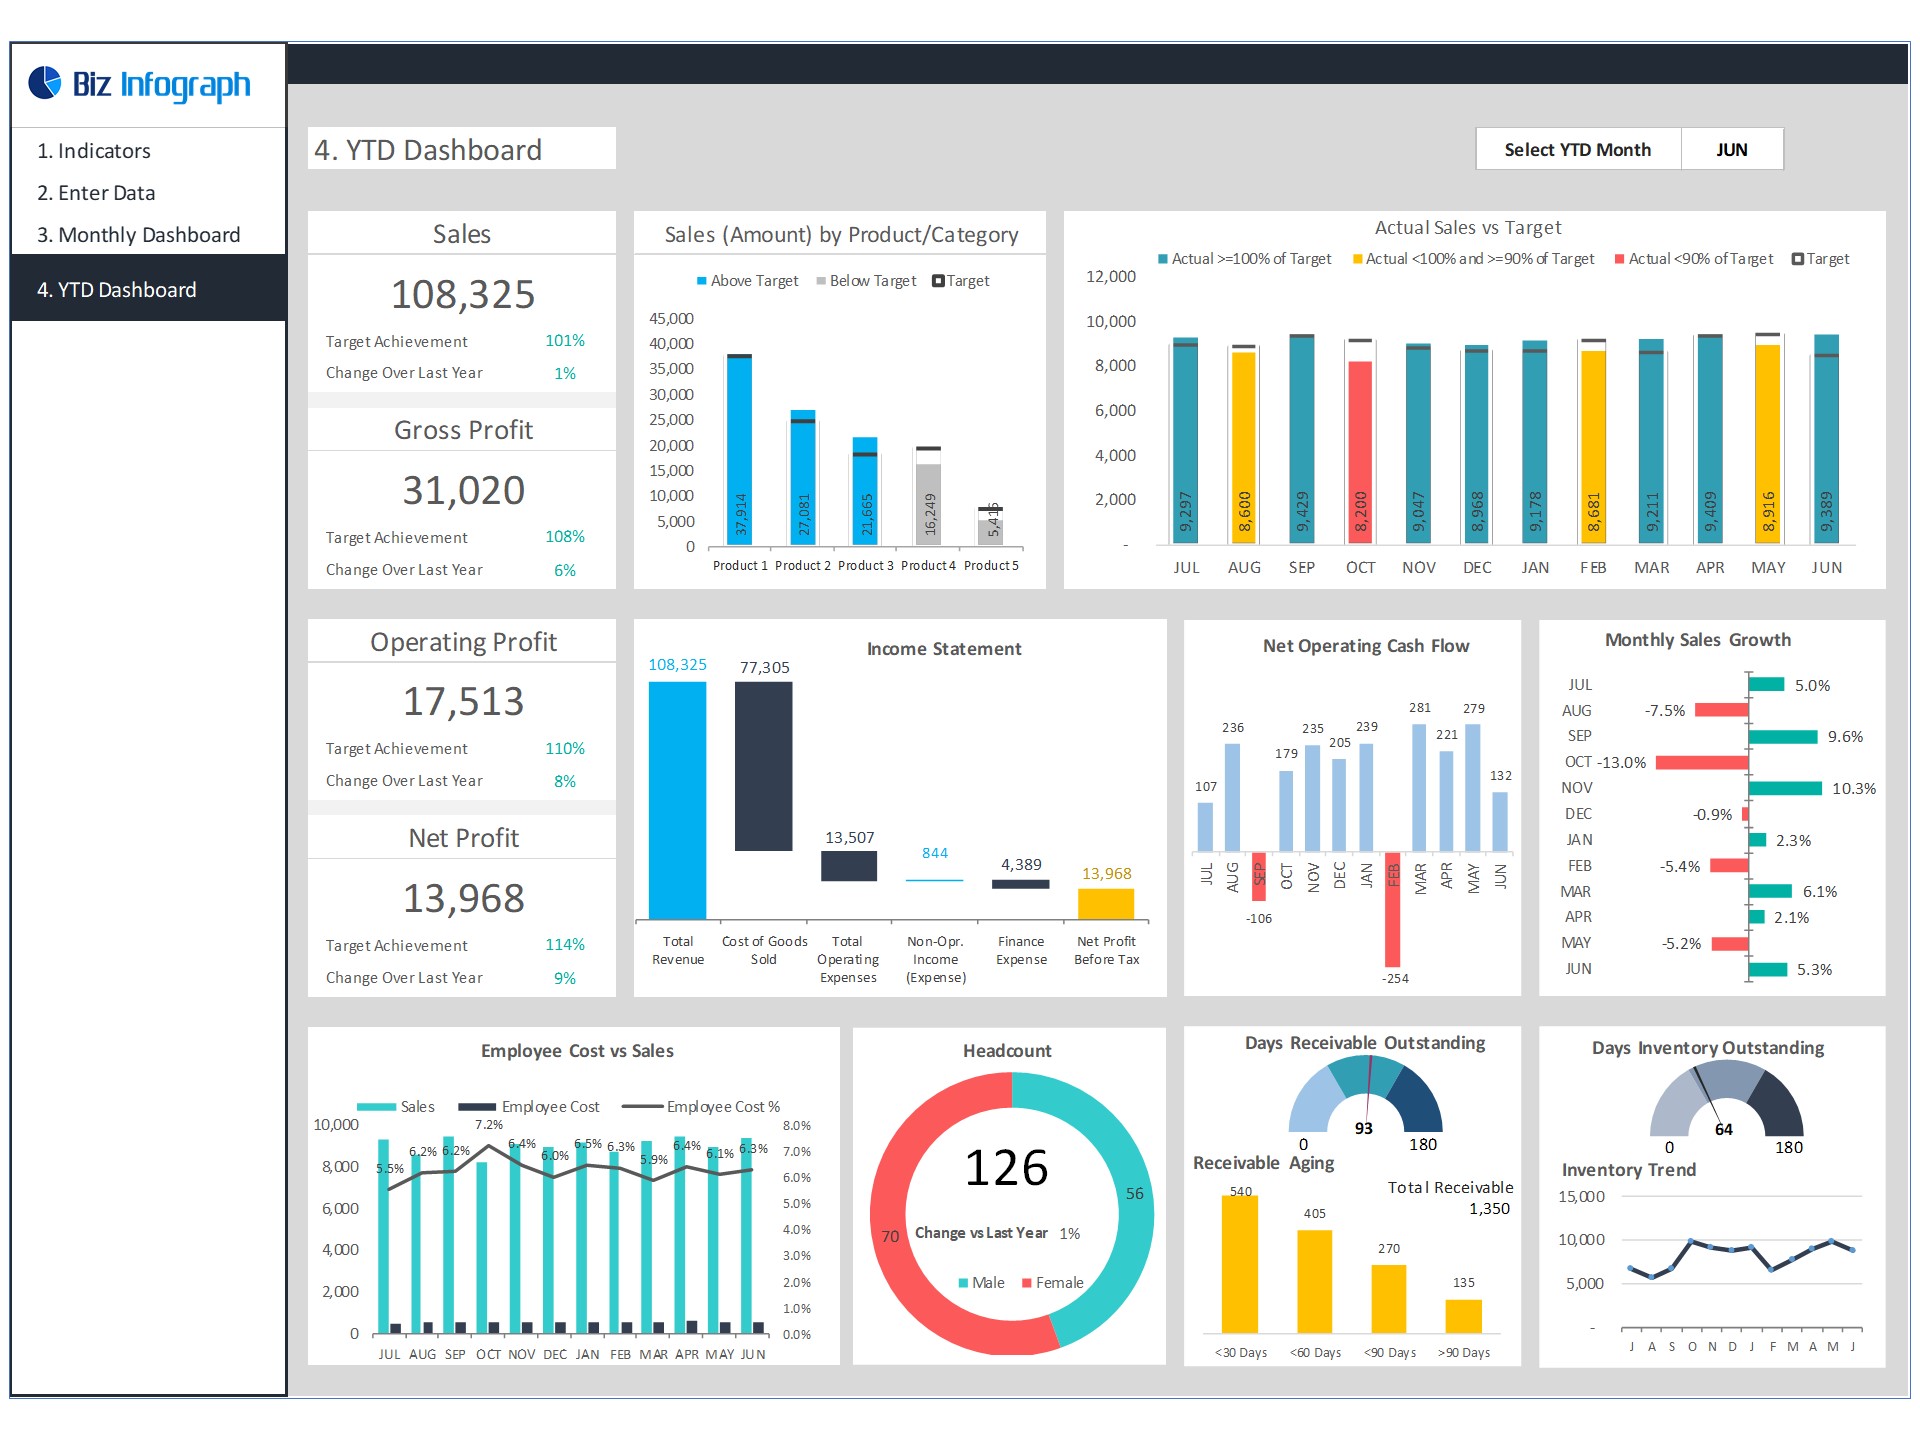
CEO Dashboard - Financial Dashbaord
CEO Dashboard Excel Template
Biz Infograph is bringing clients a range of high-quality, well-designed, and easy-to-use professionally designed slides and dashboards.Follow 10
ceo dashboardfinancial dashboardcfo dashboardexecutive dashboardfinance dashbaorddashboard templateexcel dashboard templateceo dashboard packagemanagement dashbaordcxo dashboard
Description
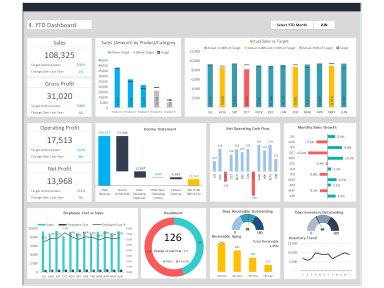
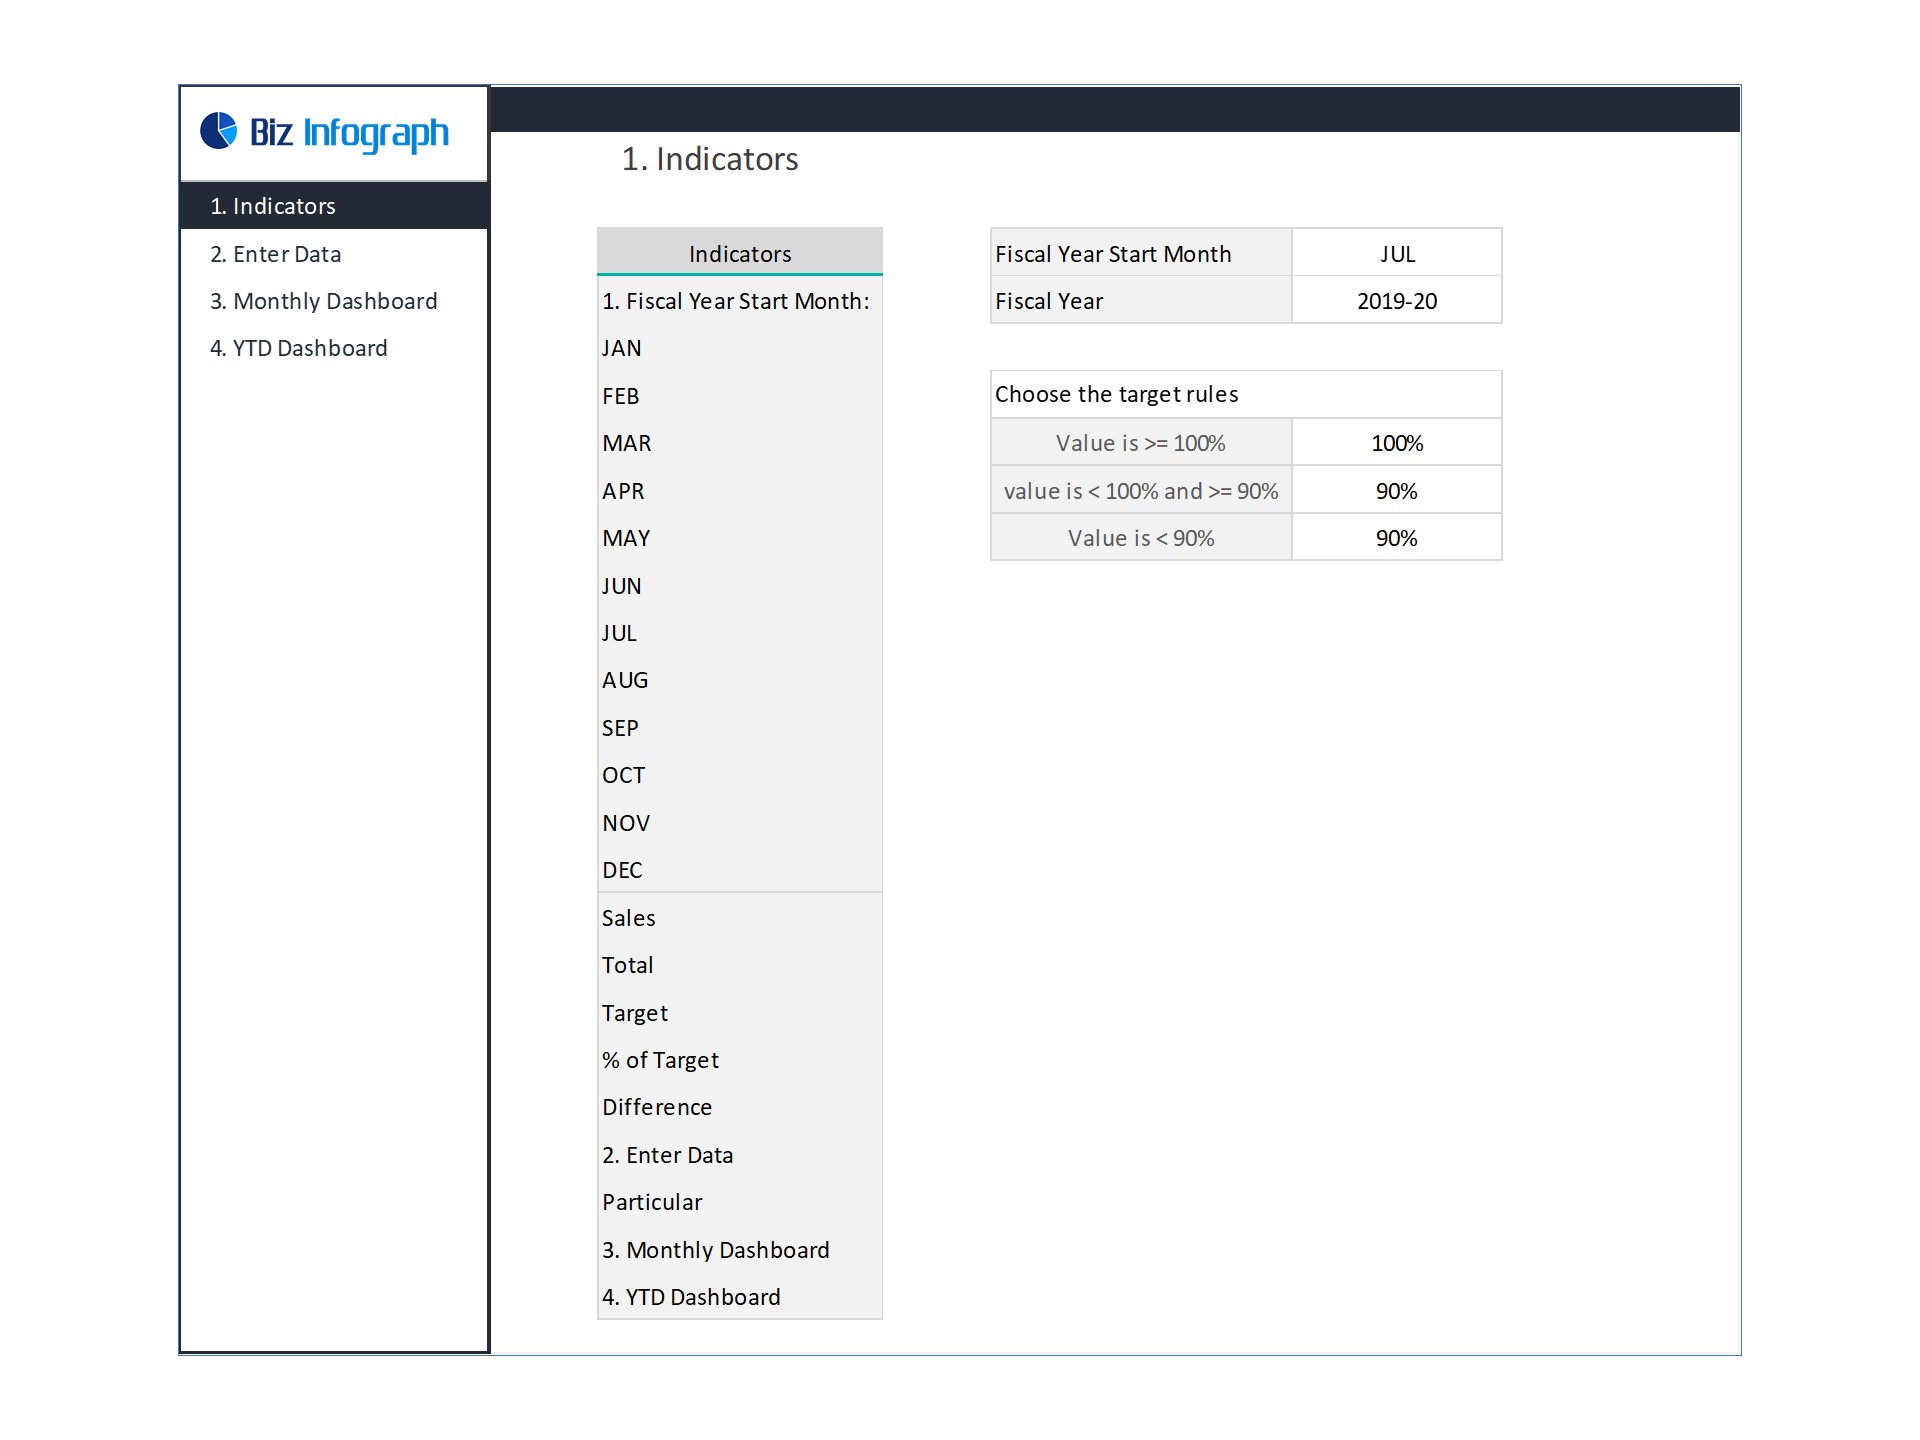
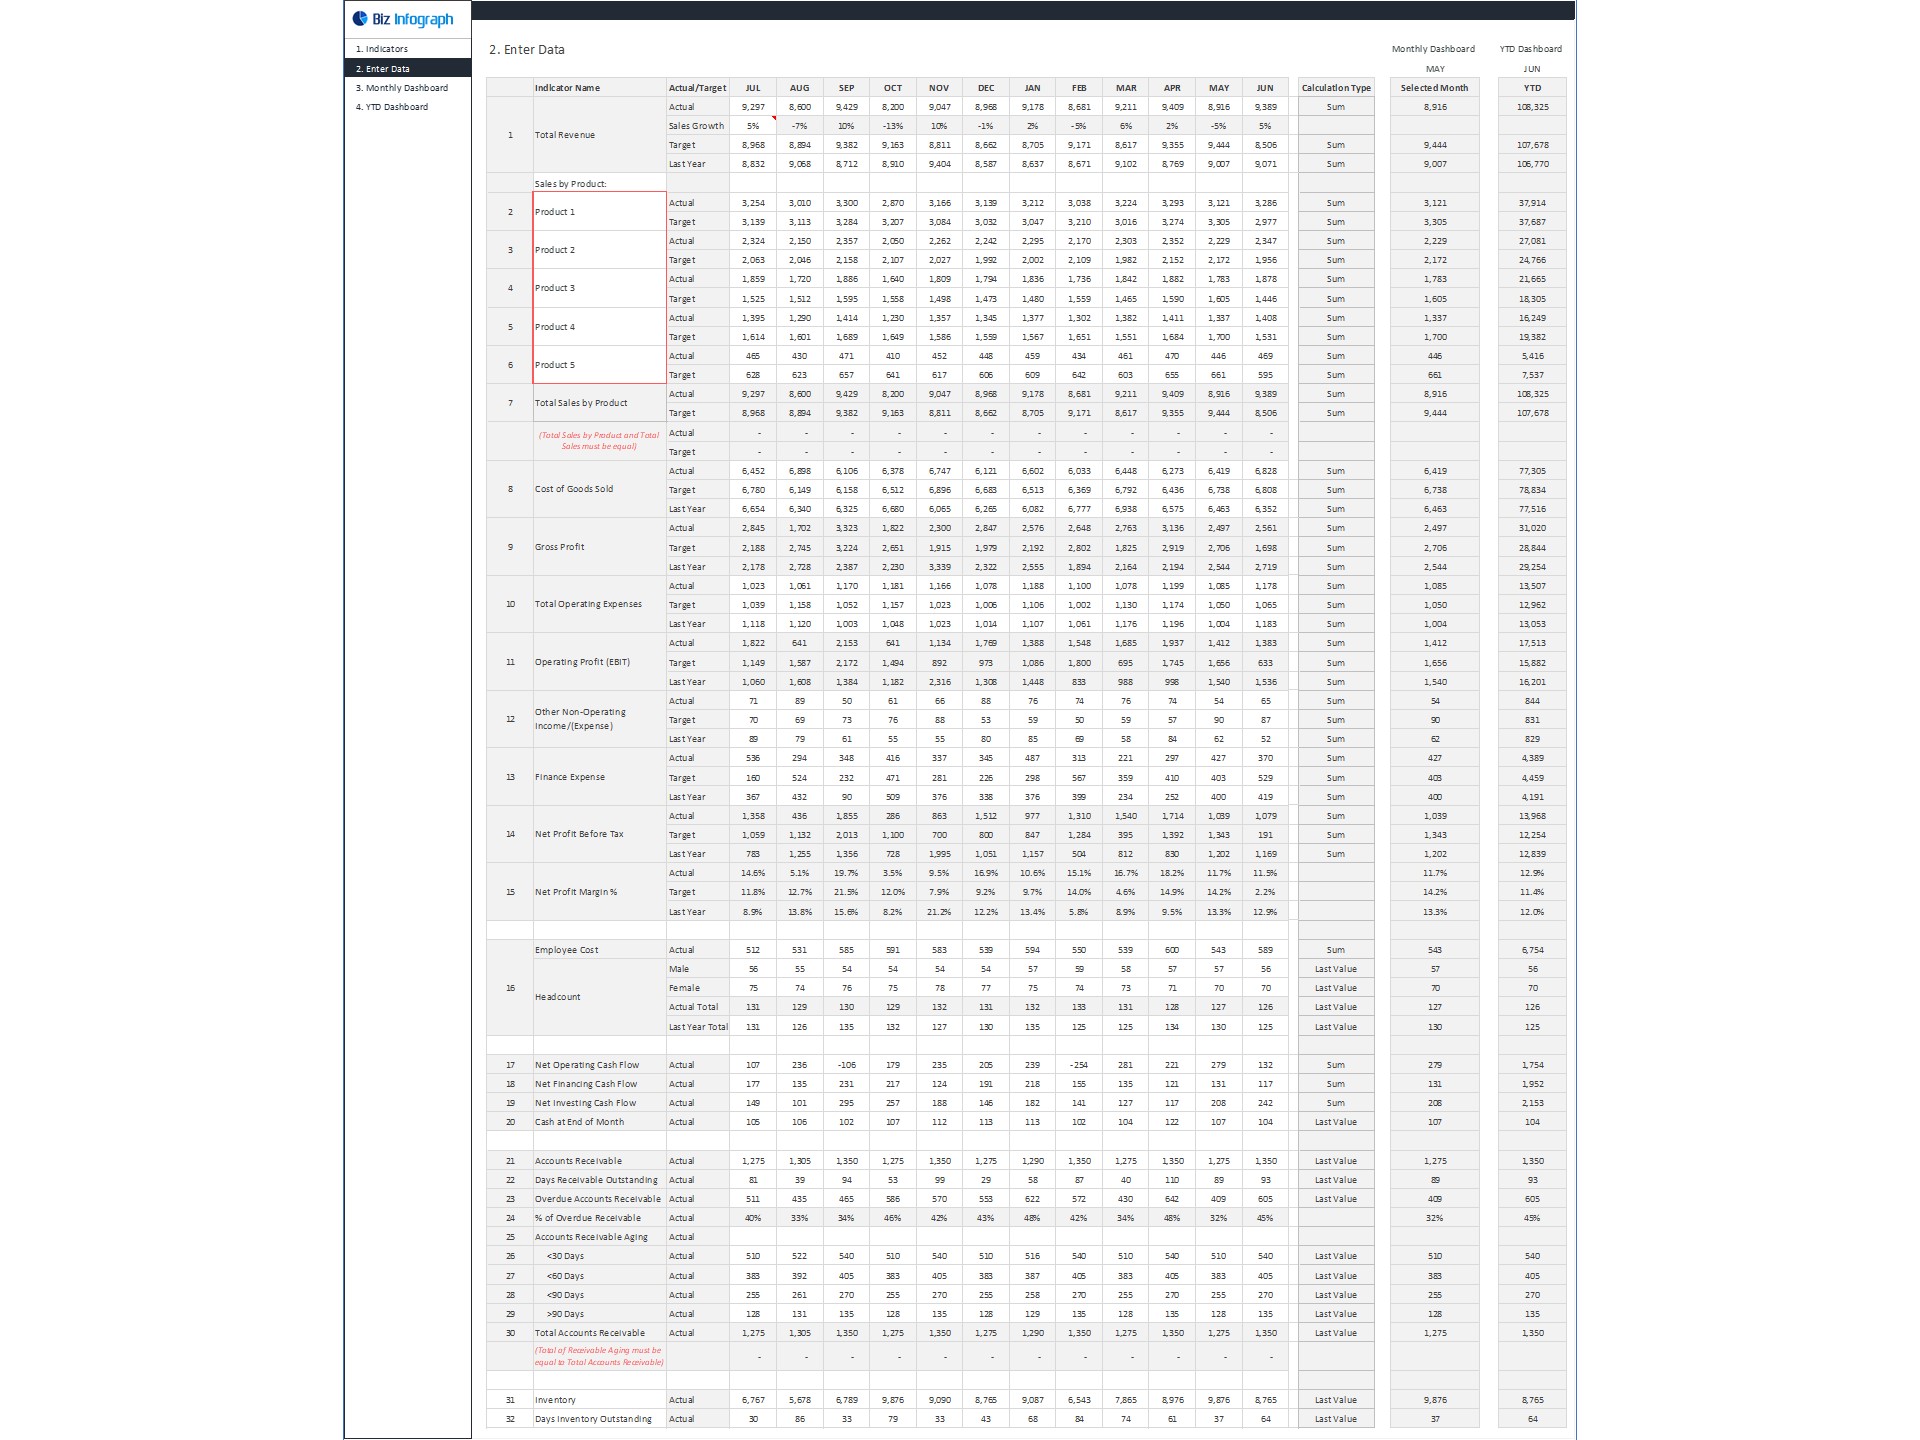
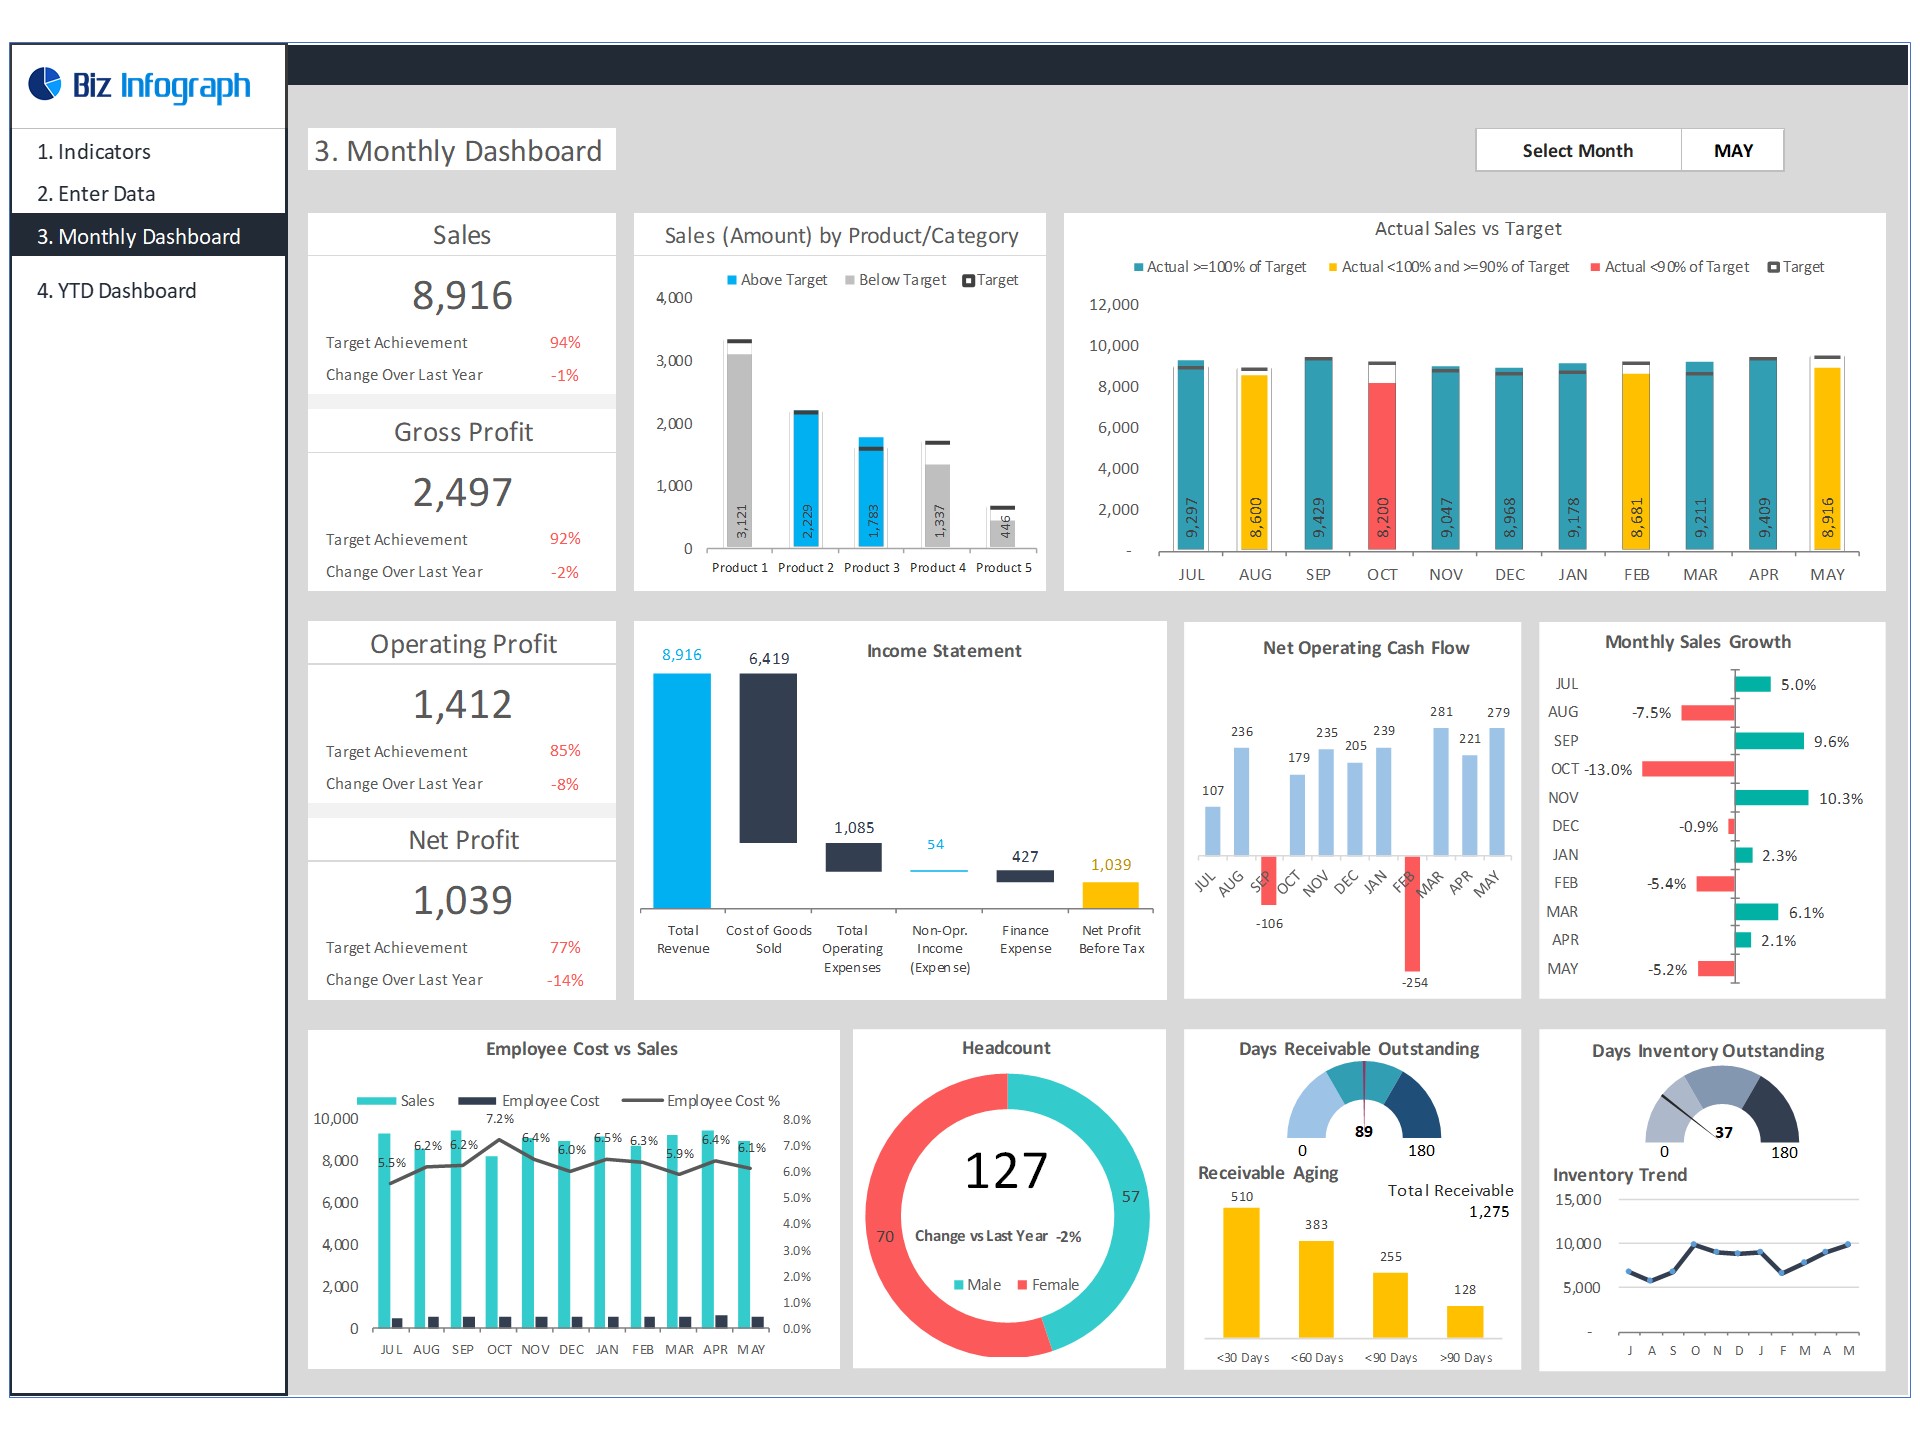
CEO Dashboard is an Excel Template that will help you to appropriately organize major financial business indicators in single view and present the most important business information to your CEO and team in an eye-catching way. This executive dashboard visualizes organizational KPIs, metrics, and data.The objective of CEO Dashboard is to give CEOs an at-a-glance clear picture into business and operational performance across the organization. The CEO is responsible for every aspect of the organization from sales, marketing, financial strategy to human resource management. To gain a wider vision, the CEO needs to embrace the power of digital data with the right tools like a professionally designed CEO Dashboard.The CEO Dashboard helps to equip the modern CEO to get a high-level overview of the most important CEO metrics for better and improved decision making. This CEO dashboard template in Excel covers key business metrics like total sales, sales by product/category, monthly sales actual vs budget, key profitability indicators of gross profit, operating profit, and net profit. Major KPIs and metrics covered in the CEO dashboard template:Revenue: top line of the income statement with target achievement and growth over the last period, revenue growth month-to-month, revenue segregation in product/categoryGross profit: product contribution to the business to cover operating expense and finance costOperating profit: earnings before tax and interest - what’s left from the revenue after paying the cost of goods sold and operational cost.Net profit: residual amount after paying operating cost and finance cost for the shareholdersIncome statement: income and expense summary in the waterfall chartCash flow: net operating cash flow on a month by monthHuman resources: headcount, total employee cost, and employee expense as a percentage of total revenueWorking capital components: key working capital indicators like days receivable outstanding, receivable aging, days inventory outstanding, and inventory trend.Key Features:Provides key business insights for CEO regarding sales, income statement, cash flow, balance sheet, and human resourcesFully editable, easy to use, template with sample dataEye-catching design and customizableChange the sample data with your dataSpreadsheets ready for printing without Biz Infograph logoConsolidate key business performance indicators in one dashboardNo monthly feesImmediate downloadNo VBA, no MacroNo installation necessaryProfessionally designedWhat is included in this dashboard template?Just plug your data, the rest dashboard will be ready instantly and start using. A text file which contains a password to view and edit the formulaA guide to unlocking all the elements in the dashboardProfessional Support:Video tutorial guide on how to navigate and use CEO Dashboard TemplateProfessional service to customize dashboard template in excel as per business needHelp and support in post-purchasePayment secured by Stripe and PayPal (no PayPal account needed)A brief guide to using the dashboard template:Open the dashboard templateGo to the ‘Indicators’ menu – choose the start month of the fiscal year (i.e. Jan, Feb, Jul, etc.). Next choose the target rules (e.g. value >=100%, value =90%, value
CEO Dashboard is an Excel Template that will help you to appropriately organize major financial business indicators in single view and present the most important business information to your CEO and team in an eye-catching way. This executive dashboard visualizes organizational KPIs, metrics, and data.The objective of CEO Dashboard is to give CEOs an at-a-glance clear picture into business and operational performance across the organization. The CEO is responsible for every aspect of the organization from sales, marketing, financial strategy to human resource management. To gain a wider vision, the CEO needs to embrace the power of digital data with the right tools like a professionally designed CEO Dashboard.The CEO Dashboard helps to equip the modern CEO to get a high-level overview of the most important CEO metrics for better and improved decision making. This CEO dashboard template in Excel covers key business metrics like total sales, sales by product/category, monthly sales actual vs budget, key profitability indicators of gross profit, operating profit, and net profit. Major KPIs and metrics covered in the CEO dashboard template:Revenue: top line of the income statement with target achievement and growth over the last period, revenue growth month-to-month, revenue segregation in product/categoryGross profit: product contribution to the business to cover operating expense and finance costOperating profit: earnings before tax and interest - what’s left from the revenue after paying the cost of goods sold and operational cost.Net profit: residual amount after paying operating cost and finance cost for the shareholdersIncome statement: income and expense summary in the waterfall chartCash flow: net operating cash flow on a month by monthHuman resources: headcount, total employee cost, and employee expense as a percentage of total revenueWorking capital components: key working capital indicators like days receivable outstanding, receivable aging, days inventory outstanding, and inventory trend.Key Features:Provides key business insights for CEO regarding sales, income statement, cash flow, balance sheet, and human resourcesFully editable, easy to use, template with sample dataEye-catching design and customizableChange the sample data with your dataSpreadsheets ready for printing without Biz Infograph logoConsolidate key business performance indicators in one dashboardNo monthly feesImmediate downloadNo VBA, no MacroNo installation necessaryProfessionally designedWhat is included in this dashboard template?Just plug your data, the rest dashboard will be ready instantly and start using. A text file which contains a password to view and edit the formulaA guide to unlocking all the elements in the dashboardProfessional Support:Video tutorial guide on how to navigate and use CEO Dashboard TemplateProfessional service to customize dashboard template in excel as per business needHelp and support in post-purchasePayment secured by Stripe and PayPal (no PayPal account needed)A brief guide to using the dashboard template:Open the dashboard templateGo to the ‘Indicators’ menu – choose the start month of the fiscal year (i.e. Jan, Feb, Jul, etc.). Next choose the target rules (e.g. value >=100%, value =90%, value
This Best Practice includes
Excel File with doc file for password
Further information
Dynamic, flexible and easy-to-edit dashboard template
Performance Reporting
