
Originally published: 13/04/2020 07:26
Publication number: ELQ-49658-1
View all versions & Certificate
Publication number: ELQ-49658-1
View all versions & Certificate

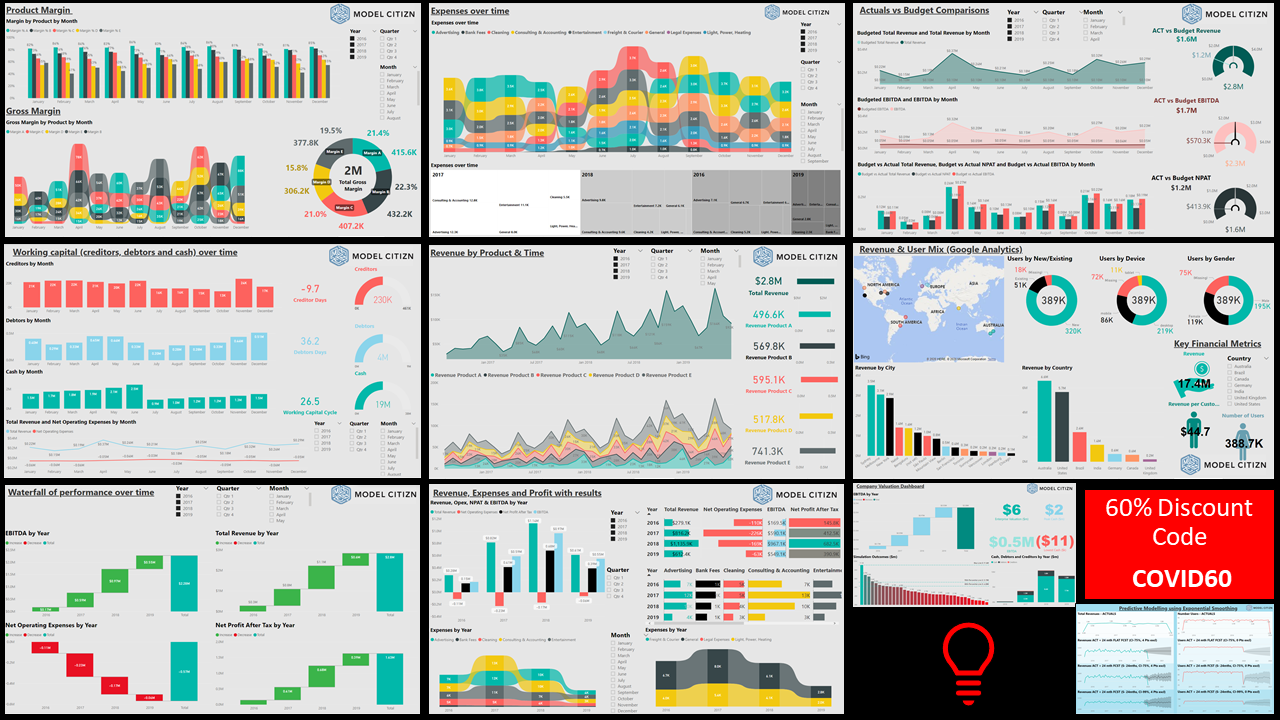
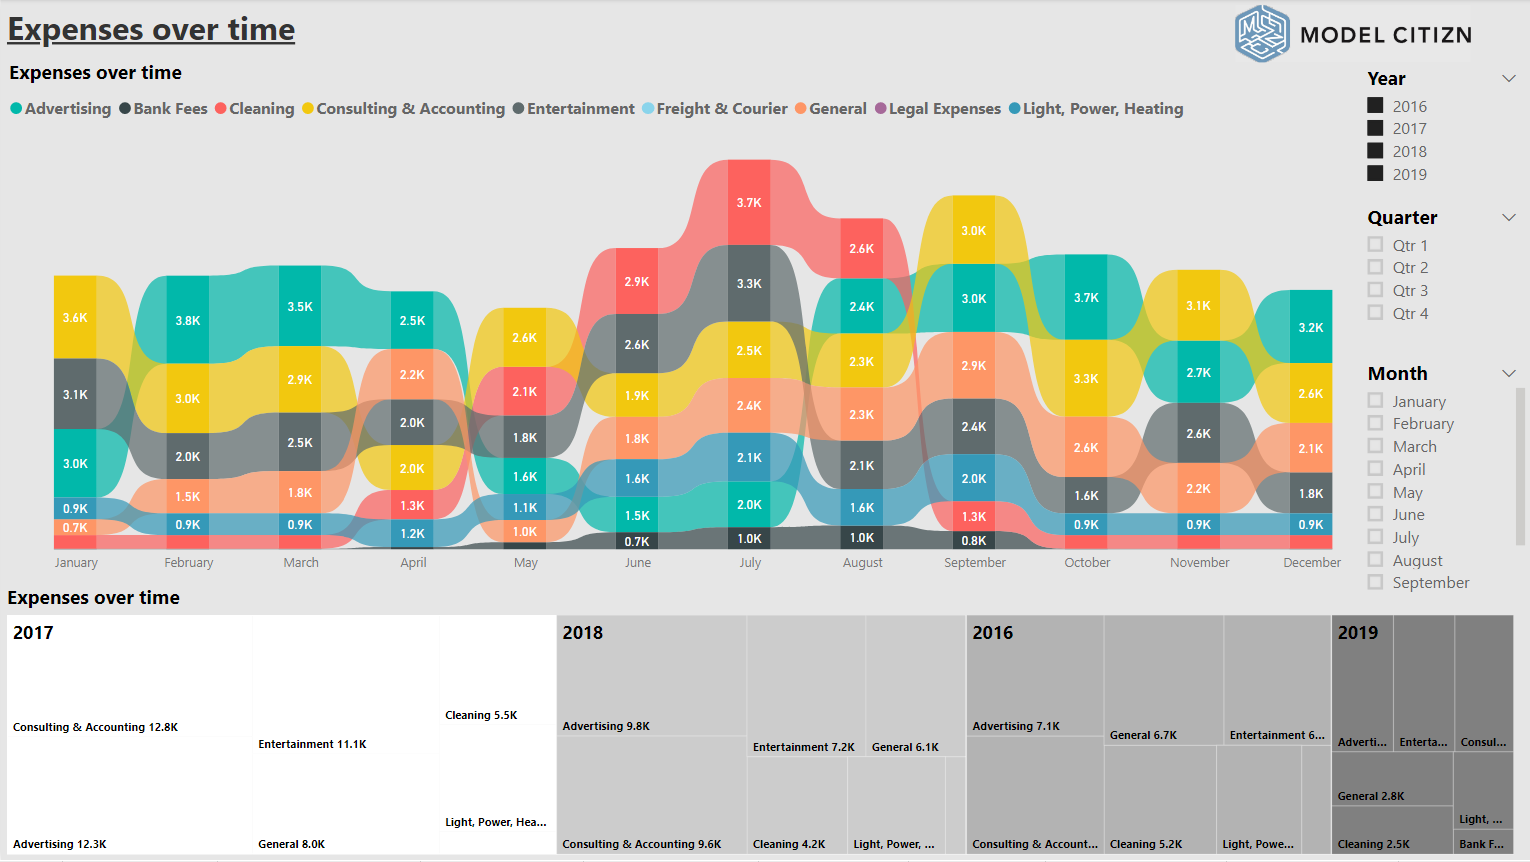
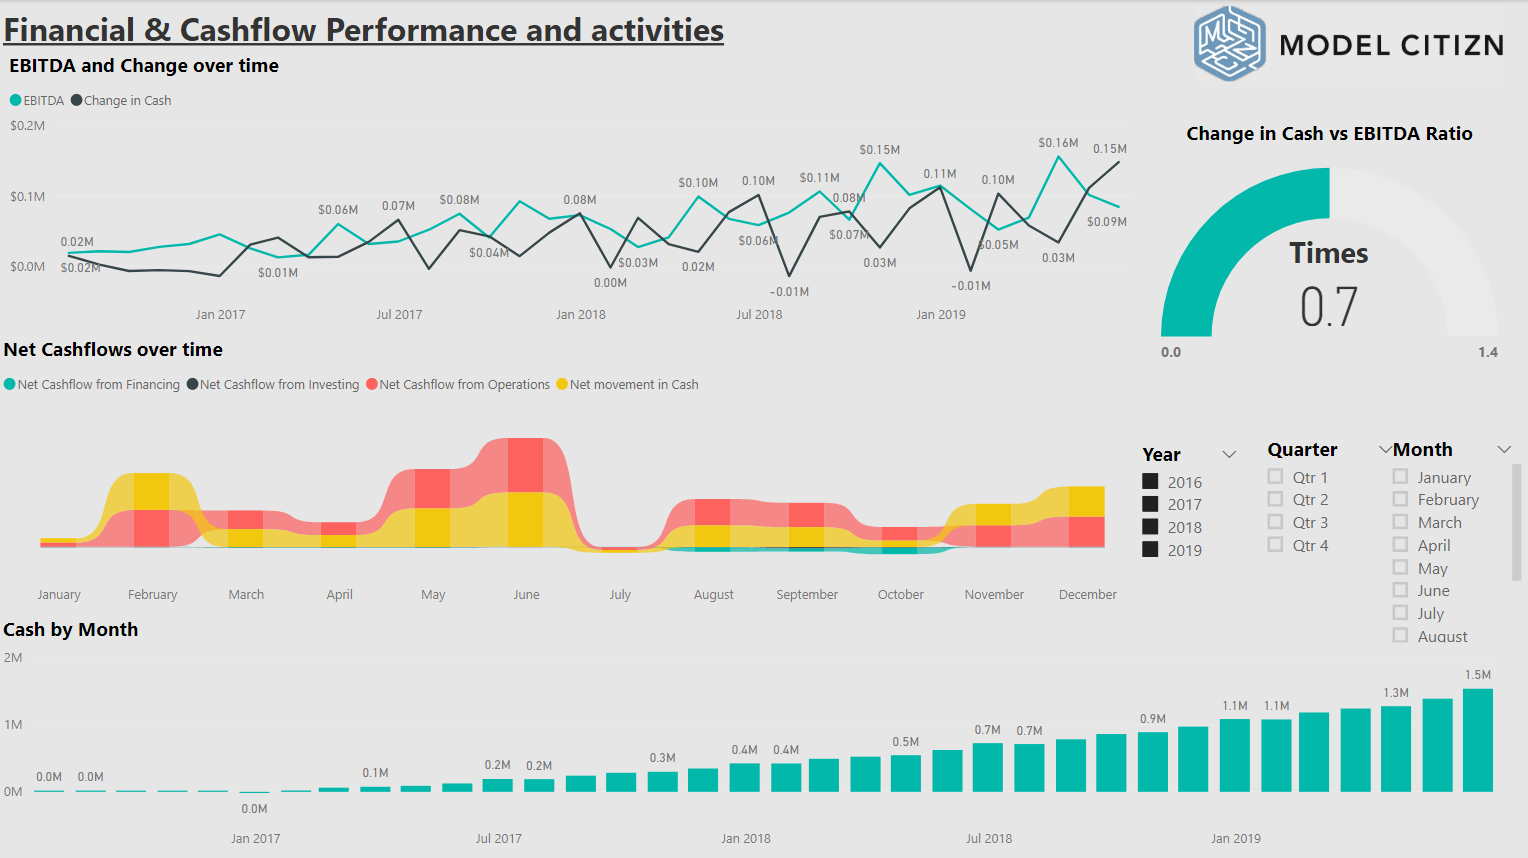
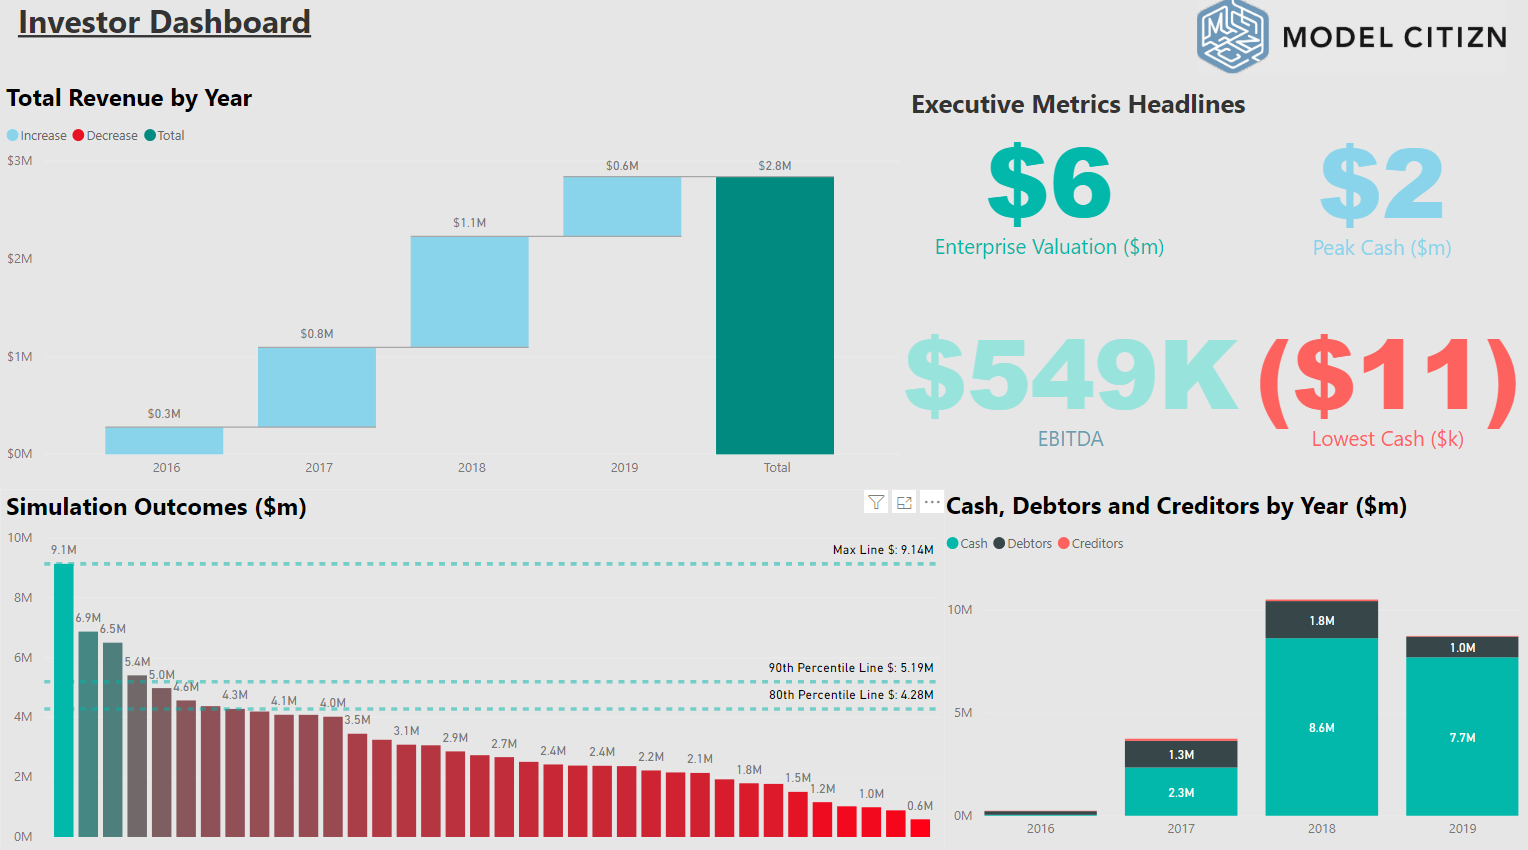
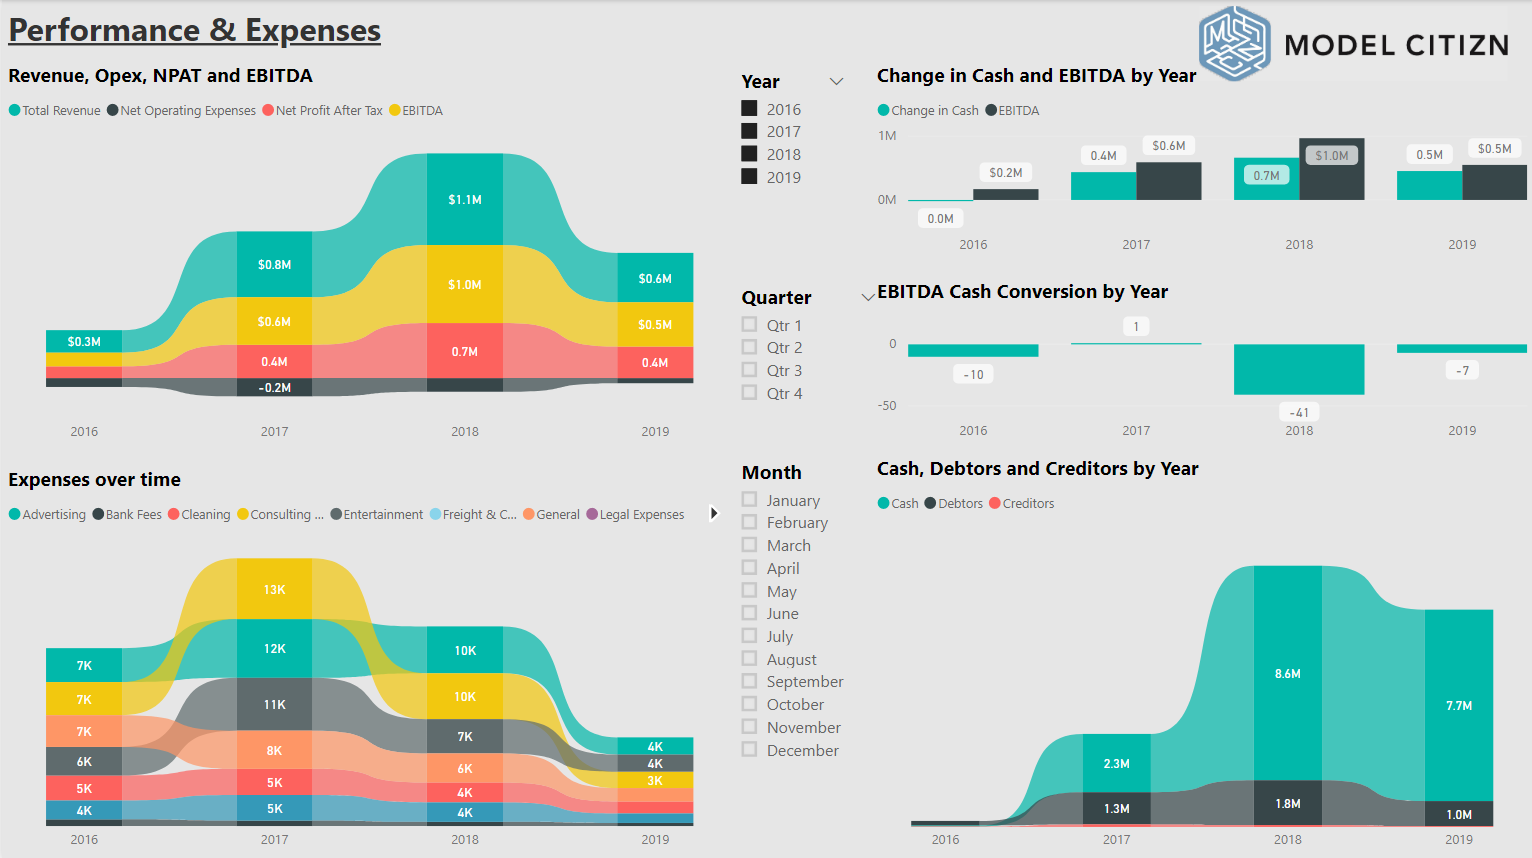
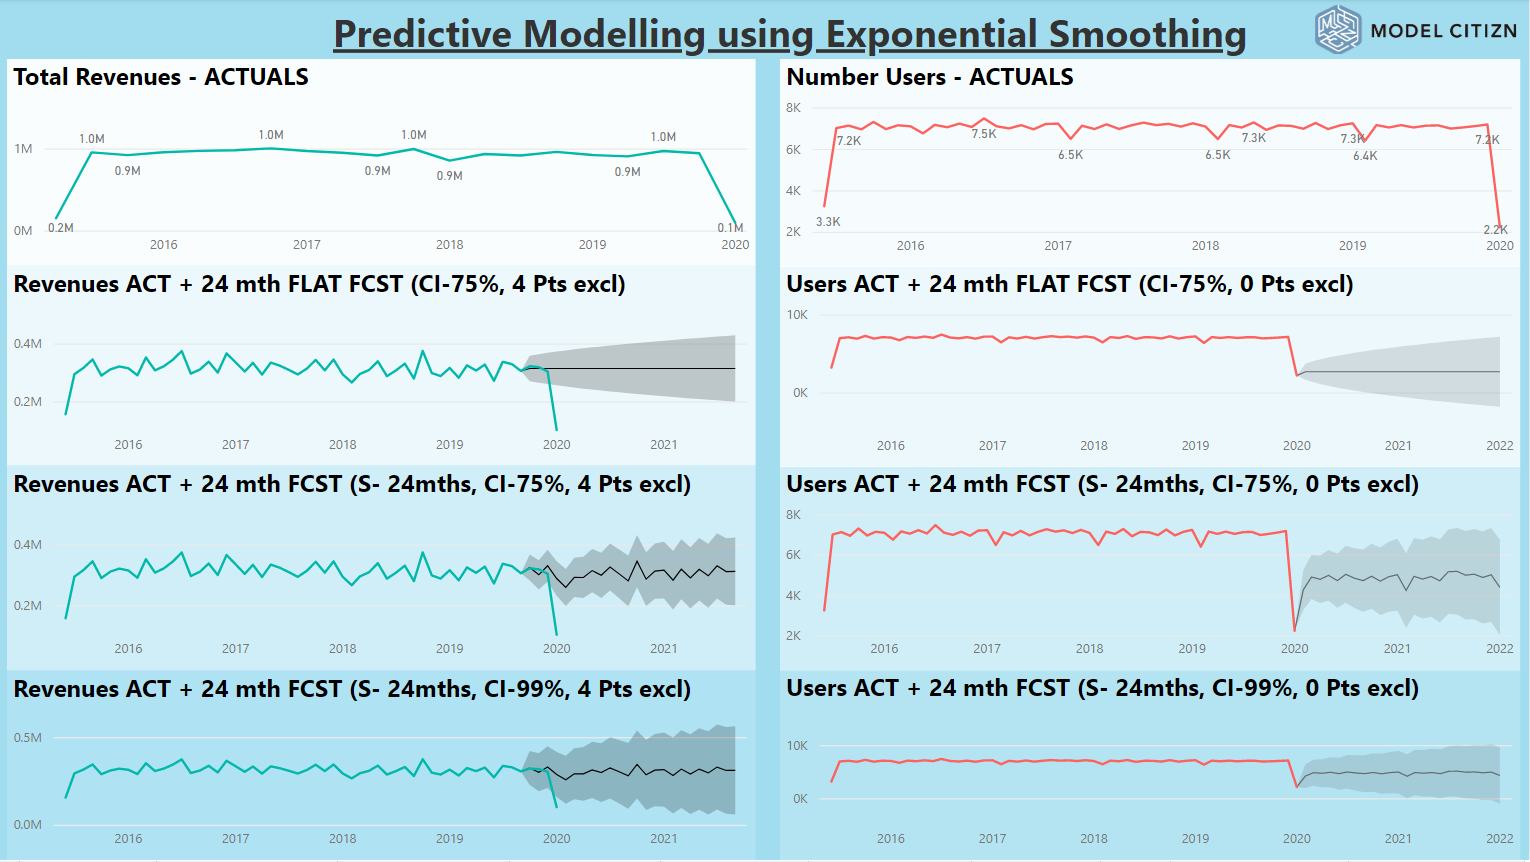
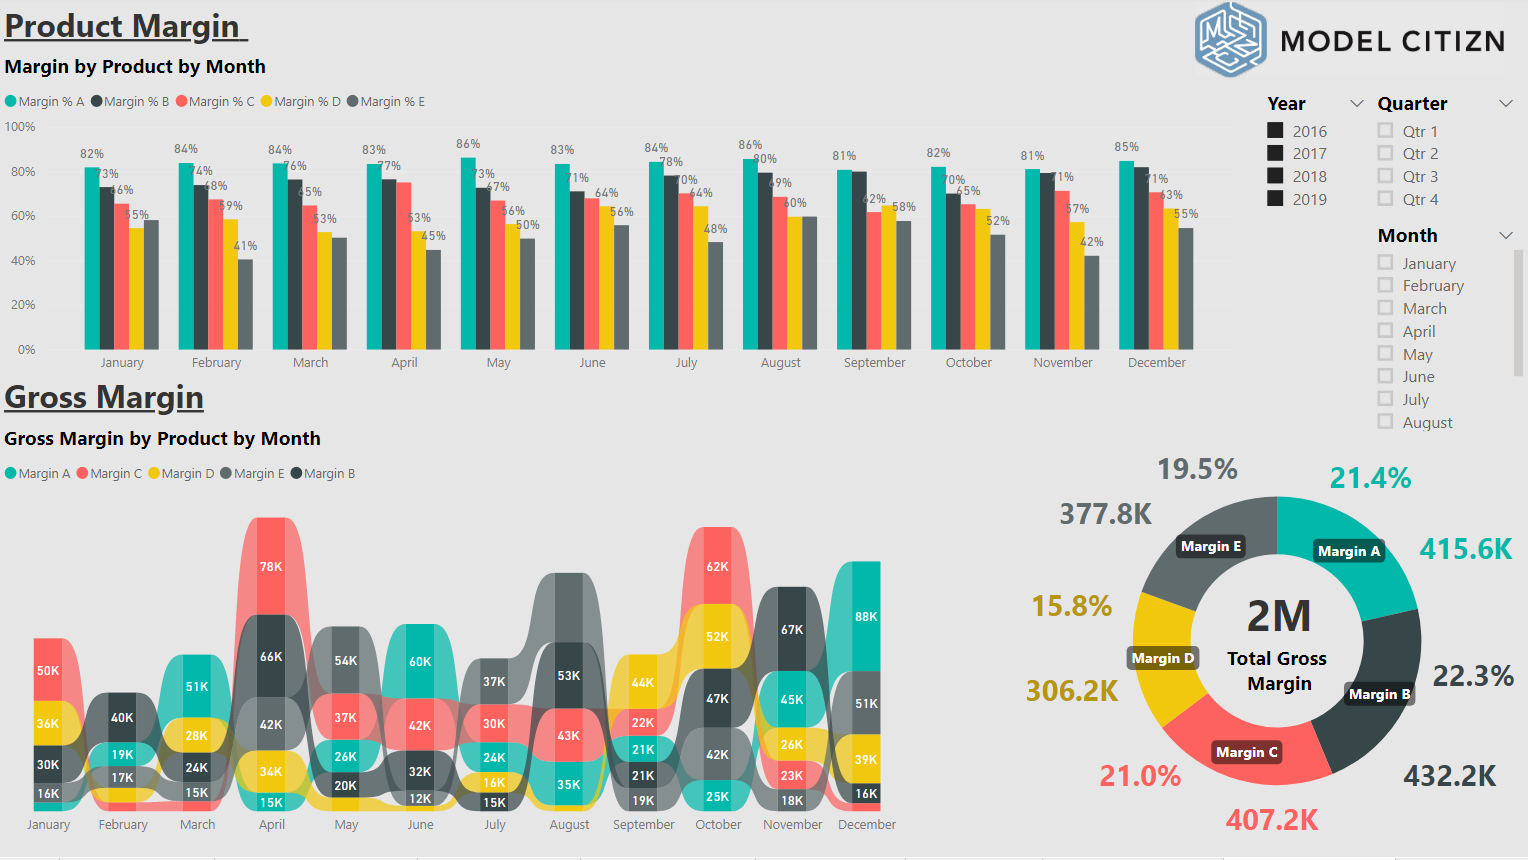
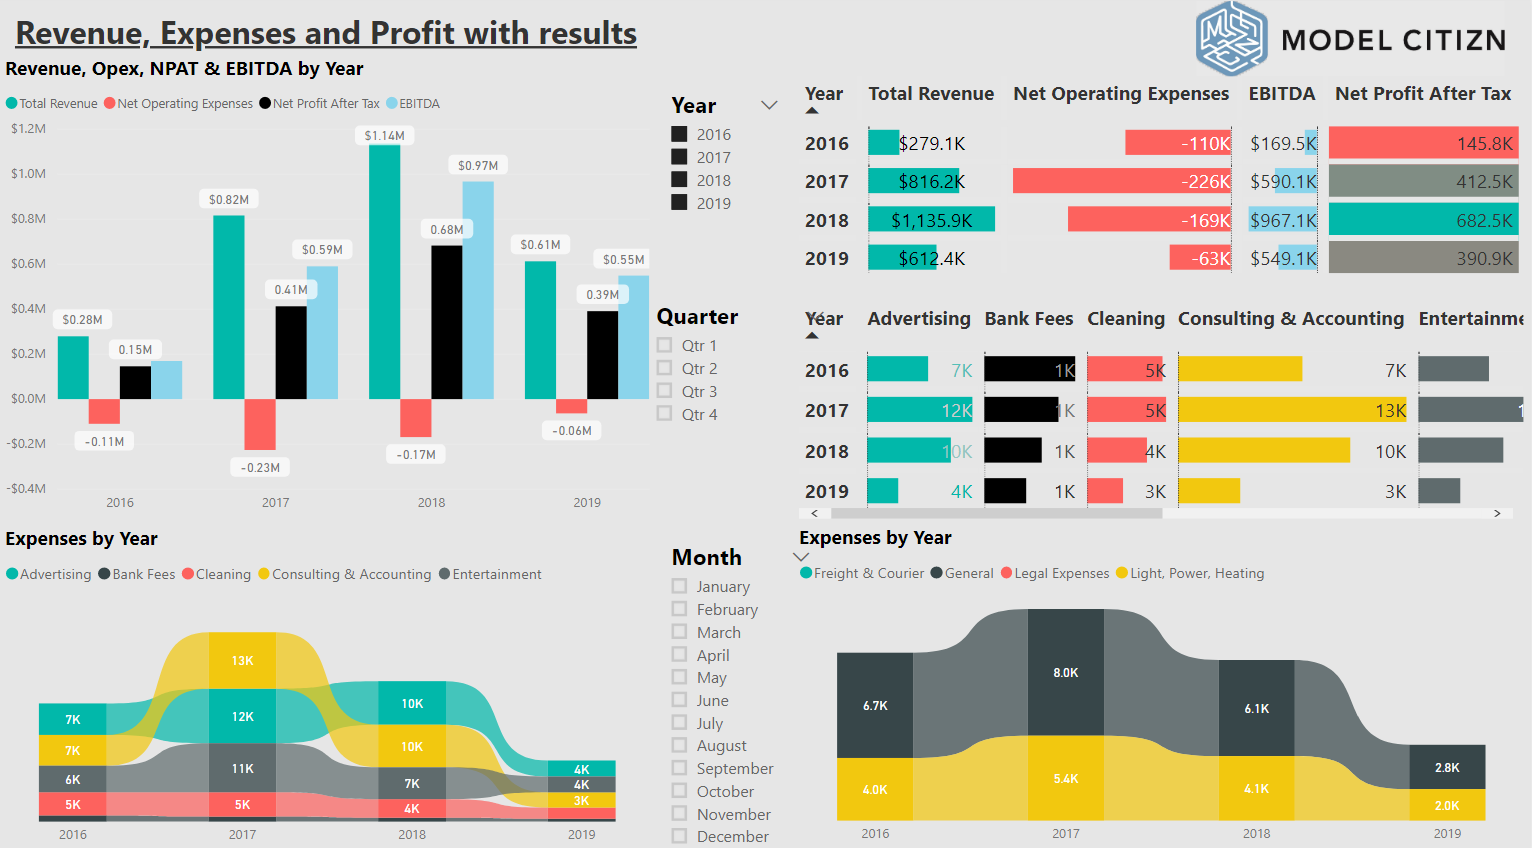
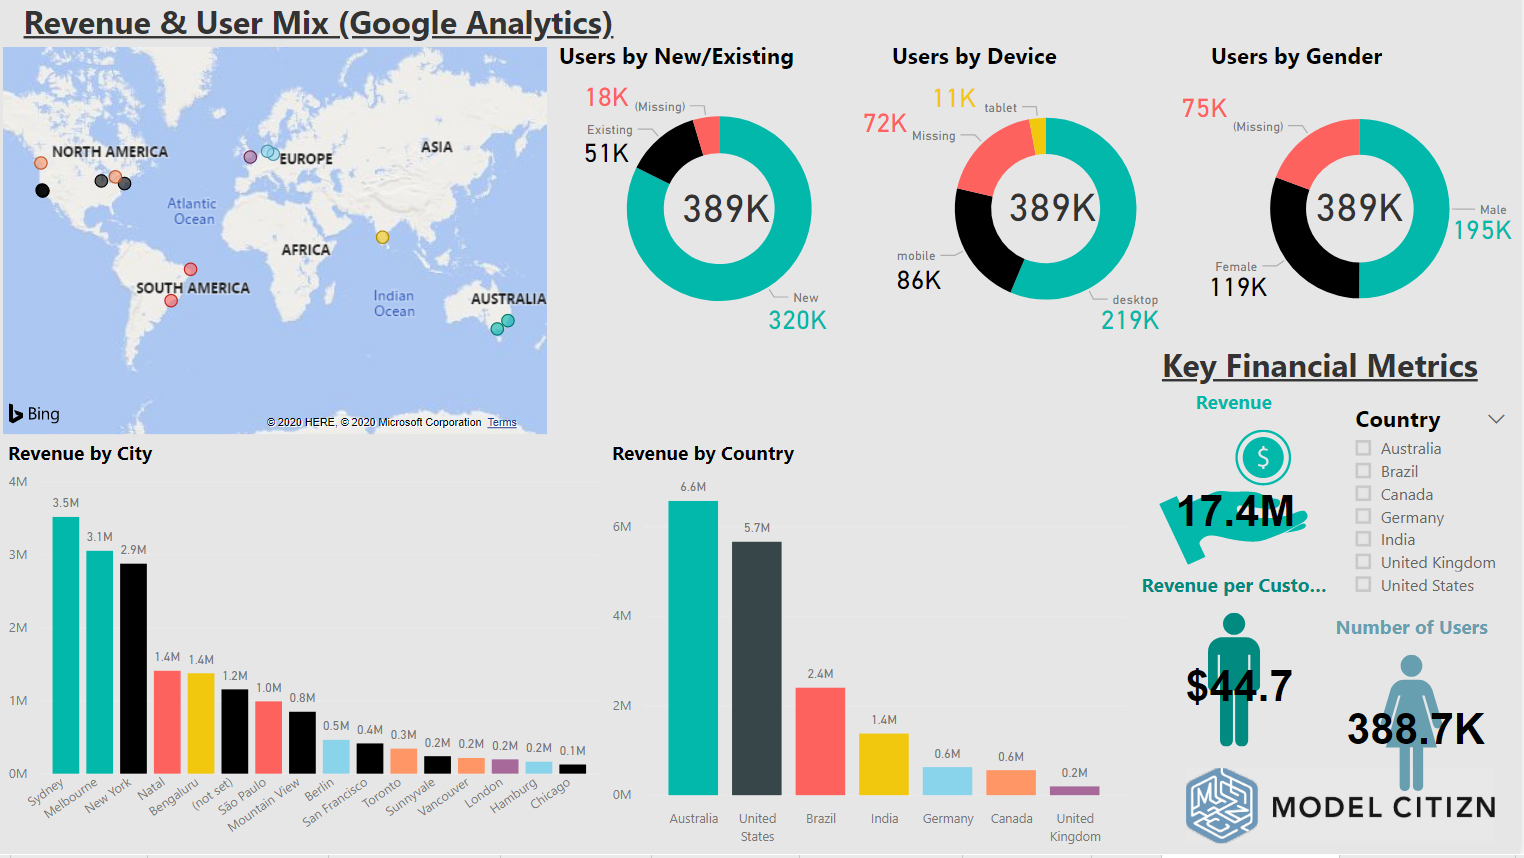
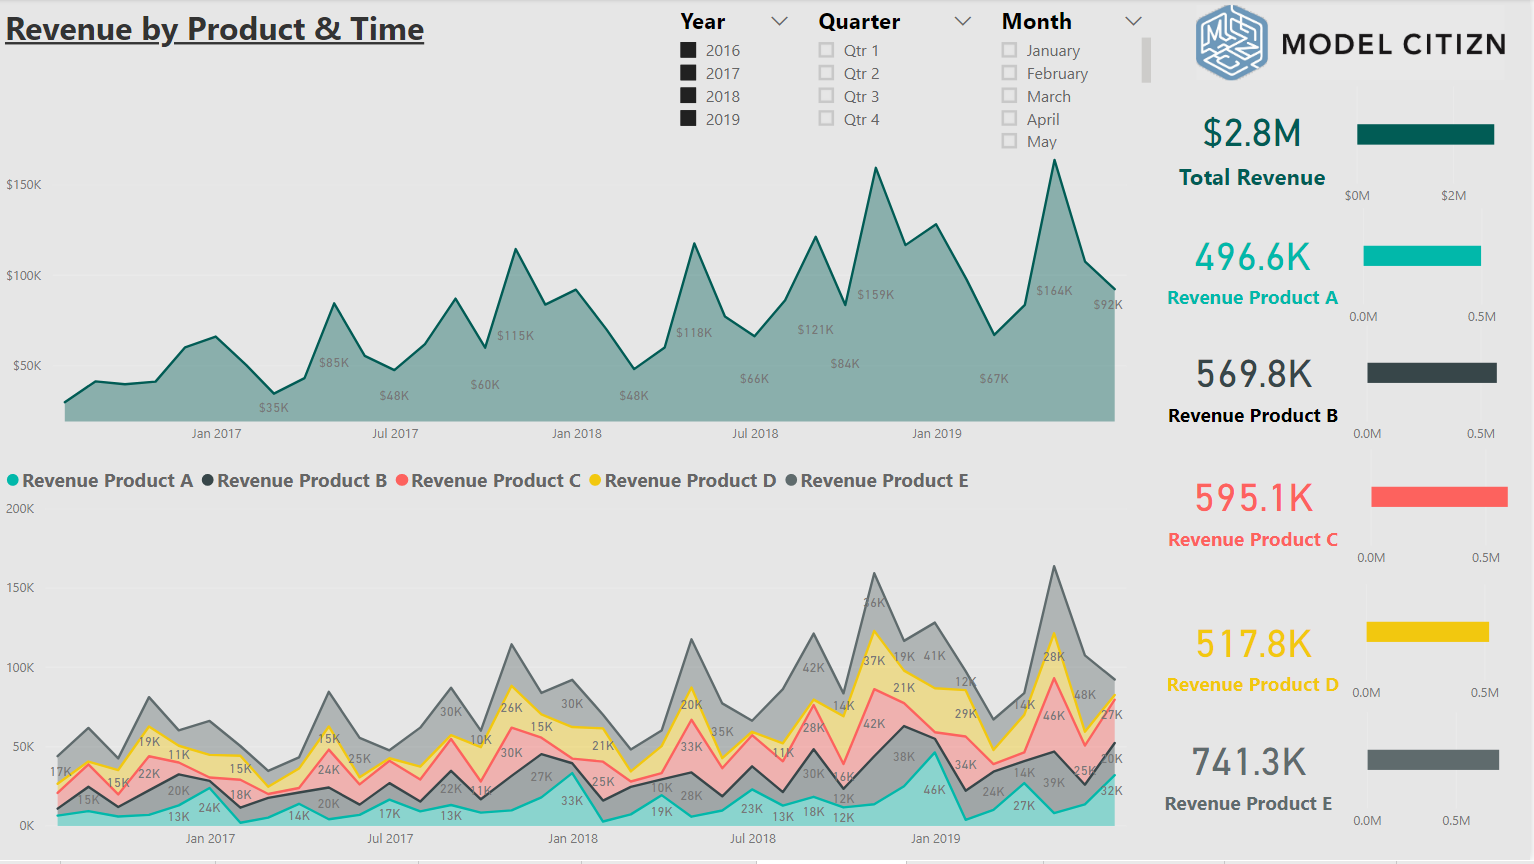
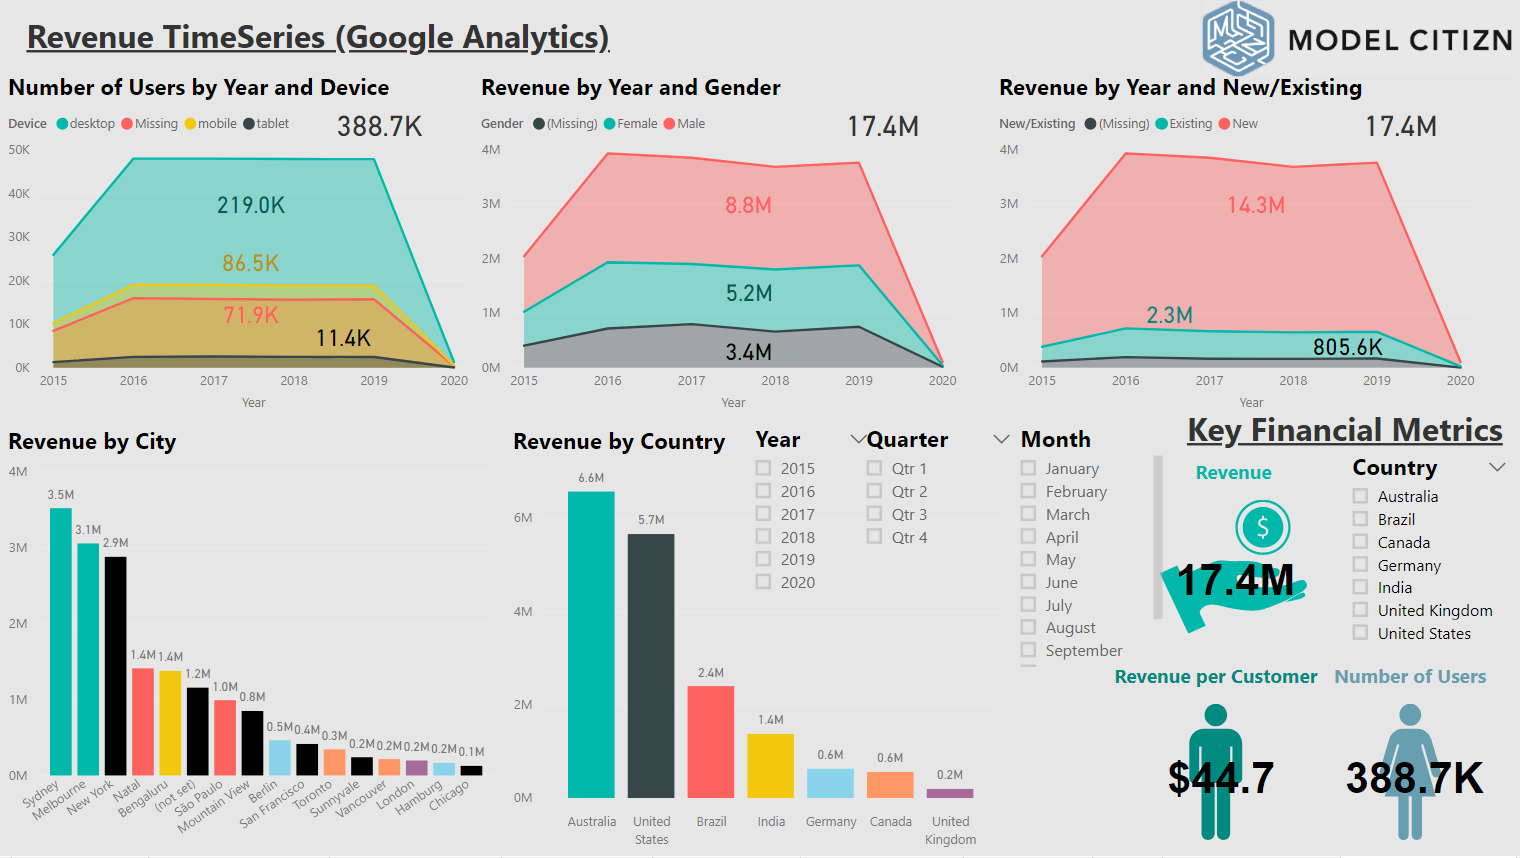
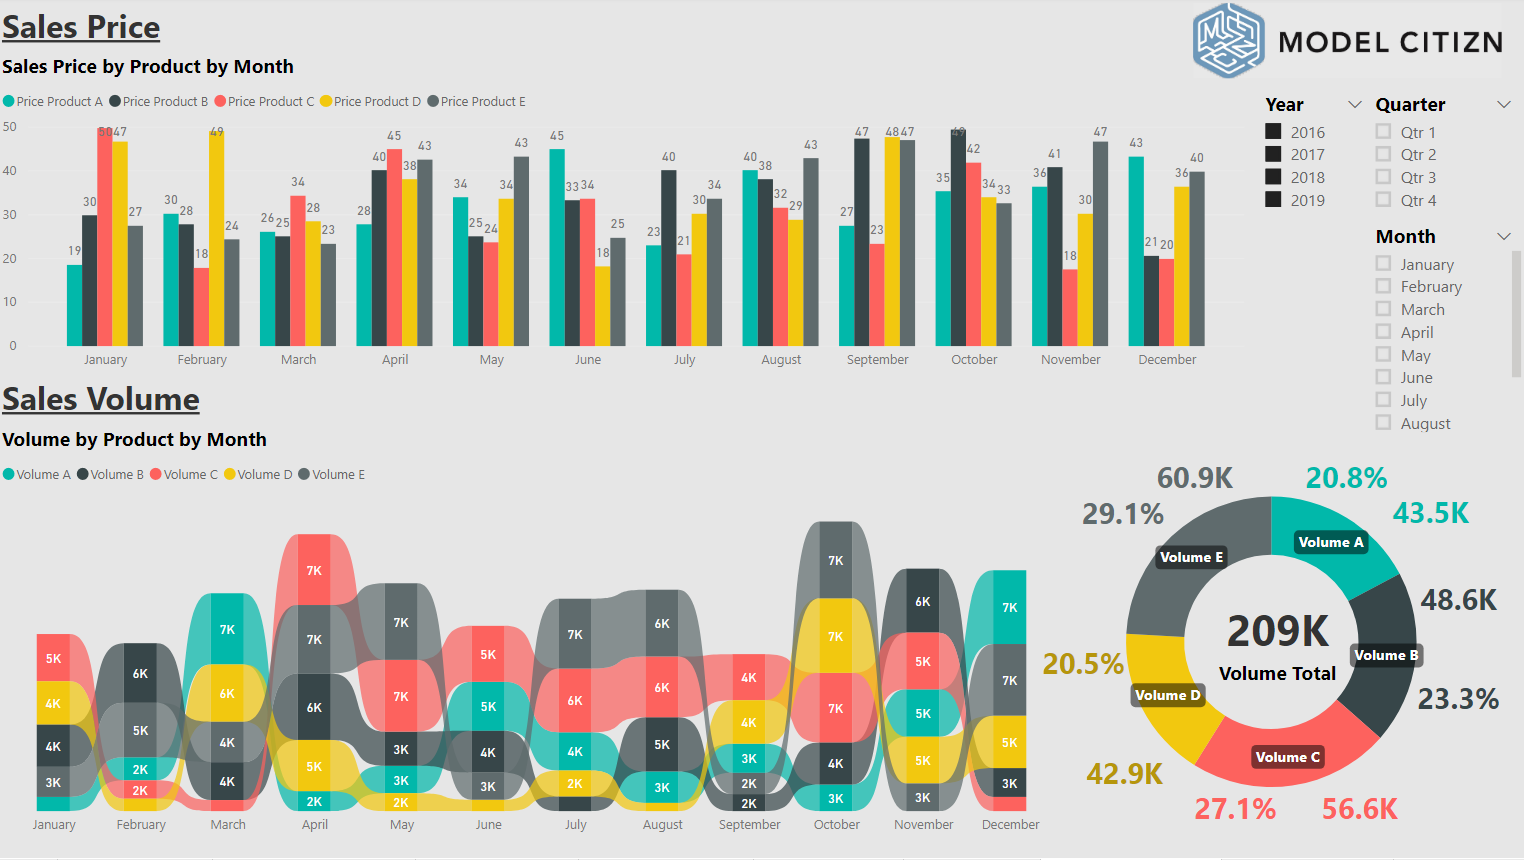
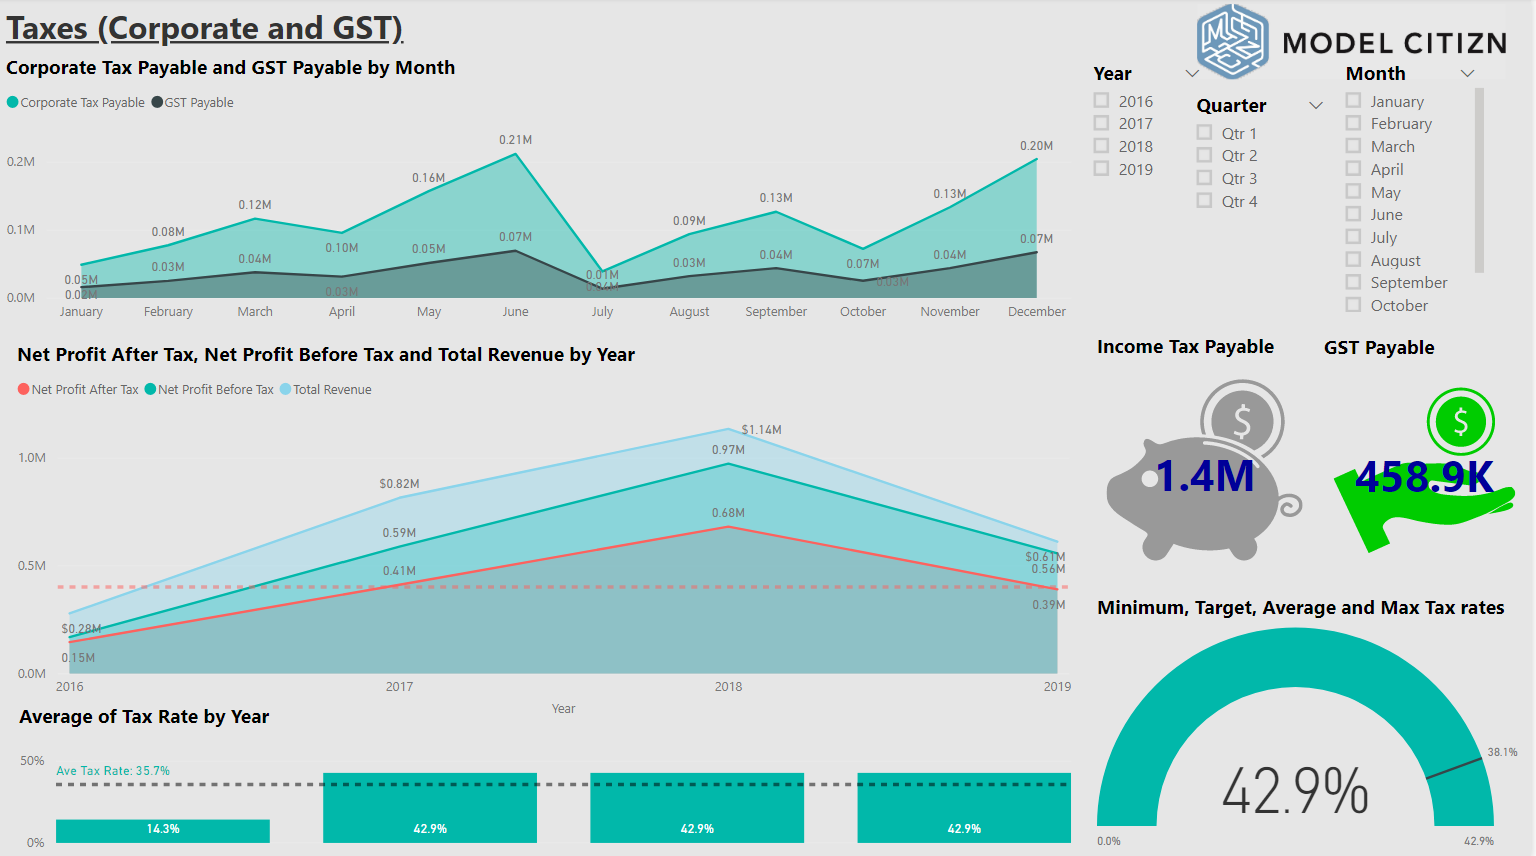
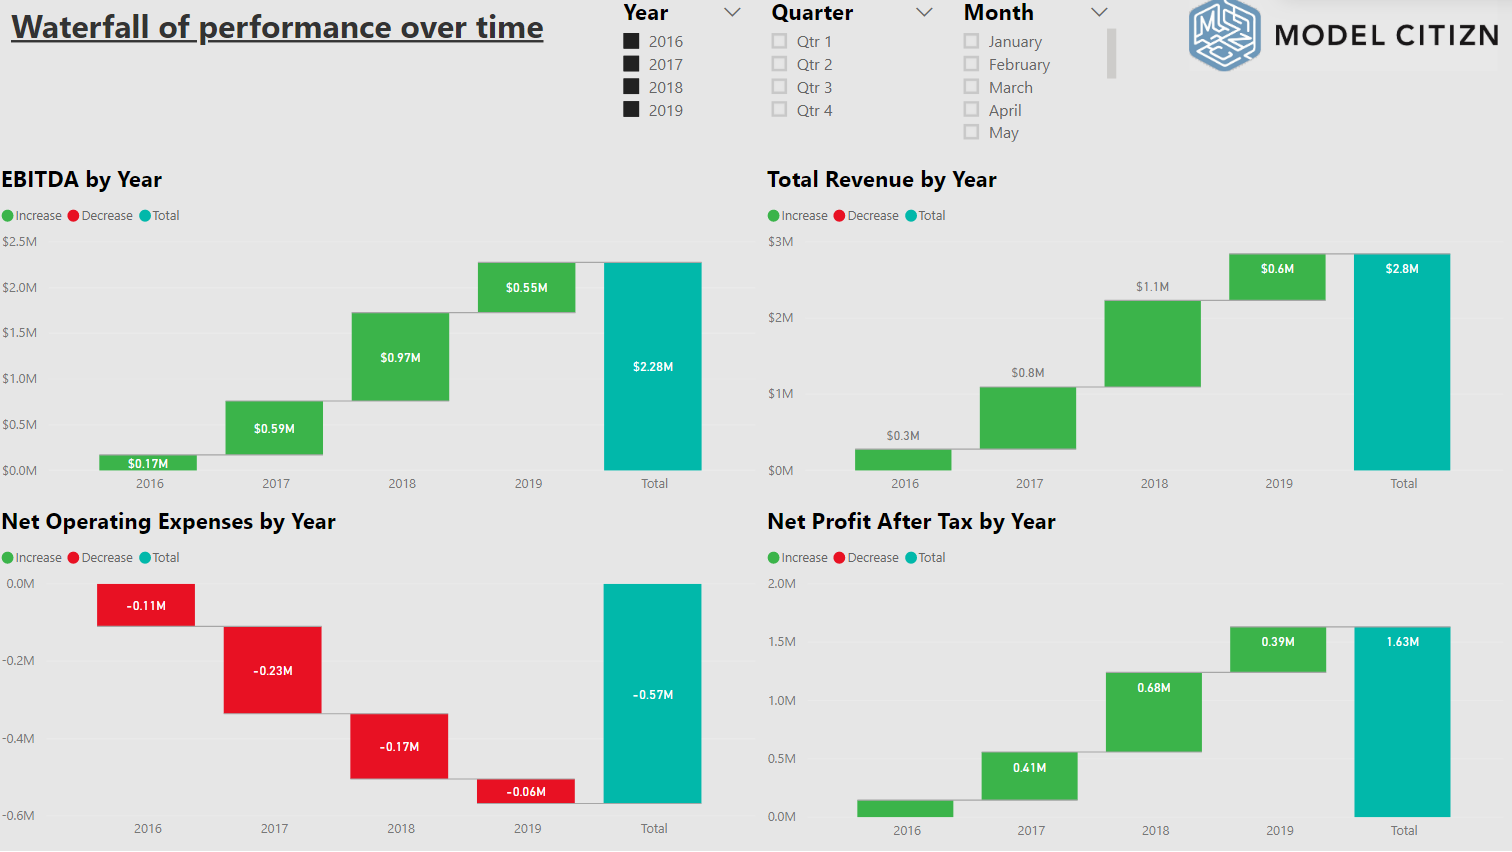
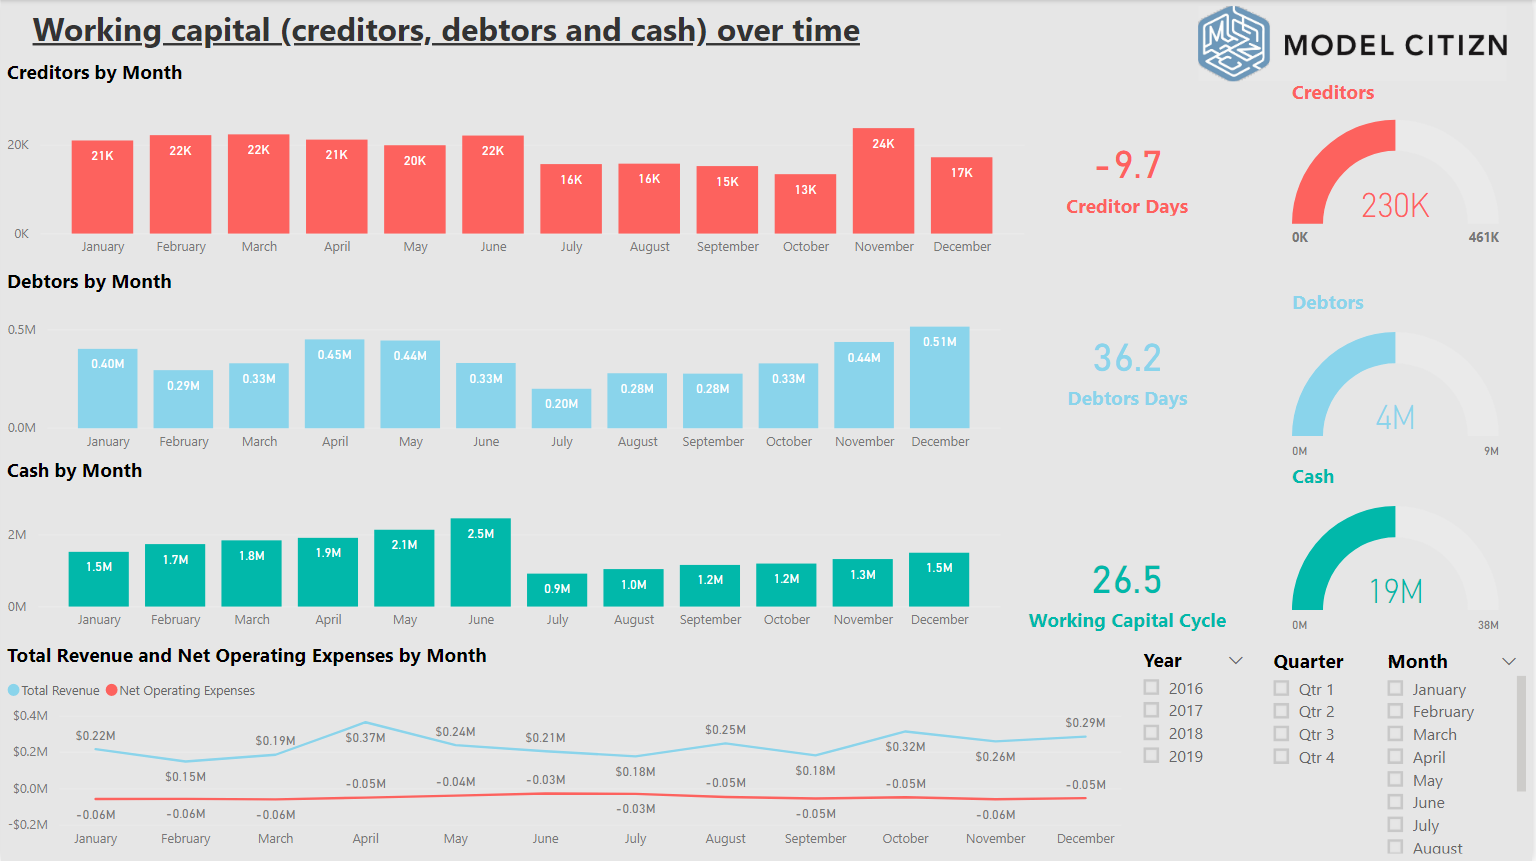
3-way Financial Model with PowerBI visualisation including Google Analytics
Excel with structured table export from 3-way model to PowerBI already transformed. Google Analytics Data included too.
CEO & Founder of Model Citizn, Chief Excel Officer of EXL Cloud, Chief Data Modeller of Potenza and professional financial modeler and trainer for FMIFollow 300
Further information
For education and internal uses within a business or finance function.
For connecting existing data into a pre-built PowerBI dashboard which allows the creating of automated management reporting across both financial and non-finance (digital marketing) contexts.
For resale purposes.
