Vertical Farming & CEA Financial Model | 10-Year Operations, Unit Economics & Valuation
Originally published: 31/08/2026 08:18
Publication number: ELQ-38513-1
View all versions & Certificate
certified

Vertical Farming & CEA Financial Model | 10-Year Operations, Unit Economics & Valuation

Evaluate crop mix, capacity, energy, water, labor, unit economics, scenarios, and 10-year vertical-farm value in one linked Excel model.

Description
🌿 VERTICAL FARMING & CONTROLLED-ENVIRONMENT AGRICULTURE FINANCIAL MODEL

Vertical farming economics are fundamentally different from conventional farming, greenhouse operations, and real-estate projects. The true productive area is not simply the building footprint: it is the usable canopy created by stacking multiple grow tiers. Output depends on crop-specific yield, harvest frequency, shrink, grow-system efficiency, and the speed at which the facility reaches capacity. At the same time, LED lighting, HVAC, labor, automation, and high build-out costs can determine whether a technically attractive concept creates financial value.

This premium Excel model brings those drivers together in one integrated, decision-ready framework. It converts facility design, crop mix, operating assumptions, commercial pricing, energy, water, automation, capital expenditure, and carbon assumptions into a 10-year production forecast, cost build, unit economics, profit and loss statement, cash flow, NPV, enterprise value, project IRR, dashboards, scenarios, and sensitivity views.

The workbook is designed for founders, CEA operators, agritech companies, investors, lenders, consultants, developers, and analysts assessing a new facility, expansion plan, operating strategy, or investment opportunity.

⚙️ CENTRALIZED CONTROL PANEL
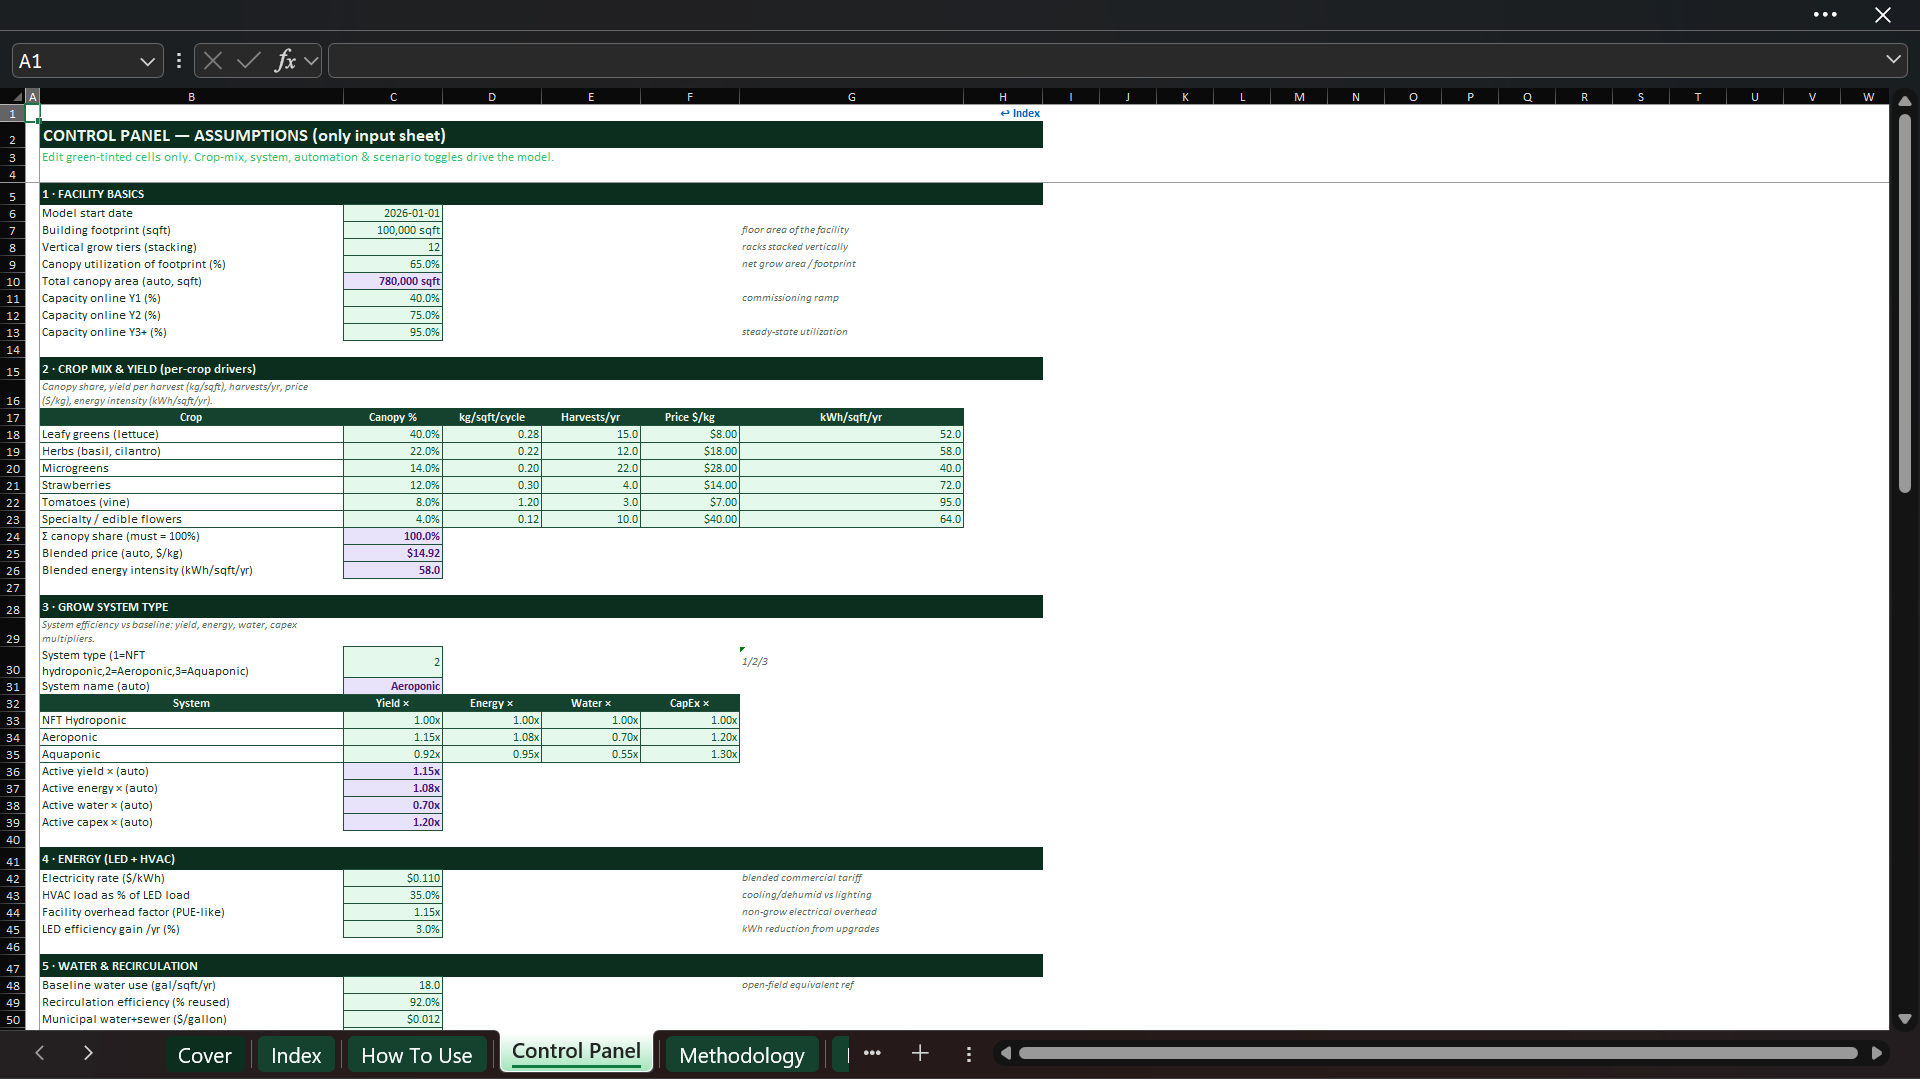
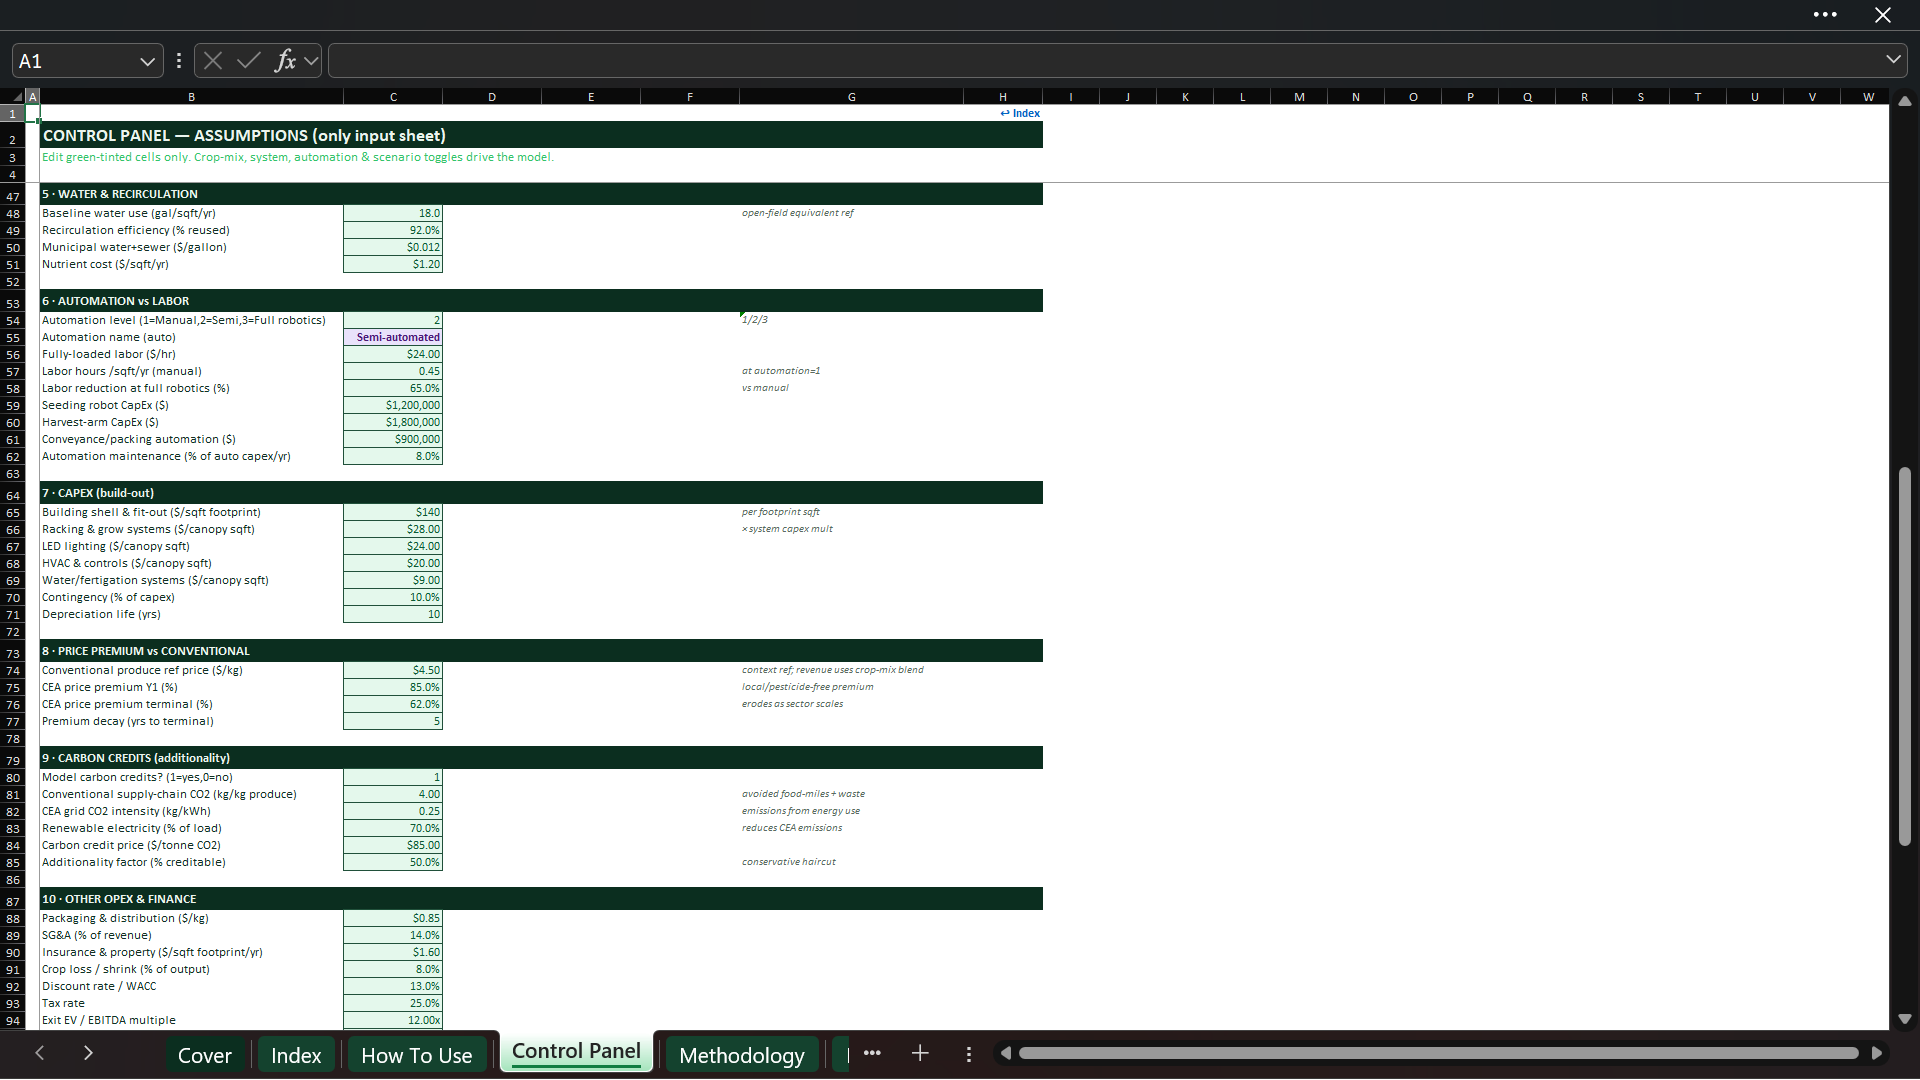
All editable assumptions are concentrated on one clearly organized Control Panel. Green-tinted input cells help users distinguish assumptions from formulas, while linked calculation sheets update automatically. The Control Panel is divided into practical operating and financial sections:
• Facility basics: model start date, building footprint, number of grow tiers, canopy utilization, and Year 1 to Year 3 capacity ramp.
• Crop mix and yield: canopy allocation, kilograms per square foot per cycle, harvests per year, price per kilogram, and crop-specific energy intensity.
• Grow system: selectable NFT hydroponic, aeroponic, or aquaponic setup with editable yield, energy, water, and CapEx multipliers.
• Energy: electricity tariff, HVAC load relative to LEDs, facility-overhead factor, and annual LED-efficiency improvement.
• Water and nutrients: baseline water use, recirculation efficiency, water and sewer rate, and nutrient cost.
• Automation and labor: automation level, loaded hourly wage, manual labor intensity, robotics-driven labor reduction, automation CapEx, and maintenance.
• Capital expenditure: building fit-out, grow systems, lighting, HVAC, fertigation, contingency, and depreciation life.
• Commercial assumptions: reference produce pricing, initial CEA price premium, terminal premium, and premium-decay period.
• Carbon assumptions: optional carbon-credit switch, avoided supply-chain emissions, grid emissions, renewable-electricity share, carbon price, and additionality haircut.
• Other operating and finance inputs: packaging and distribution, SG&A, insurance, crop loss, WACC, tax rate, exit multiple, and scenario selection.

🥬 MULTI-CROP PRODUCTION ENGINE
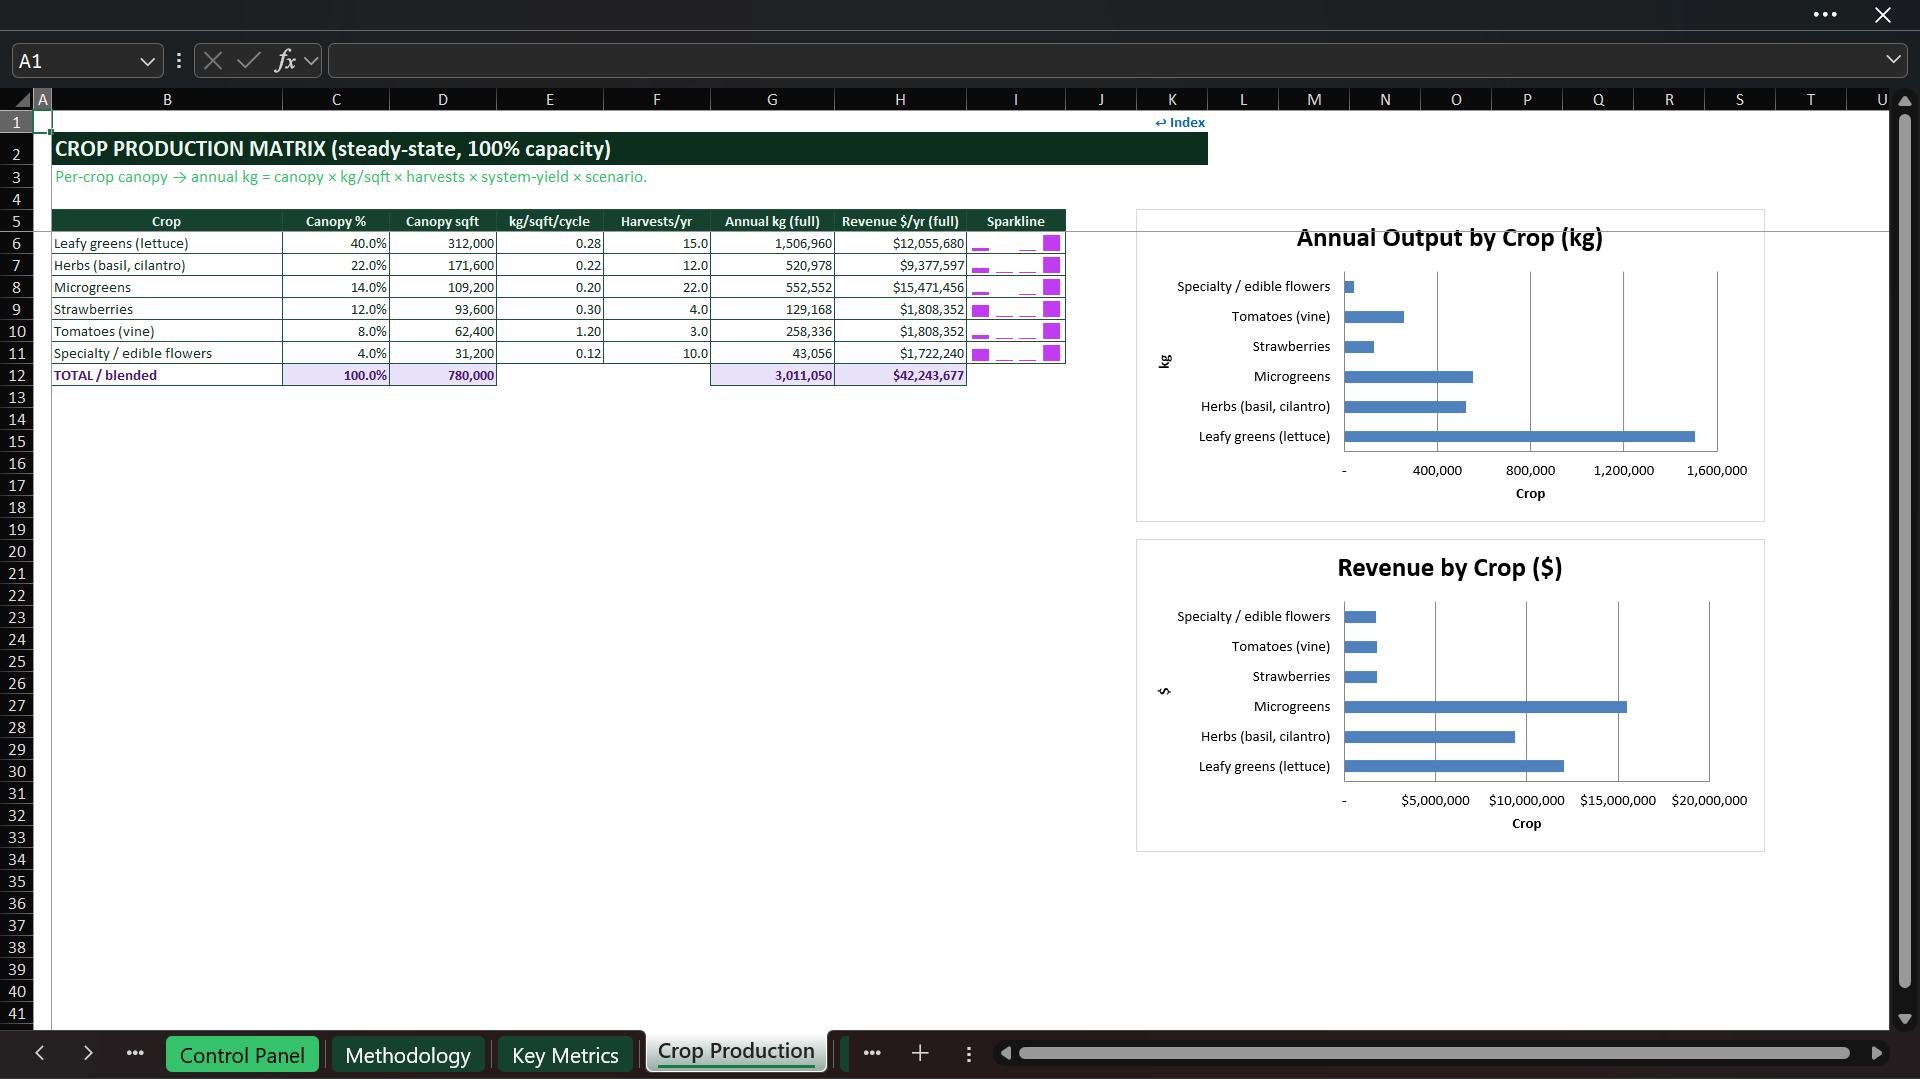
The model includes six editable crop categories: leafy greens, herbs, microgreens, strawberries, vine tomatoes, and specialty or edible flowers. Each crop carries its own canopy share, yield per square foot per harvest, harvest frequency, selling price, and energy intensity.
The engine calculates total productive canopy as building footprint × vertical tiers × canopy utilization. It then allocates that canopy across crops and calculates annual output by crop using the relevant yield, harvest cycles, selected grow-system multiplier, and active scenario. A separate production matrix shows canopy allocation, full-capacity kilograms, and potential revenue by crop, making it easier to see which products drive the business case.
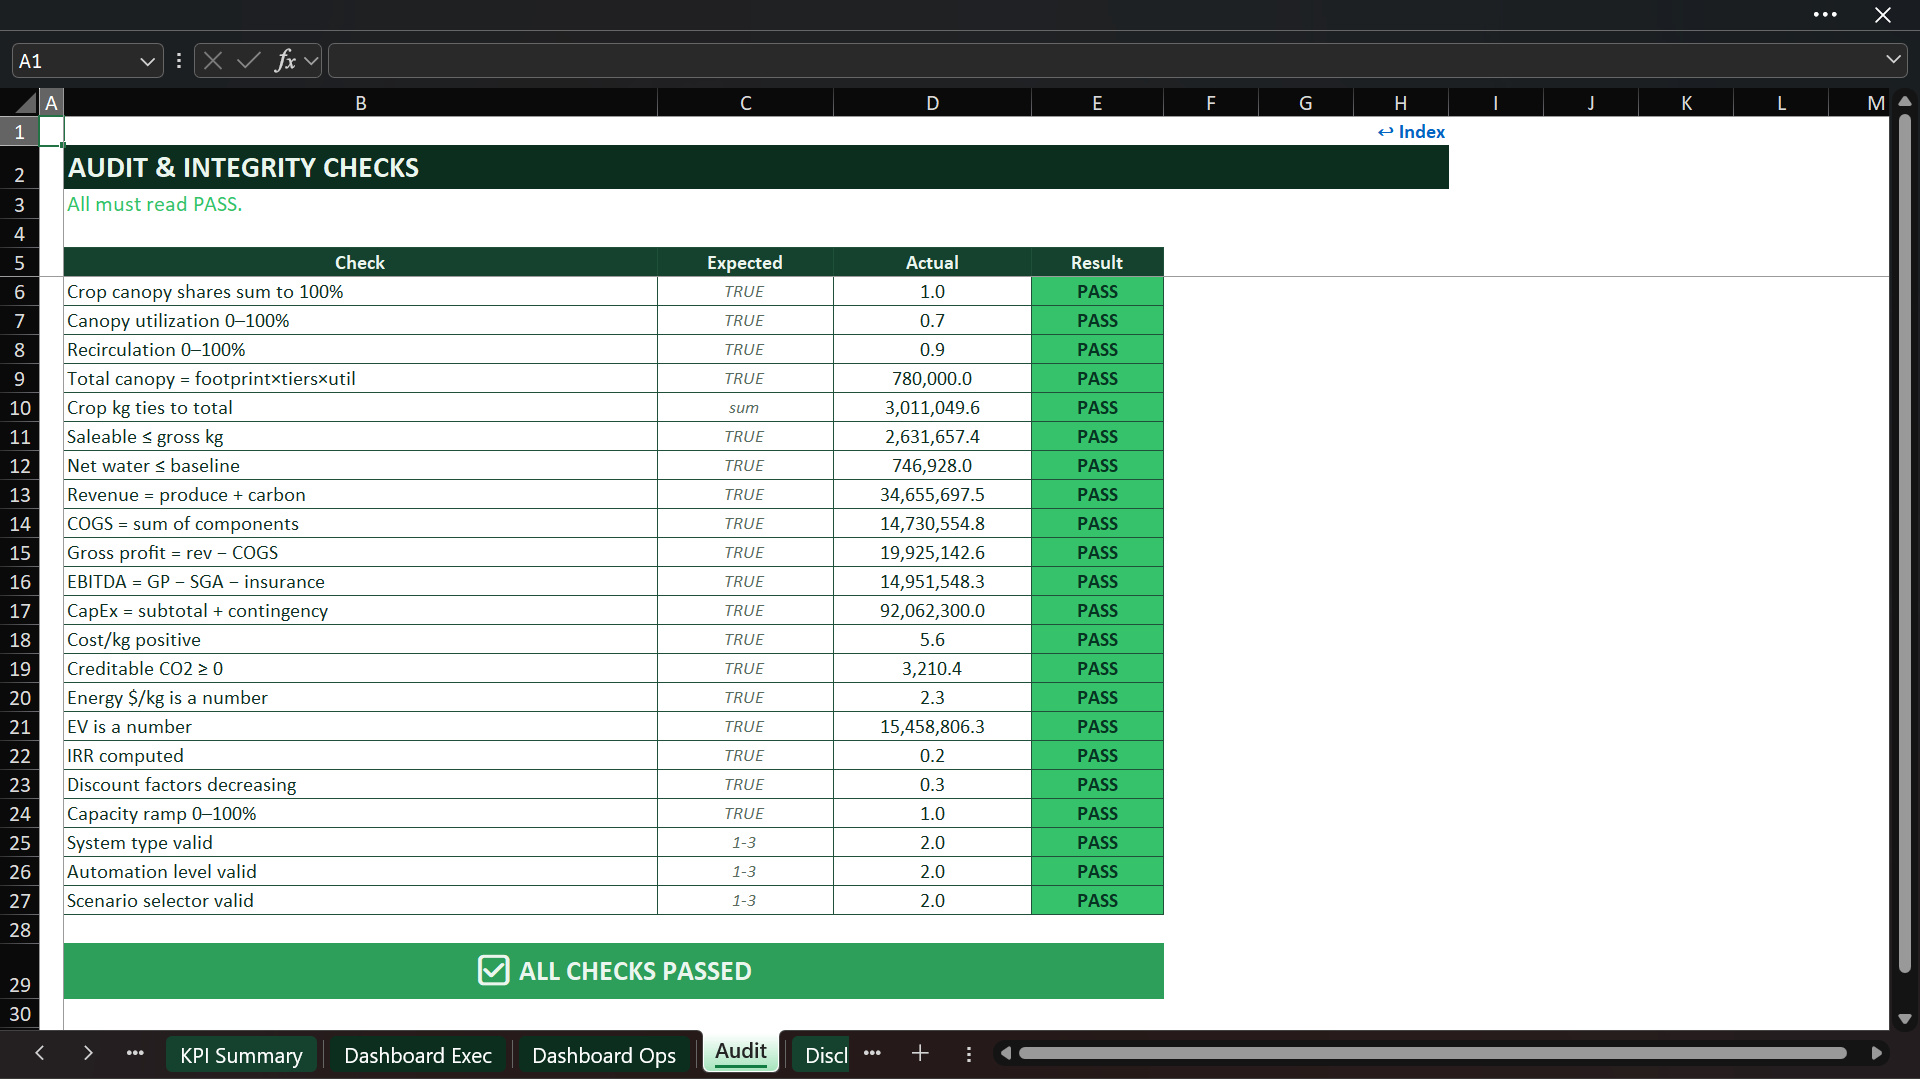
Canopy shares are controlled so the total can be checked against 100%, and the model’s audit sheet confirms whether the crop mix reconciles.
📈 CAPACITY RAMP, YIELD & SALEABLE OUTPUT
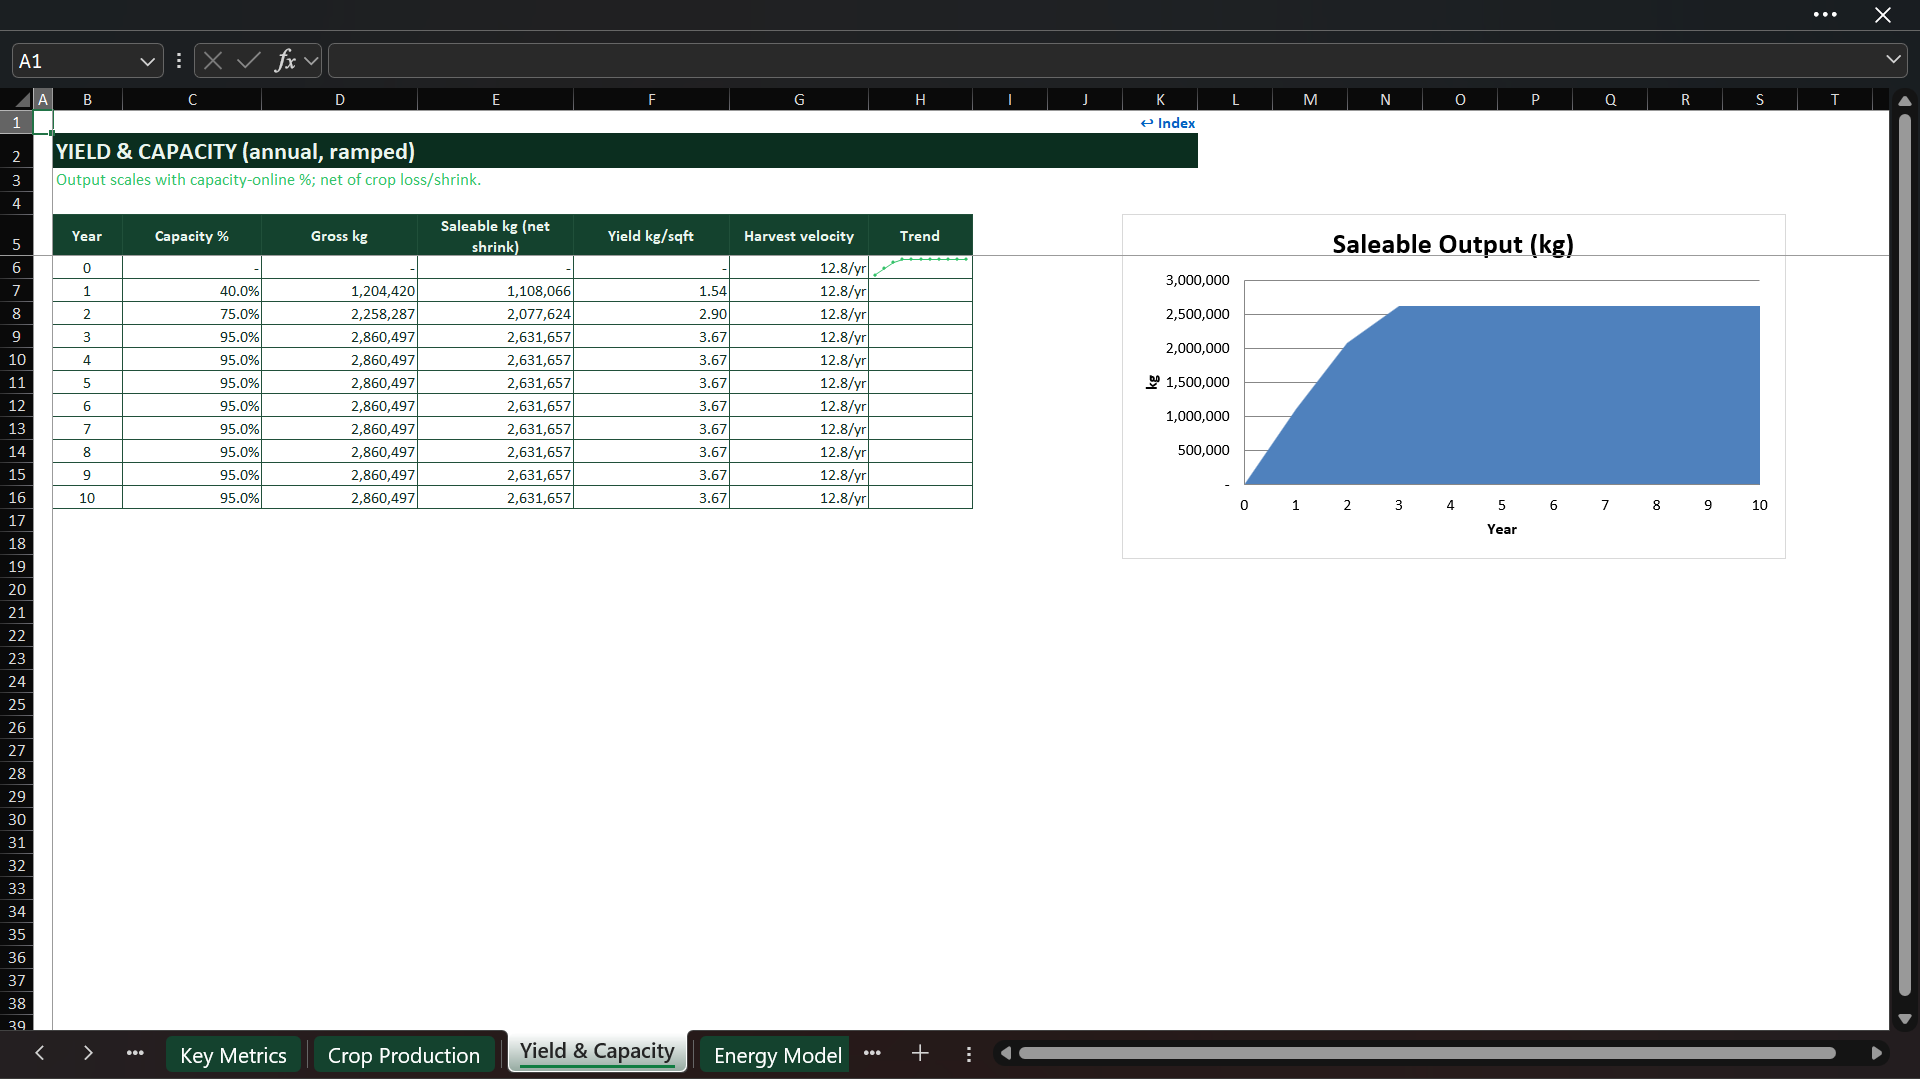
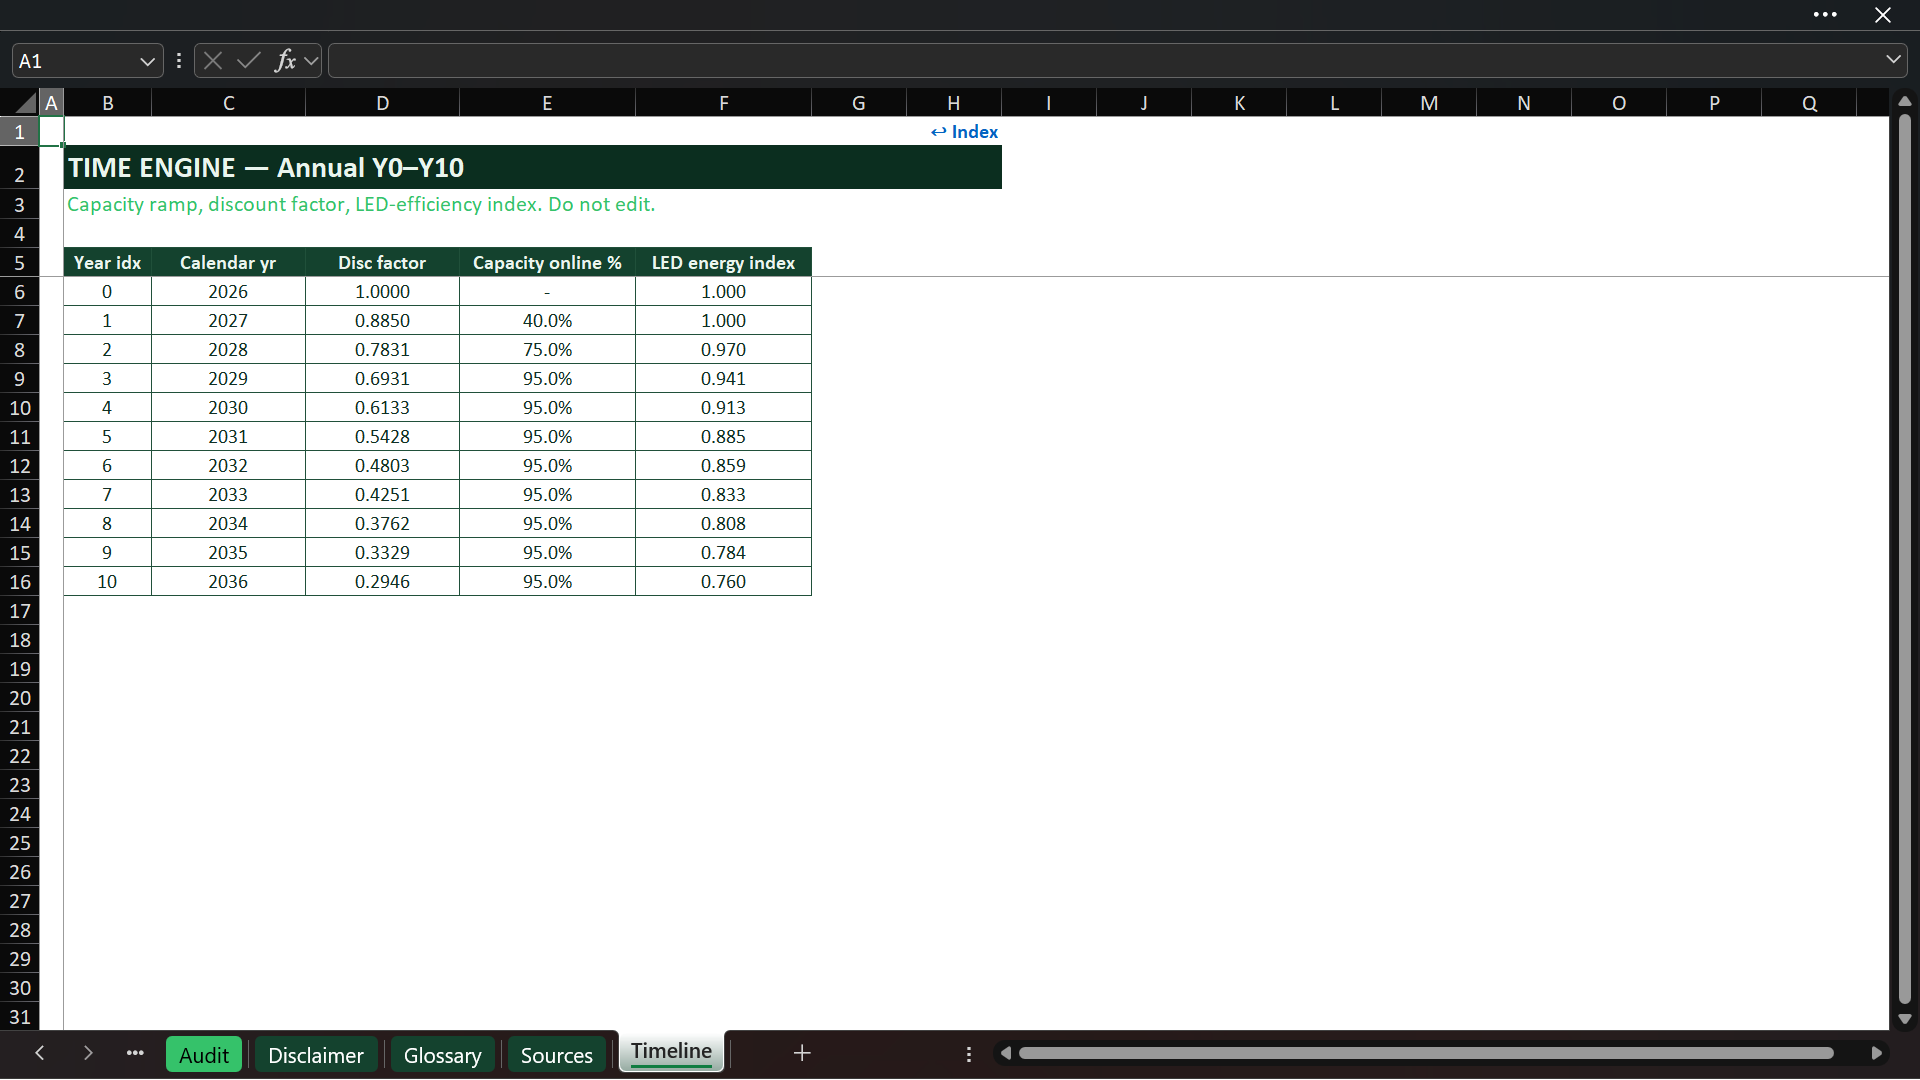
Vertical farms rarely reach designed capacity immediately. The 10-year forecast therefore applies an editable commissioning ramp before the facility reaches mature utilization. Gross output is calculated annually and reduced for crop loss and shrink to produce saleable kilograms.
The yield schedule reports capacity online, gross production, saleable production, yield per square foot, and harvest velocity. This creates a transparent bridge between the physical farm design and the volumes used in revenue, cost, and valuation calculations.

⚡ LED, HVAC & FACILITY ENERGY ECONOMICS
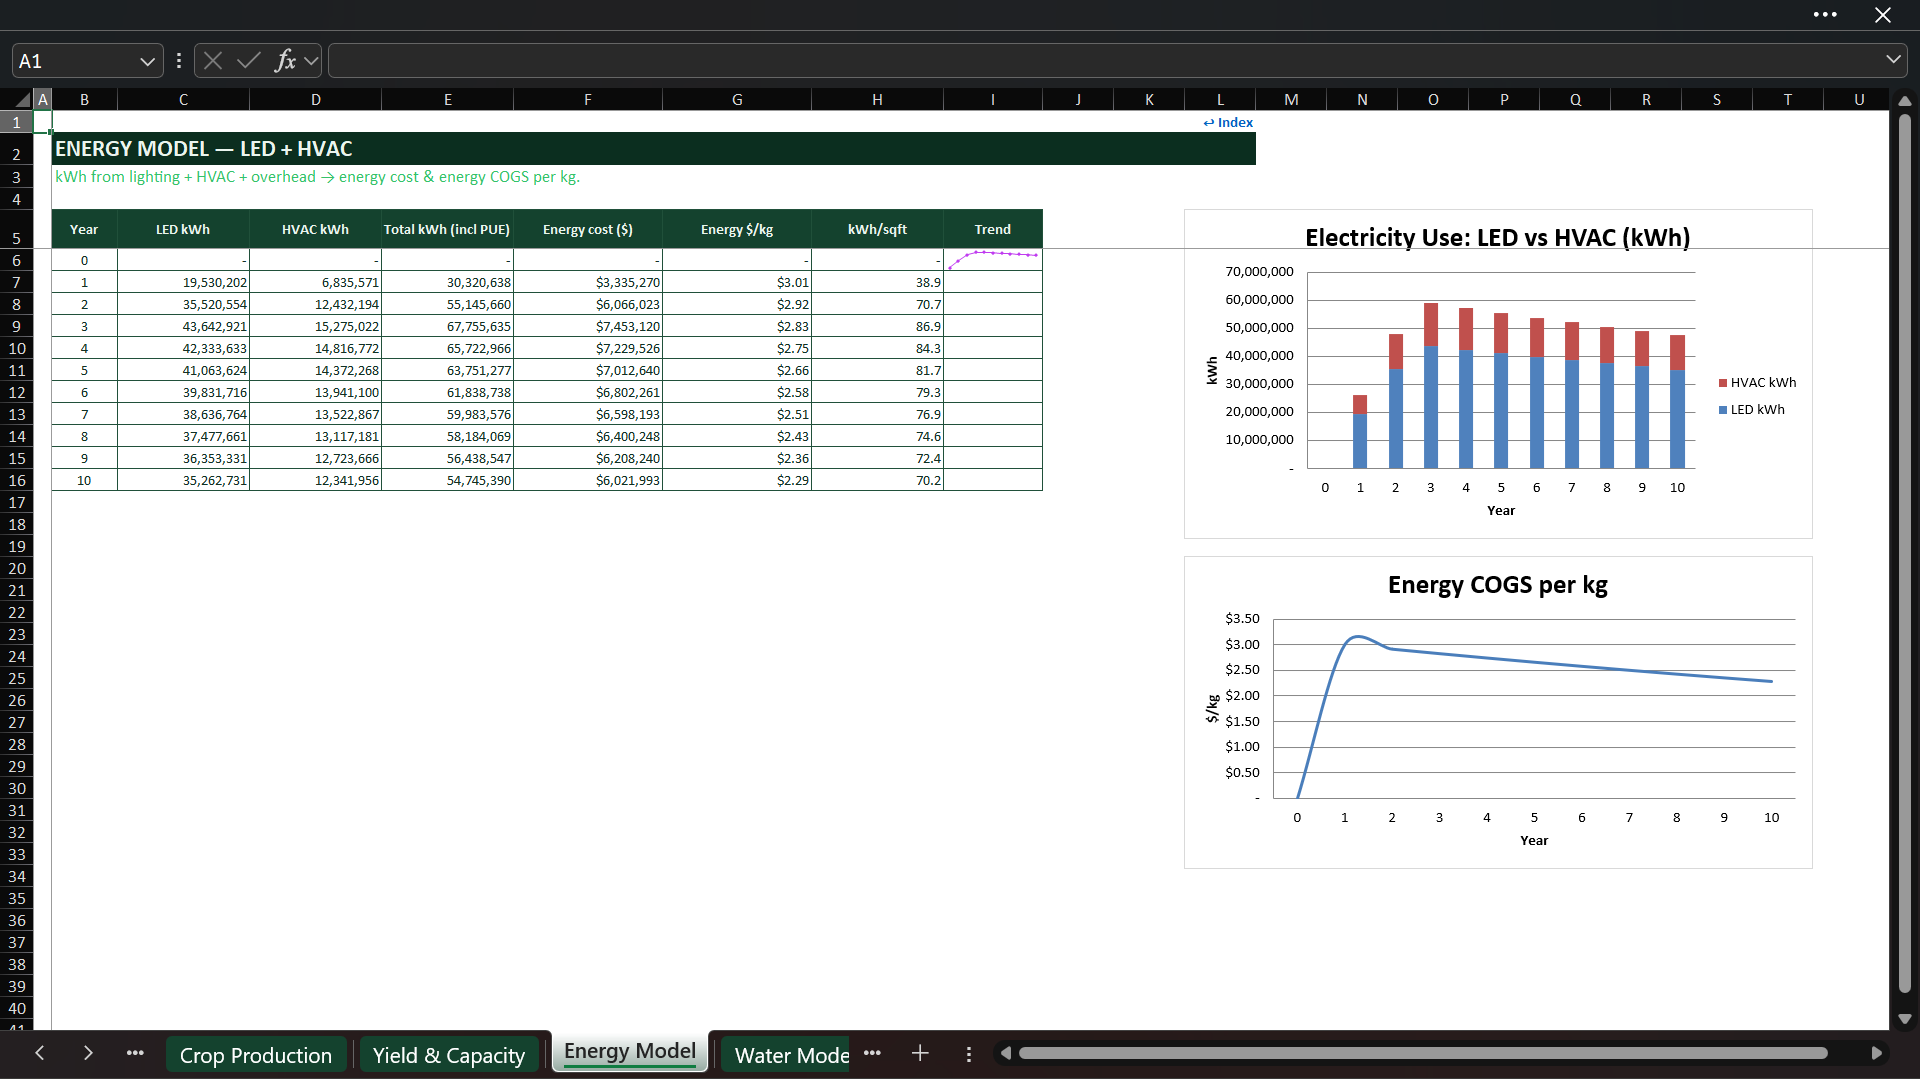
Energy is modeled as a core CEA operating driver rather than a generic percentage of sales. The workbook calculates LED electricity from productive canopy, blended crop-energy intensity, grow-system efficiency, capacity utilization, and an annual LED-efficiency index. HVAC load is added as a percentage of LED demand, while a PUE-like facility factor captures non-grow electrical overhead.
Outputs include LED kWh, HVAC kWh, total electricity consumption, total energy cost, kWh per square foot, and energy cost per saleable kilogram. This lets users quantify the impact of power tariffs, equipment efficiency, crop mix, capacity, and system selection on the farm’s cost position.

💧 WATER RECIRCULATION & MUNICIPAL SAVINGS
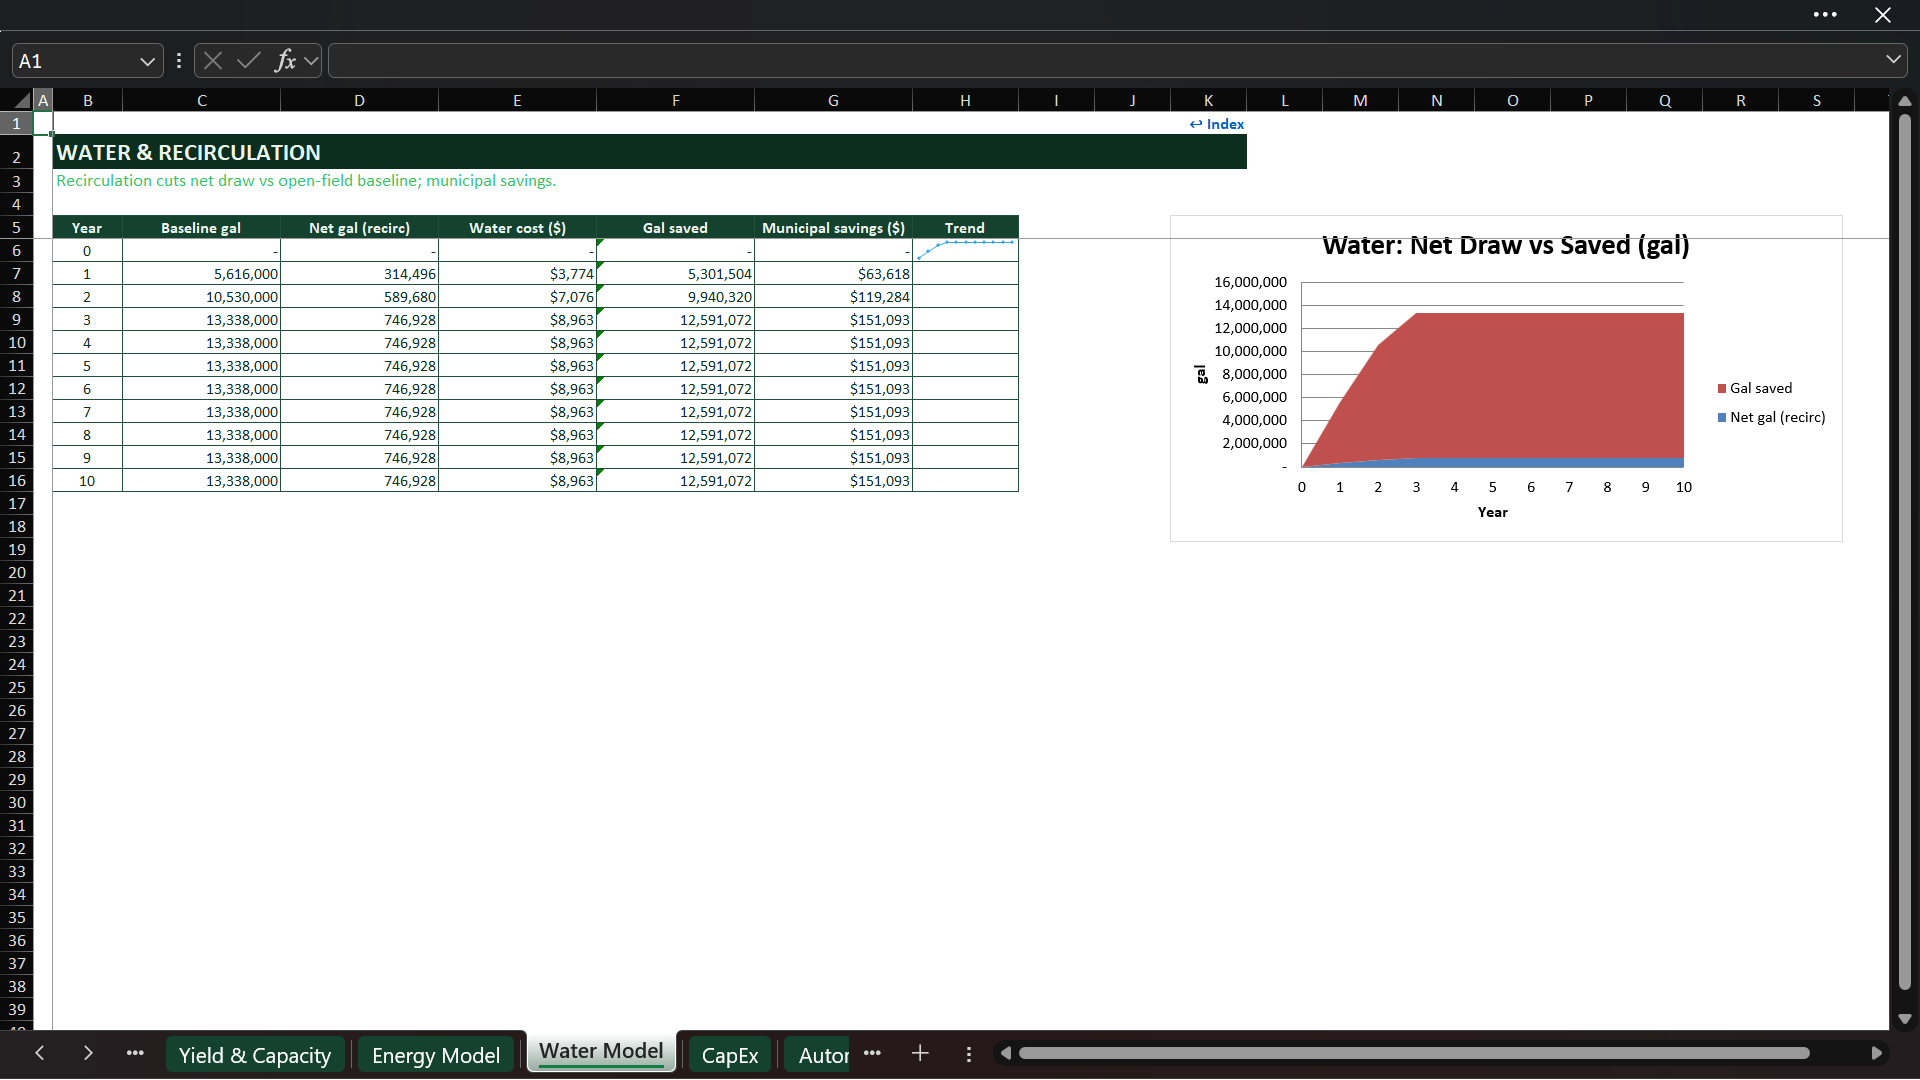
The water module calculates baseline demand, net draw after recirculation, water and sewer expense, gallons saved, and indicative municipal savings.
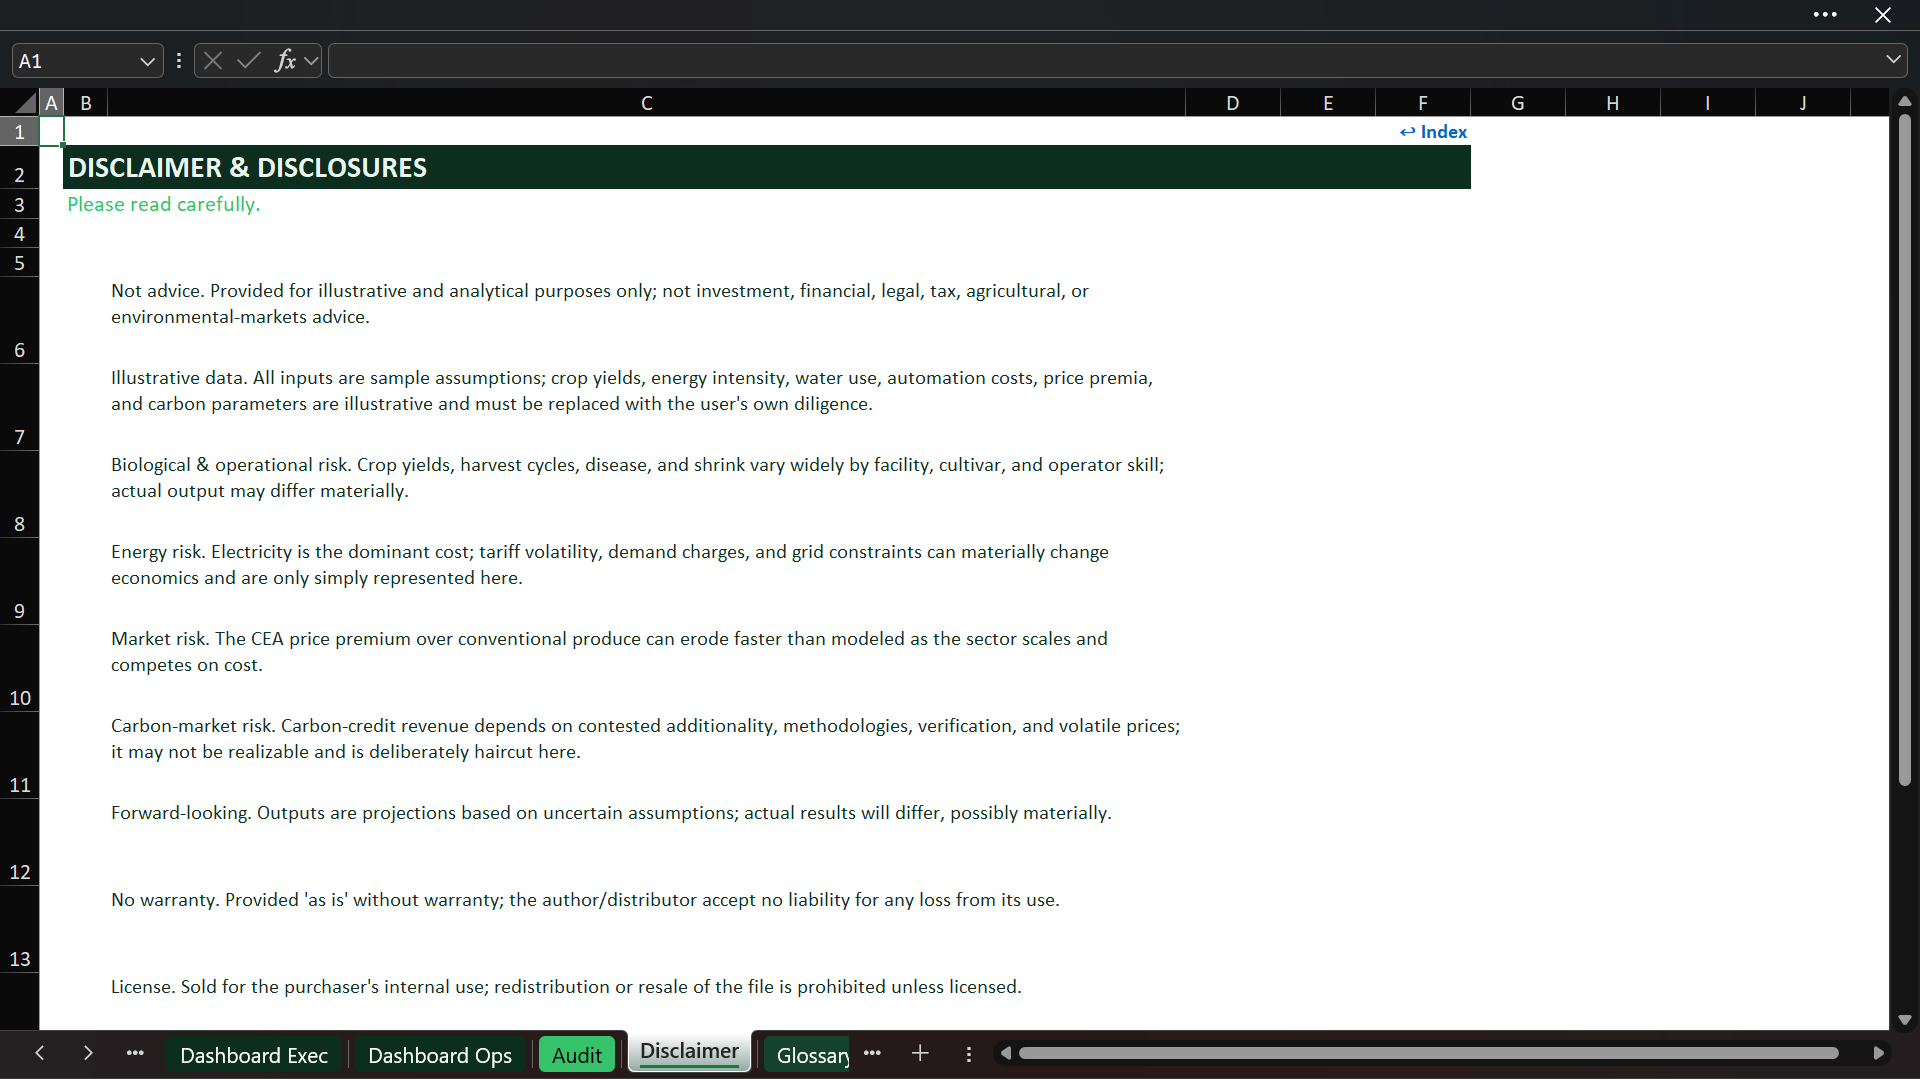
The workbook does not present these results as certified environmental claims. Users should replace baseline and recirculation inputs with site-specific engineering data and applicable local methodology.

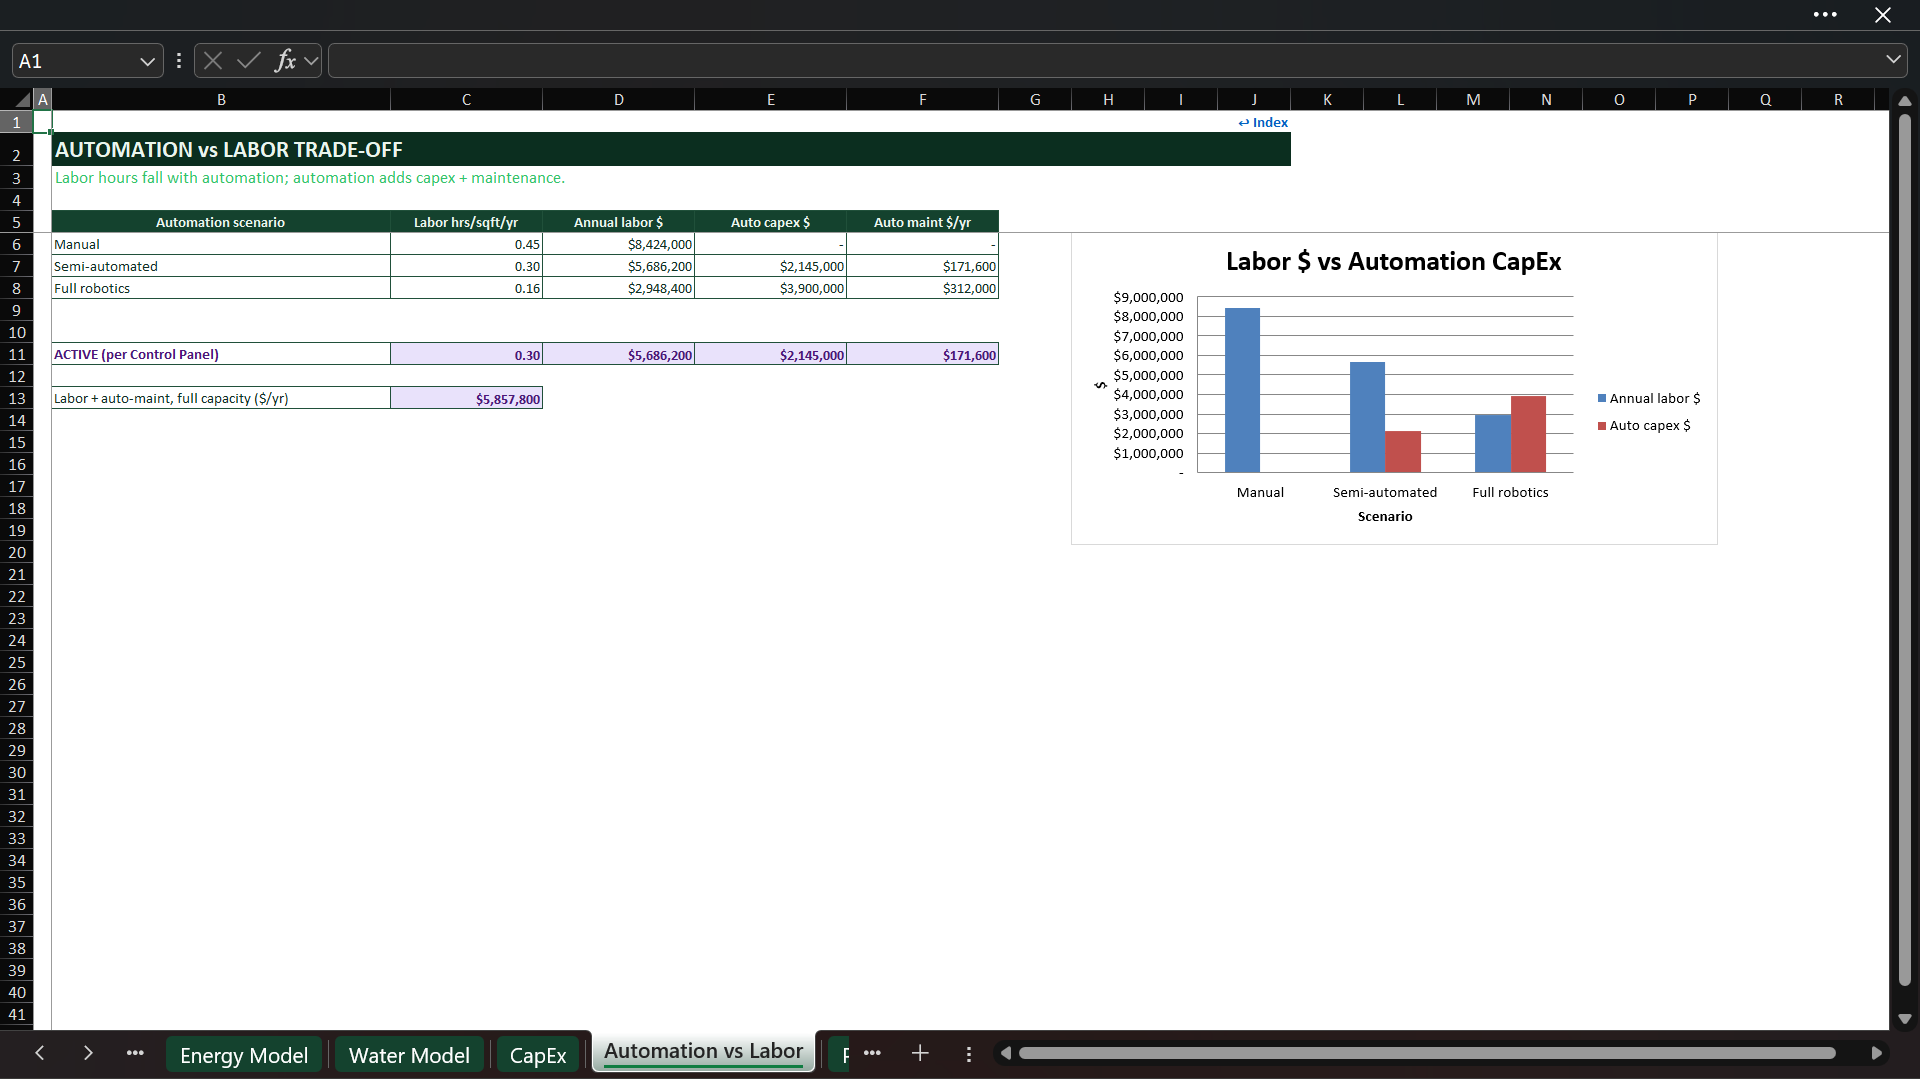
🤖 AUTOMATION VS. LABOR TRADE-OFF
Three operating configurations are modeled side by side: manual, semi-automated, and full robotics. Higher automation reduces labor hours per square foot but adds seeding, harvesting, conveyance, and packing-equipment investment together with annual maintenance.
The comparison schedule reports labor intensity, annual labor cost, automation CapEx, and automation maintenance for each level. The selected setting flows into the active cost structure and valuation, allowing users to assess whether labor savings justify the additional capital commitment.

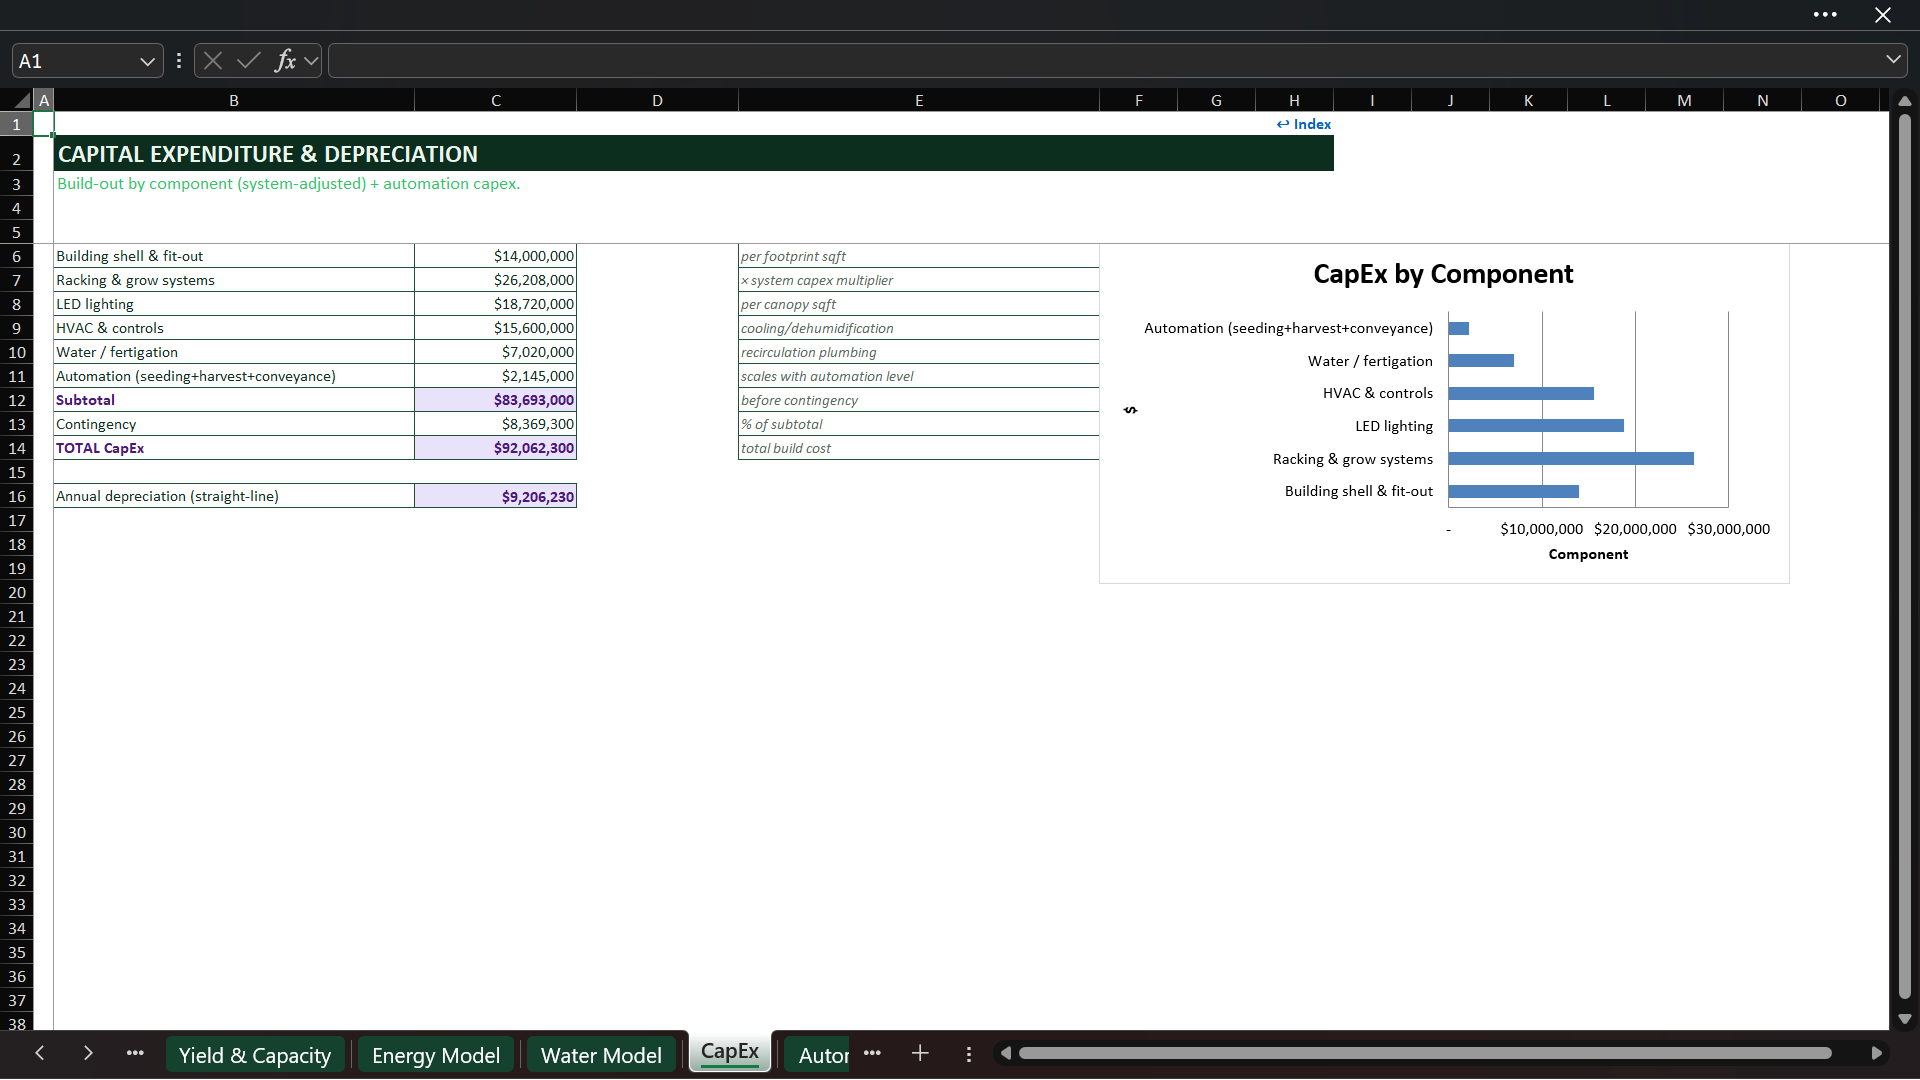
🏗️ CAPITAL EXPENDITURE & DEPRECIATION
The component-based CapEx build includes:
• Building shell and fit-out.
• Racking and grow systems.
• LED lighting.
• HVAC and environmental controls.
• Water and fertigation infrastructure.
• Seeding, harvesting, conveyance, and packing automation.
• Contingency and straight-line depreciation.
Costs scale from footprint, canopy area, grow system, automation, and editable unit rates. Valuation also includes annual sustaining capital after the initial build.

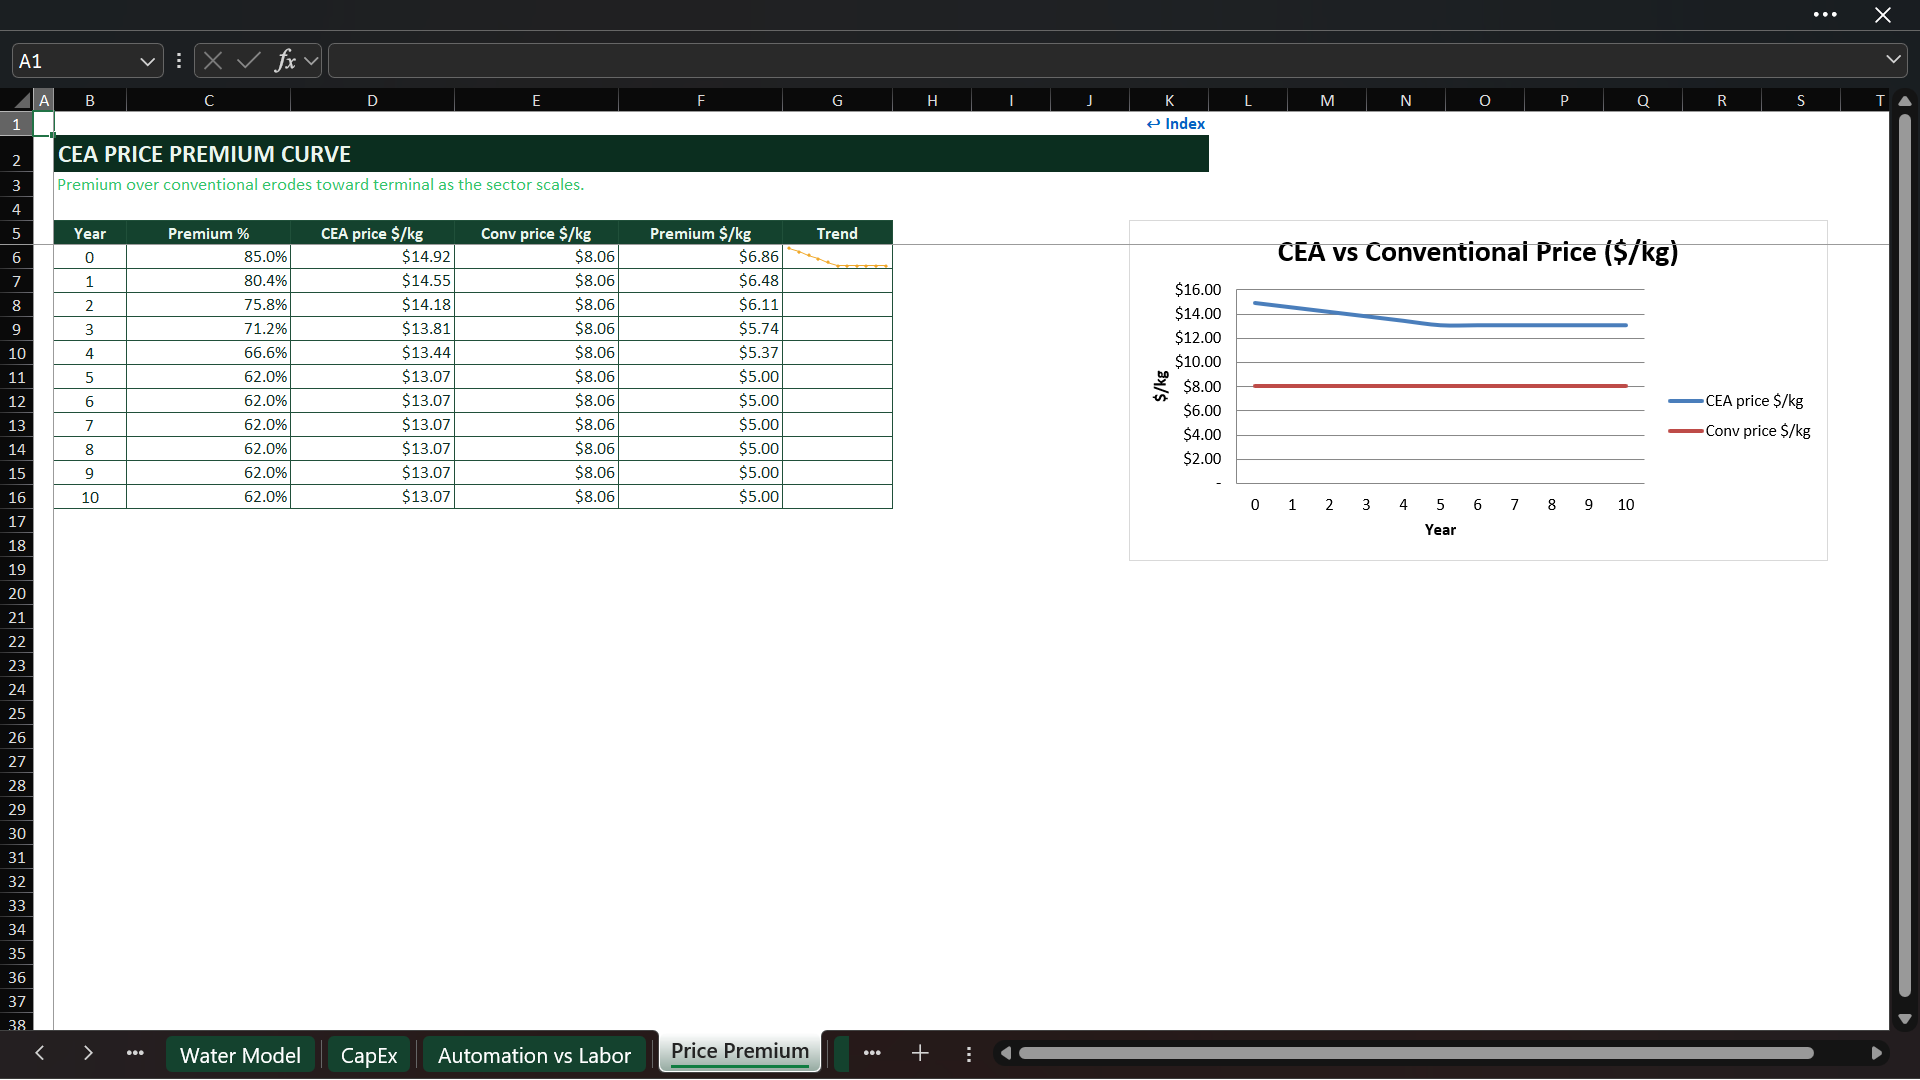
💵 PRICE PREMIUM, REVENUE & CARBON OPTIONALITY
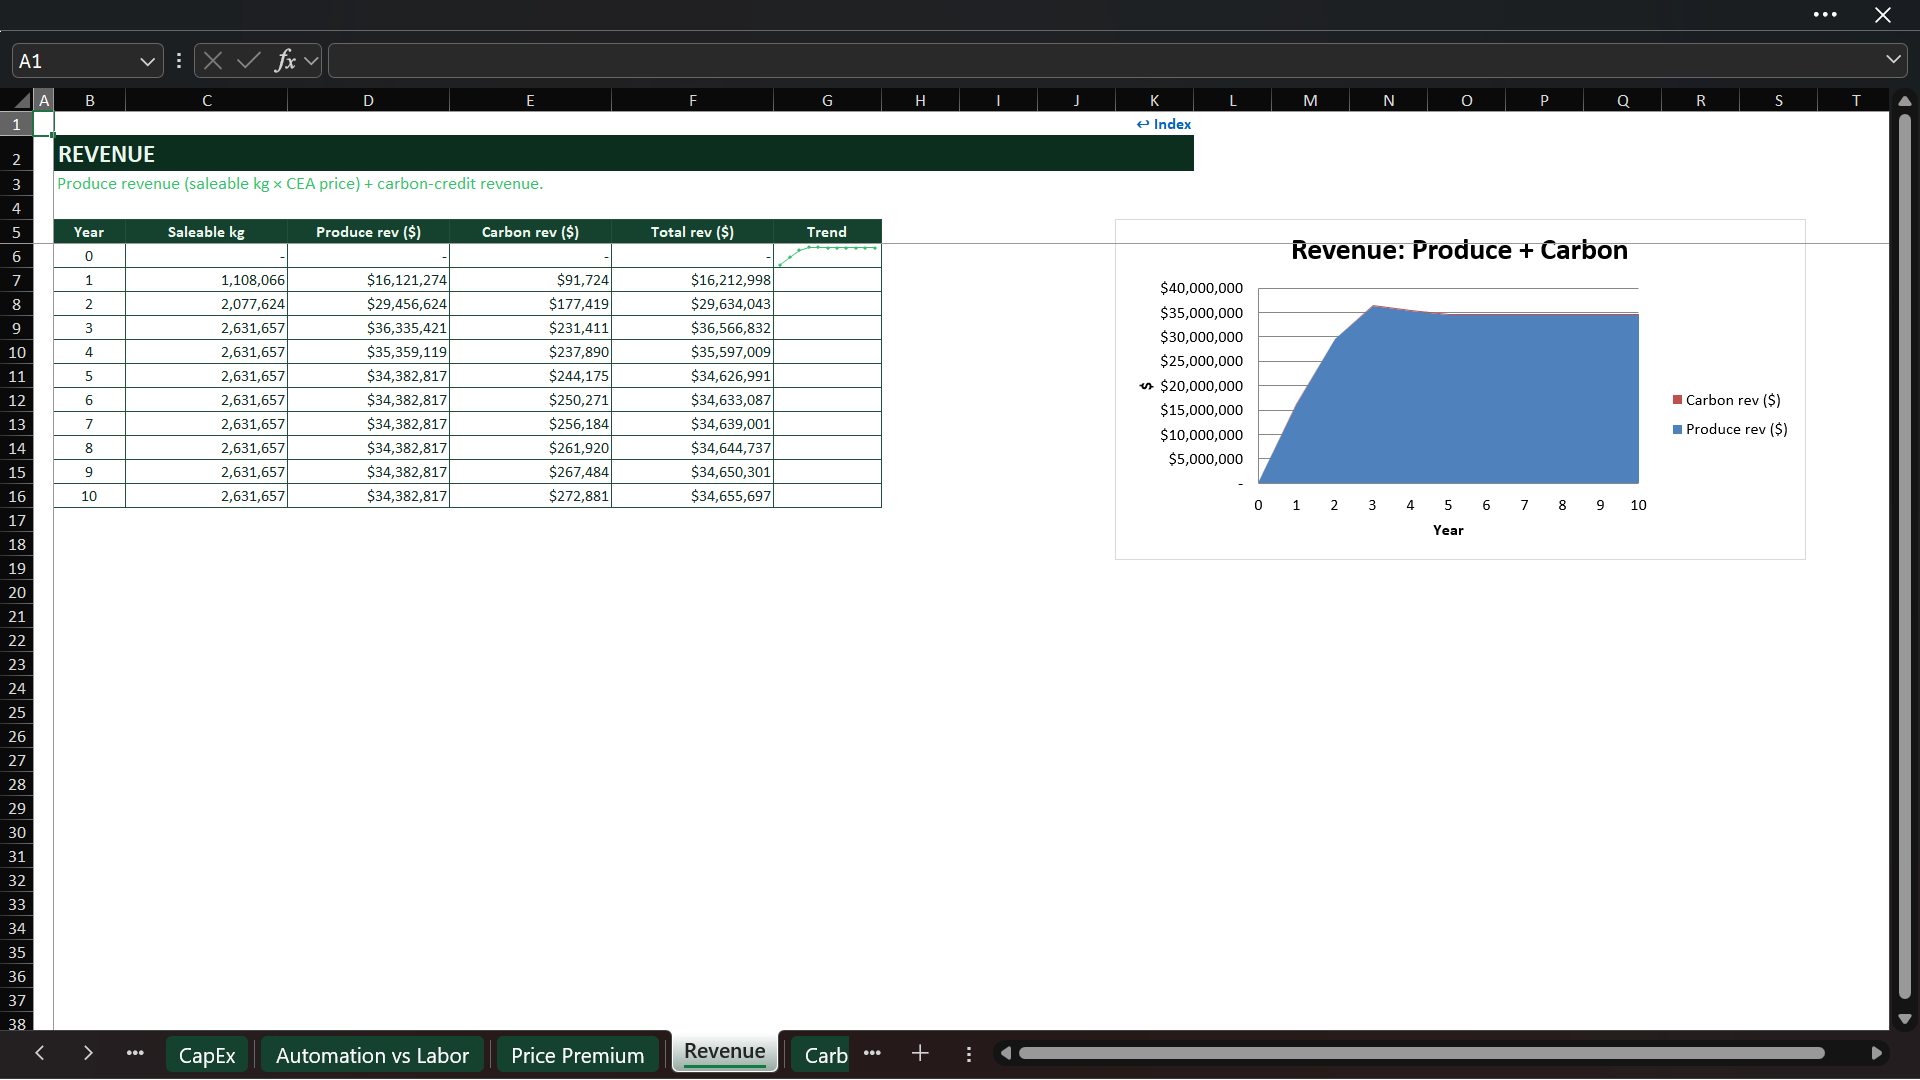
Produce revenue is driven by saleable kilograms and an implied CEA selling-price curve. Instead of holding the initial premium constant forever, the model allows the CEA premium over conventional produce to decline toward a terminal level as supply expands and the sector matures. This makes the commercial case more realistic and helps users test how margin behaves when early pricing advantages compress.
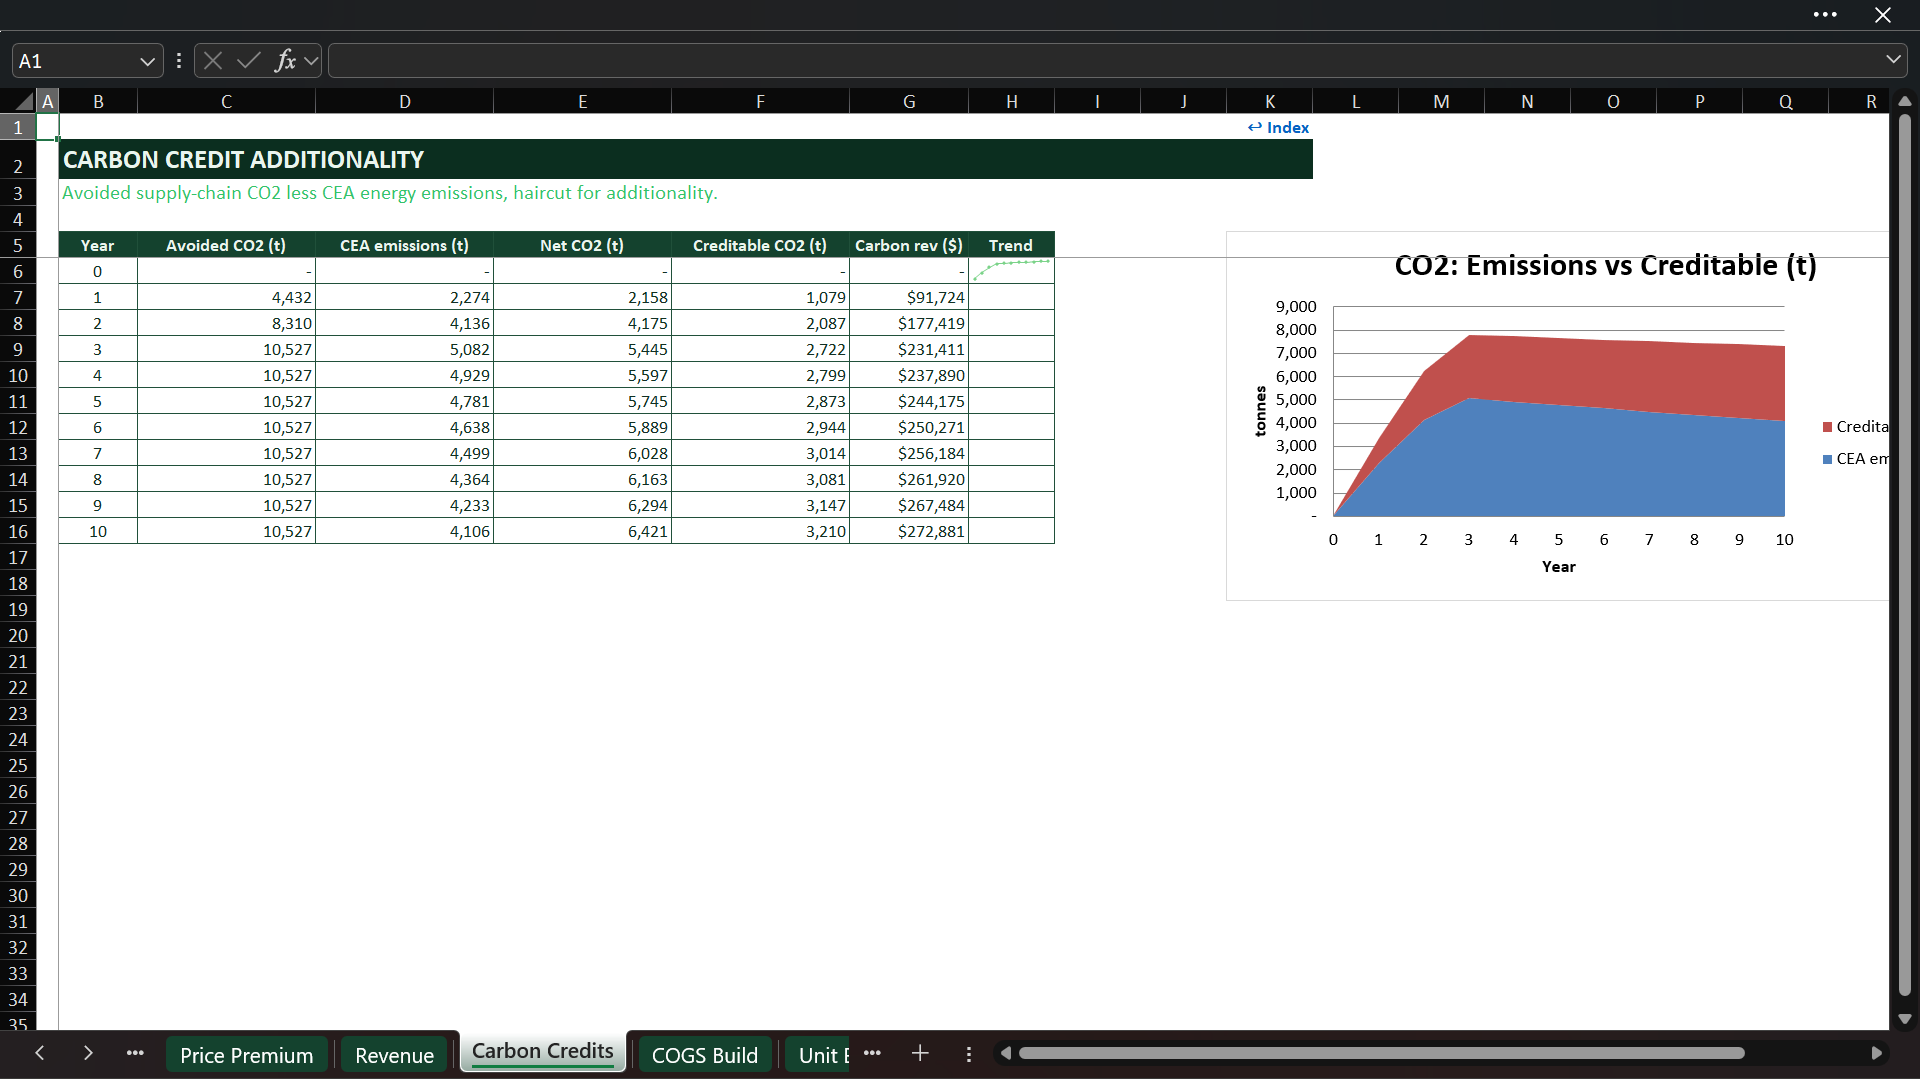
An optional carbon module estimates avoided supply-chain emissions, subtracts electricity-related emissions after renewable-power adjustments, applies an additionality factor, and values creditable tonnes at an editable carbon price. Carbon revenue is shown separately and the feature can be turned off.
Carbon outputs are illustrative only and are not a certification of eligibility, additionality, registration, verification, or credit issuance under any registry.

🧮 COGS BUILD & UNIT ECONOMICS
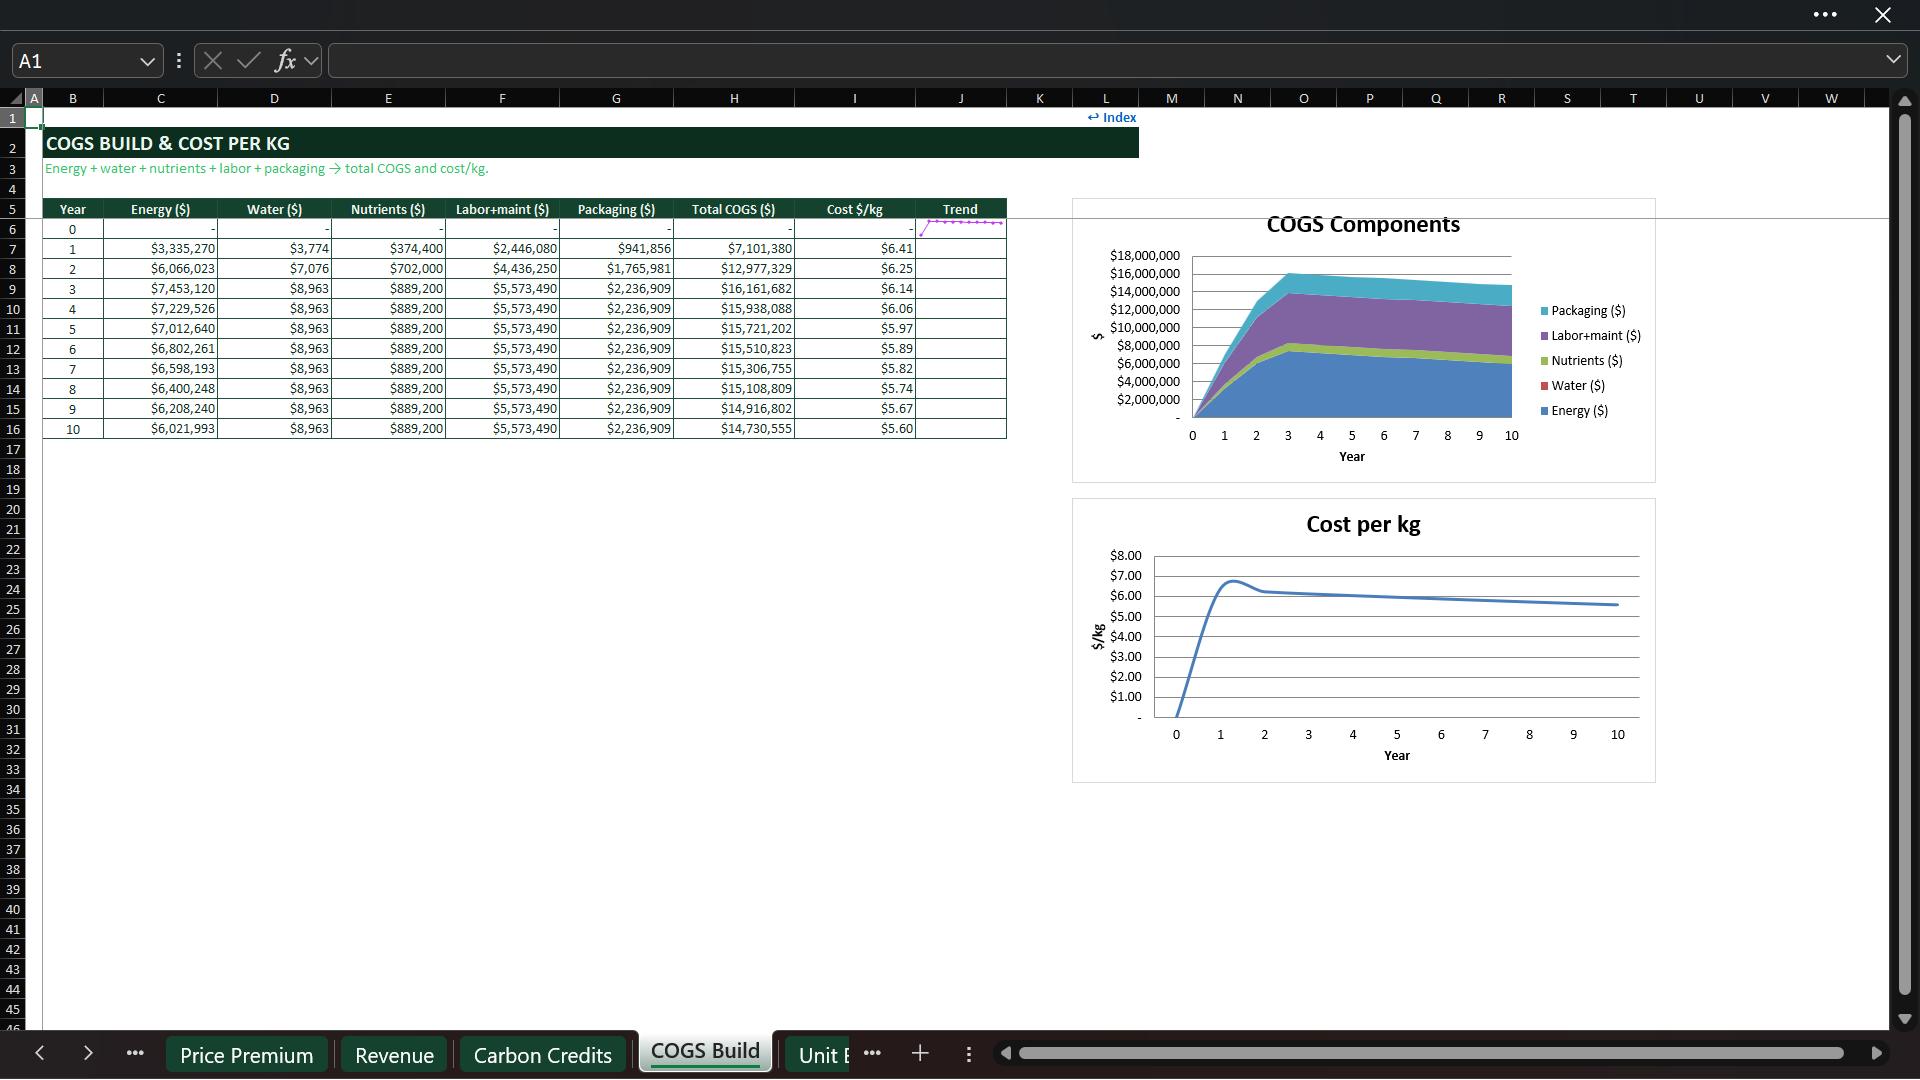
The cost build links production and operating assumptions into five major COGS categories: energy, water, nutrients, labor plus automation maintenance, and packaging/distribution. It reports total annual COGS and cost per saleable kilogram across the forecast.
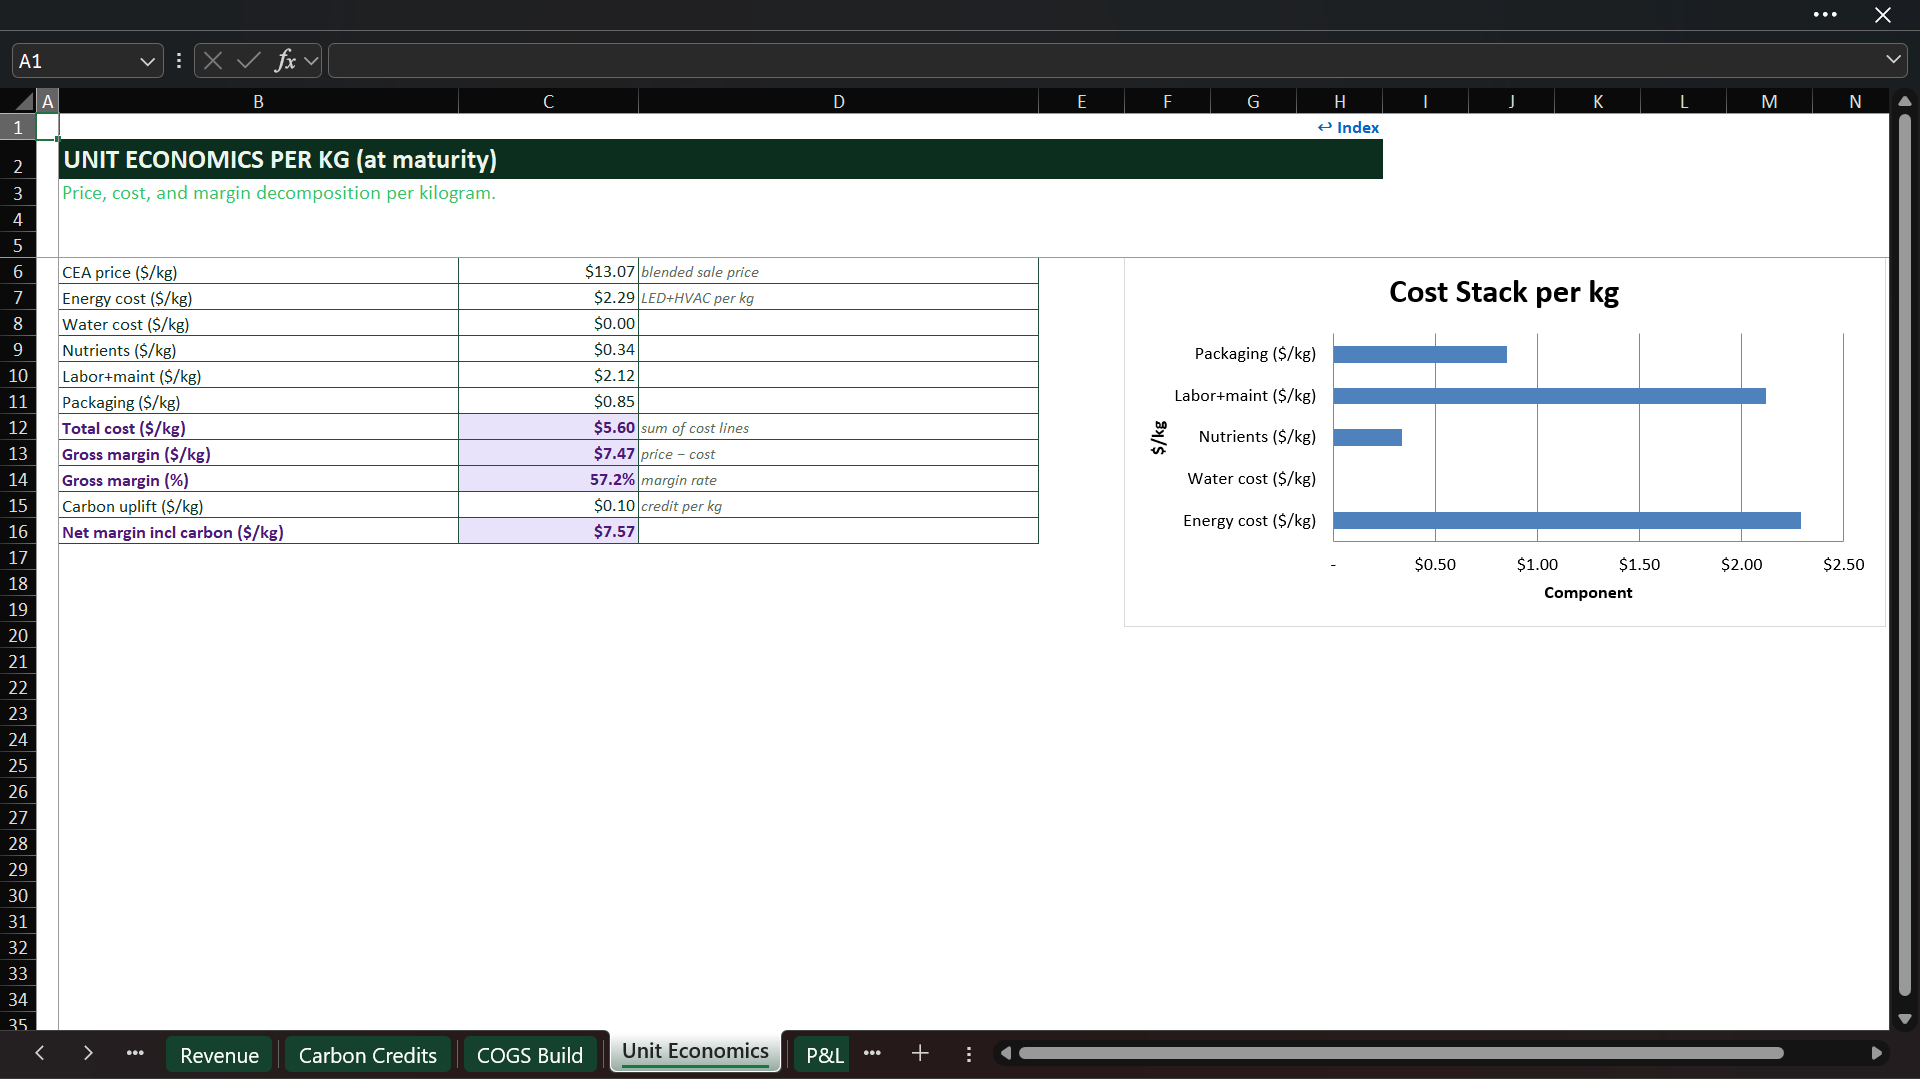
The maturity-year unit-economics schedule decomposes:
• Selling price per kilogram.
• Energy cost per kilogram.
• Water cost per kilogram.
• Nutrient cost per kilogram.
• Labor and automation-maintenance cost per kilogram.
• Packaging and distribution cost per kilogram.
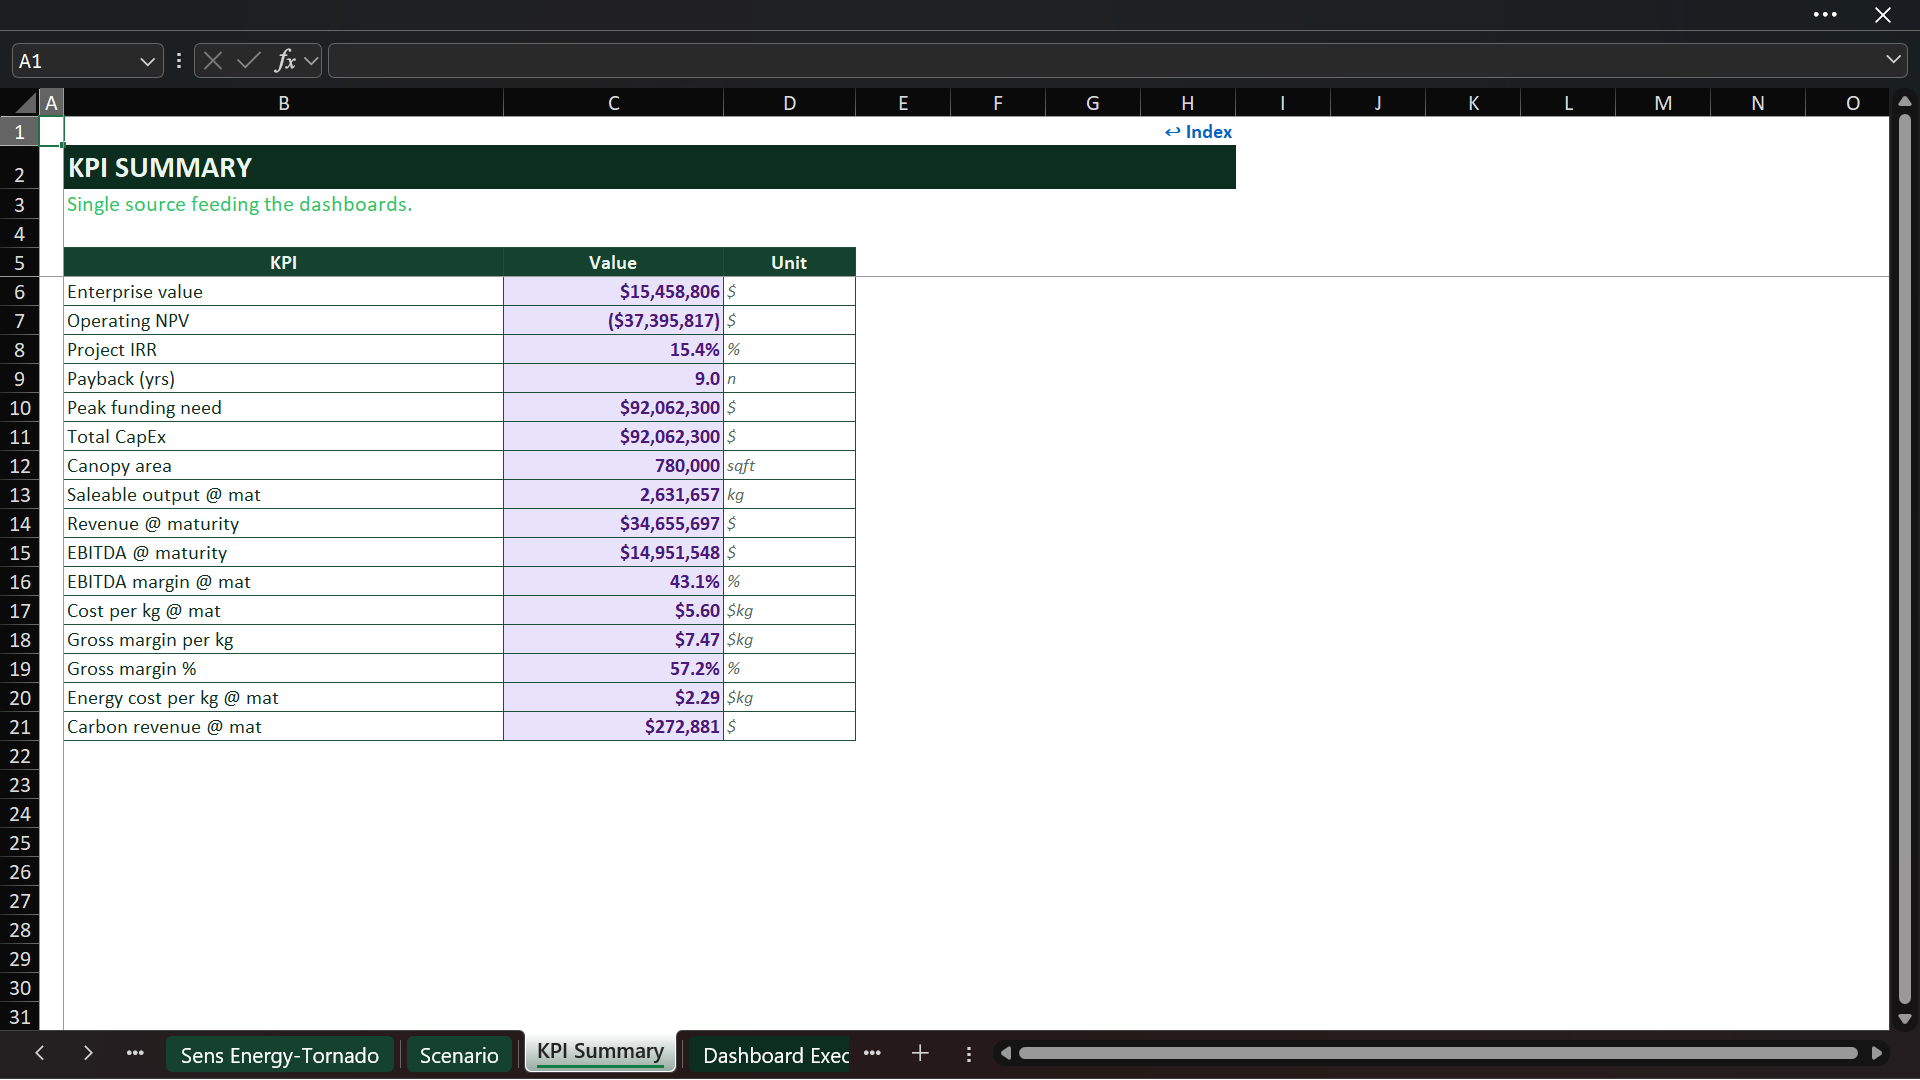
• Total cost, gross margin, gross-margin percentage, carbon uplift, and net margin including carbon.
This bridge identifies the cost categories that need improvement and whether the crop mix can support the required margin.

📊 10-YEAR P&L, CASH FLOW & VALUATION
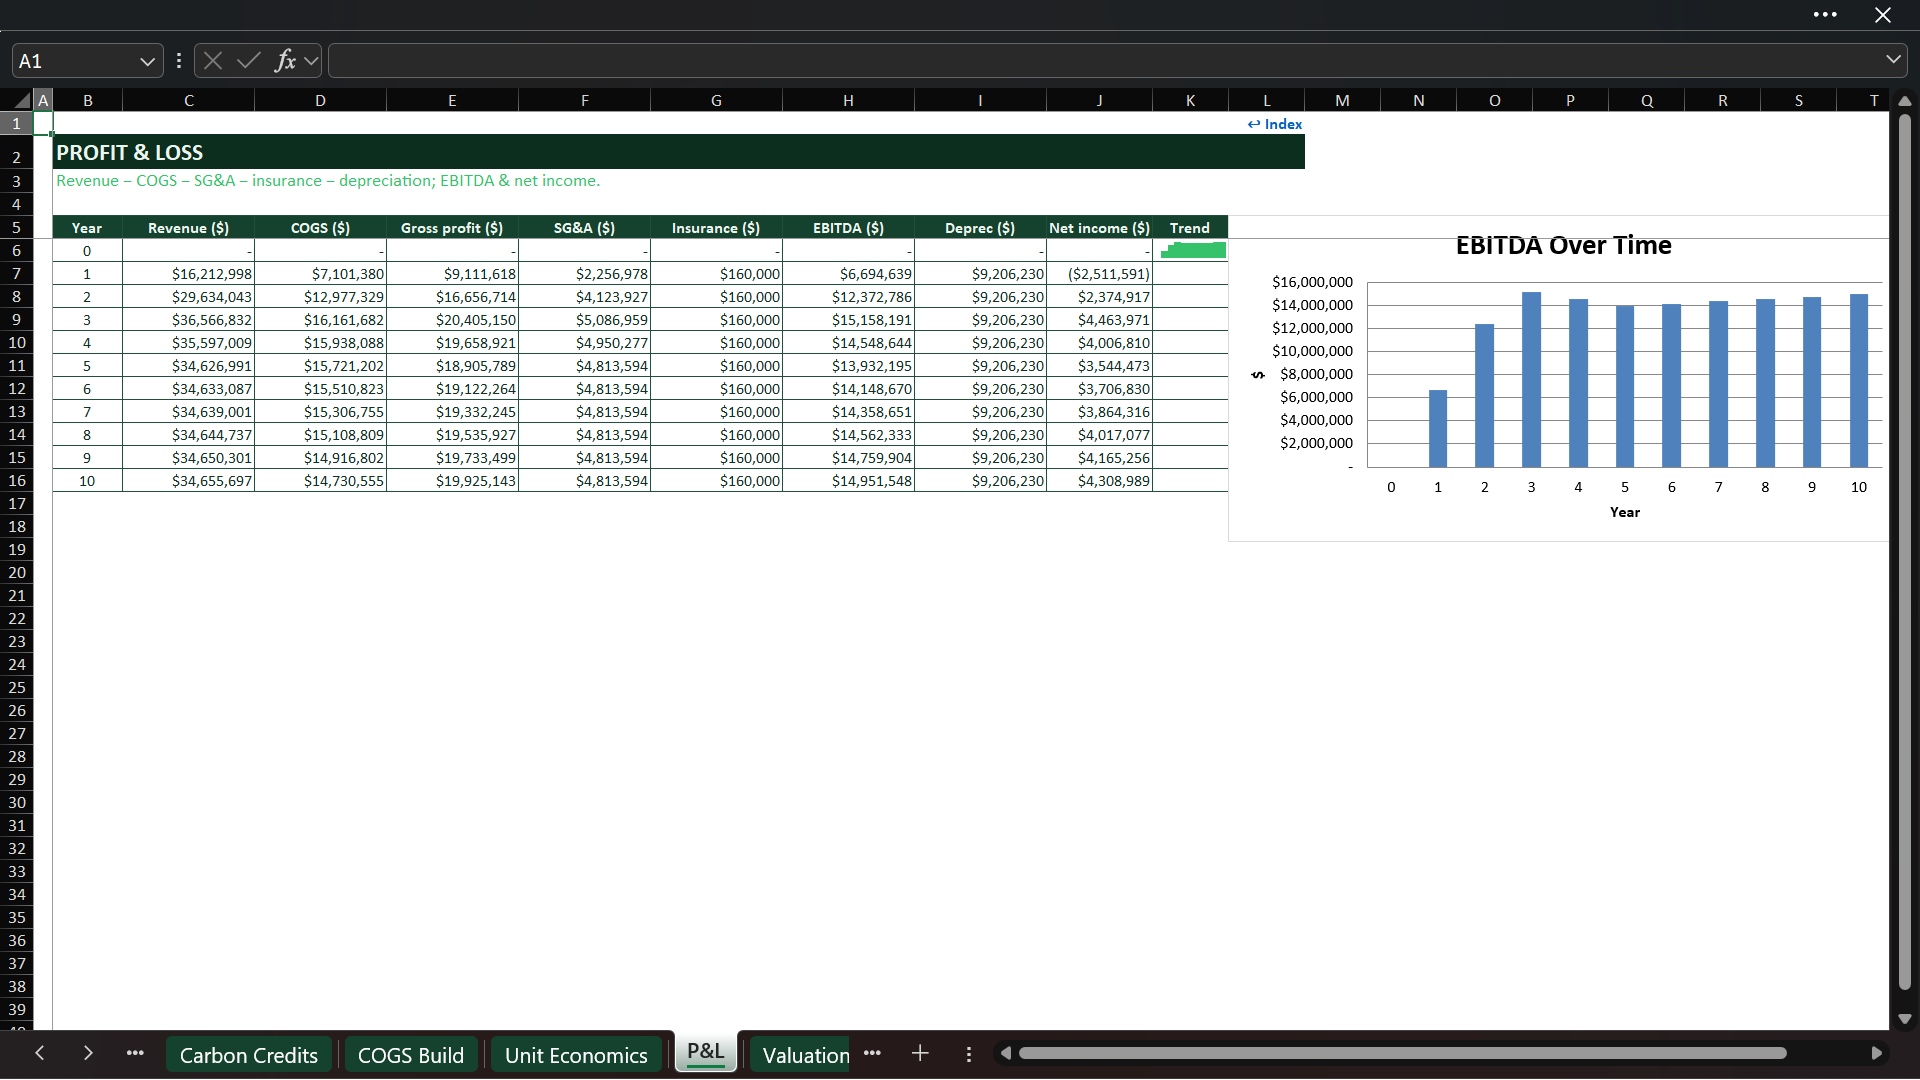
The linked profit and loss statement presents revenue, COGS, gross profit, SG&A, insurance/property cost, EBITDA, depreciation, and net income from Year 0 through Year 10.
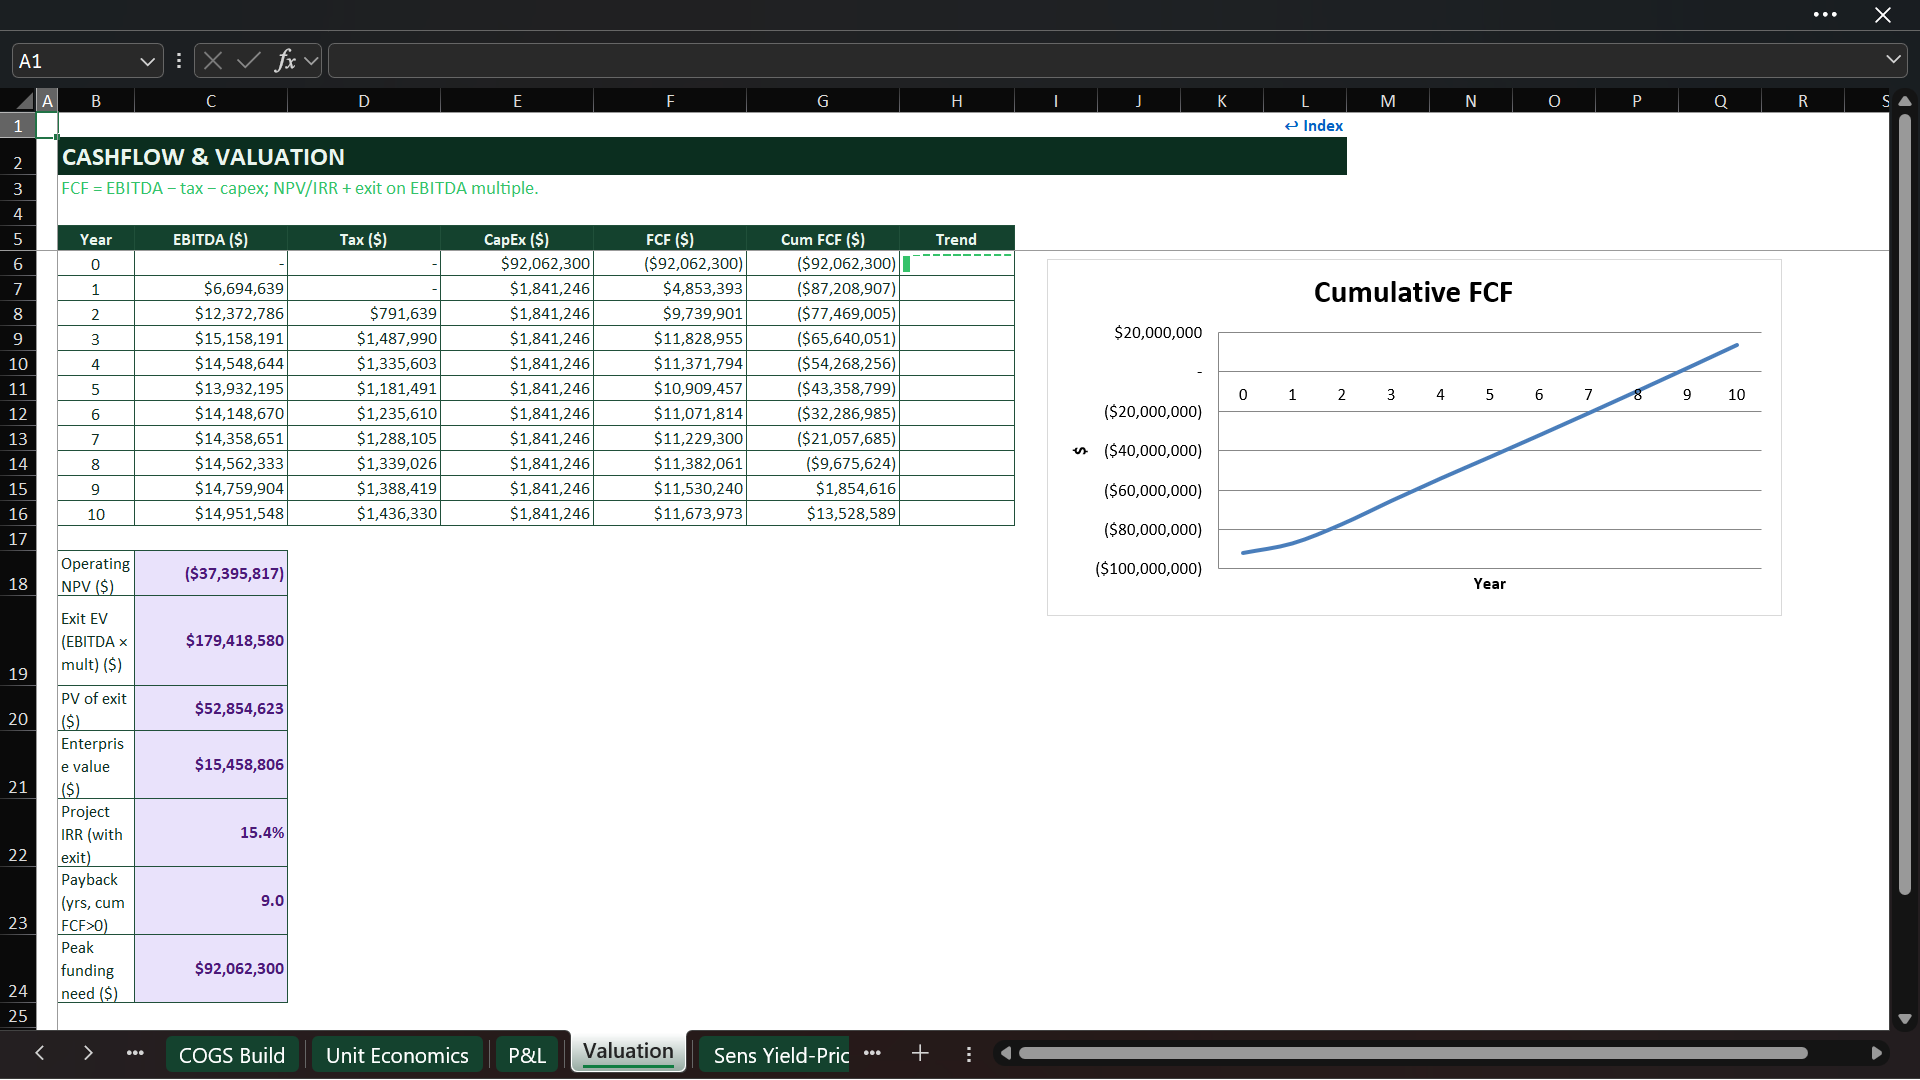
The valuation schedule converts operating results into annual cash flow using EBITDA, cash tax, initial CapEx, and sustaining capital. It calculates operating NPV, terminal enterprise value using an editable EBITDA exit multiple, present value of the exit, total enterprise value, project IRR including the exit, payback status, and peak funding requirement.
The valuation is an unlevered project view. It does not include a debt schedule, balance sheet, investor waterfall, or financing covenants. Add a project-specific financing module if required.

🧭 SCENARIOS, SENSITIVITIES & DRIVER PRIORITIZATION
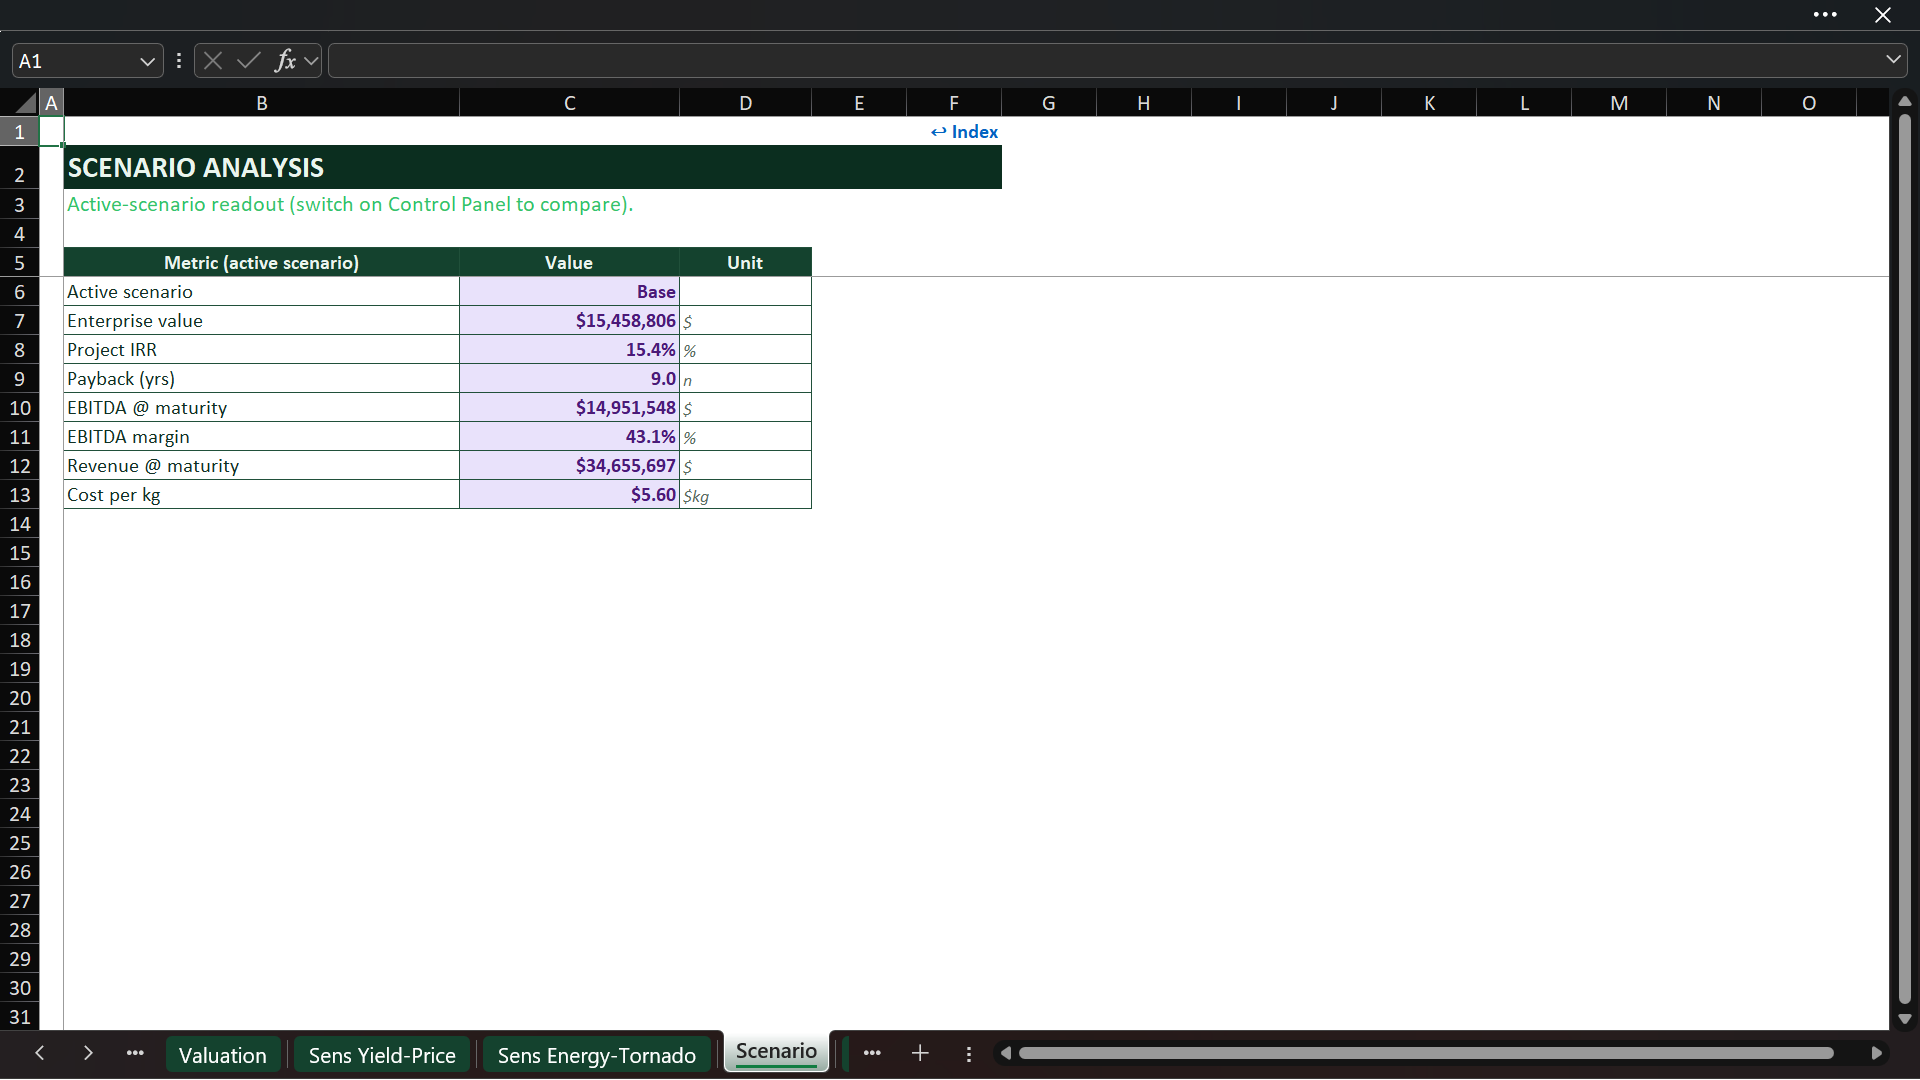
The Bear, Base, and Bull selector changes five important driver groups: yield, price/premium, energy cost, labor cost, and carbon price. The active scenario flows through the linked operating model and produces a clear readout of enterprise value, project IRR, payback, mature EBITDA, EBITDA margin, revenue, and cost per kilogram.
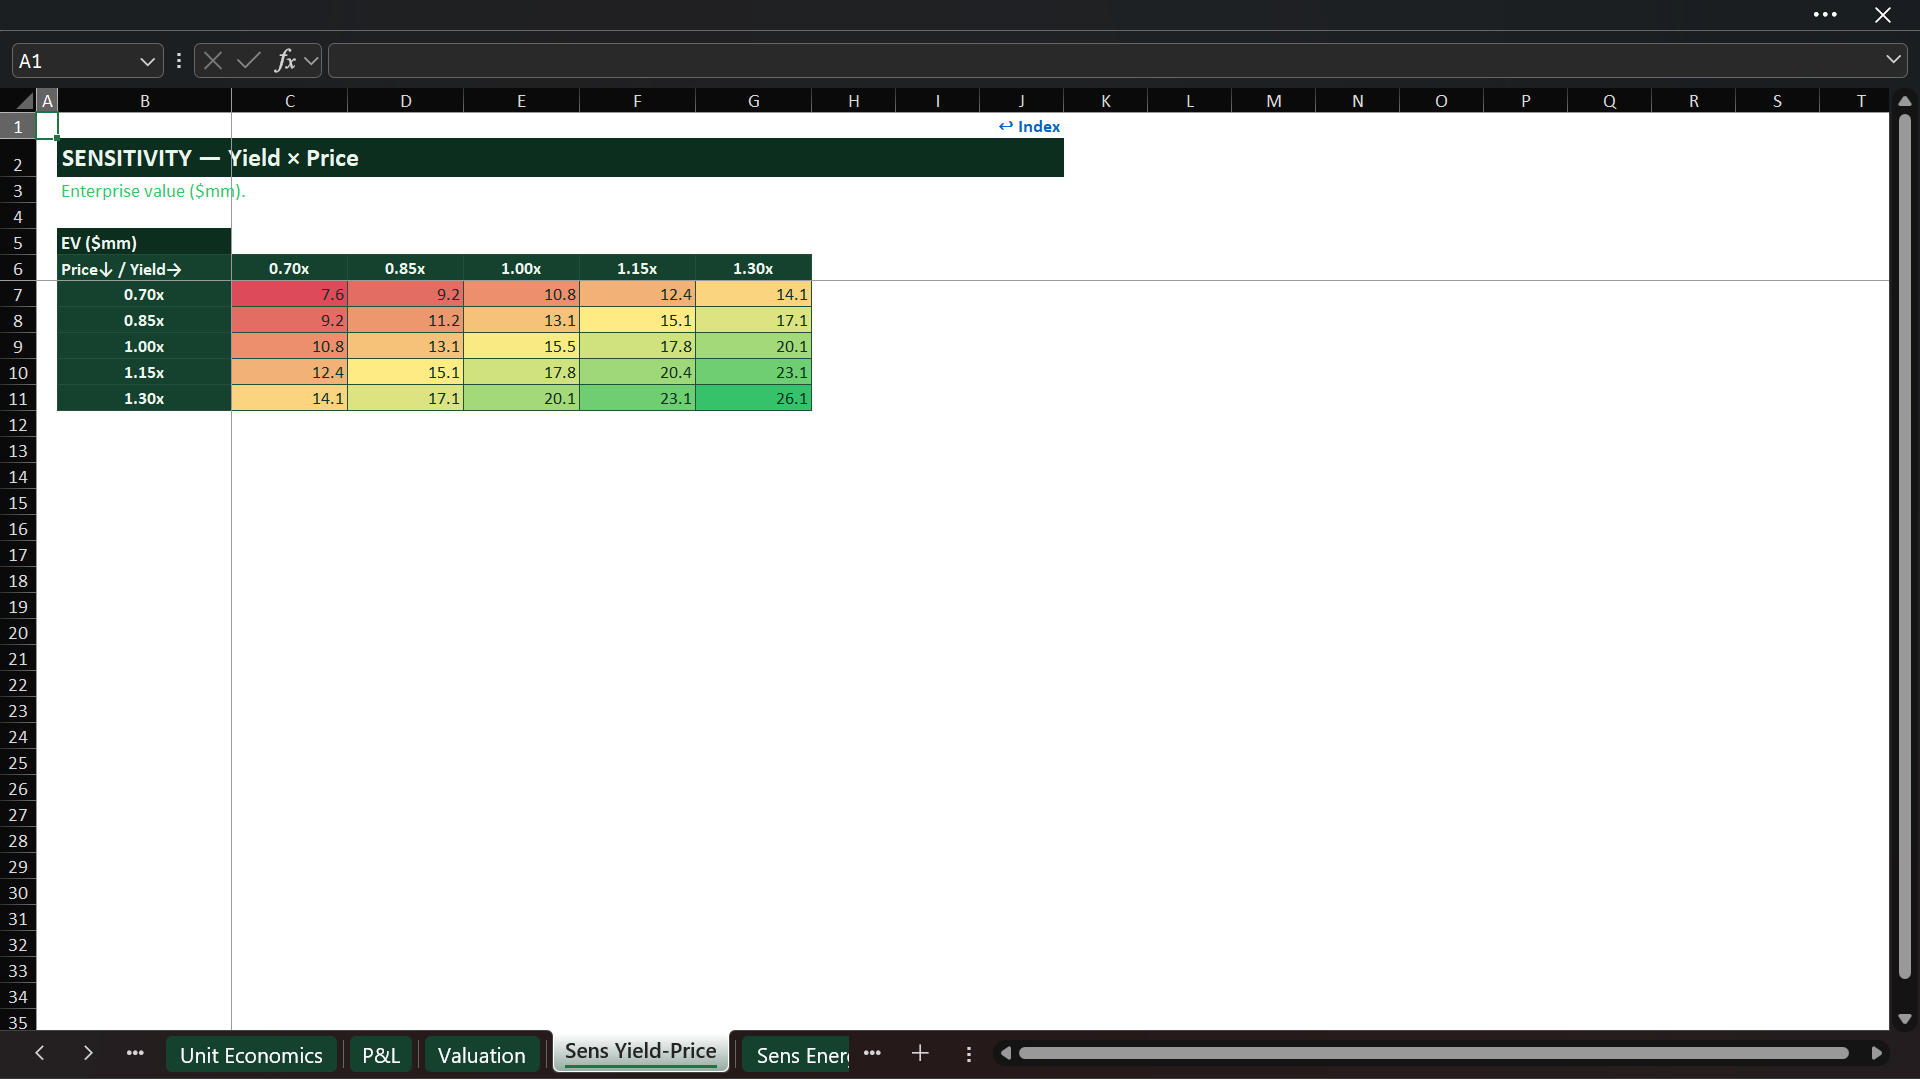
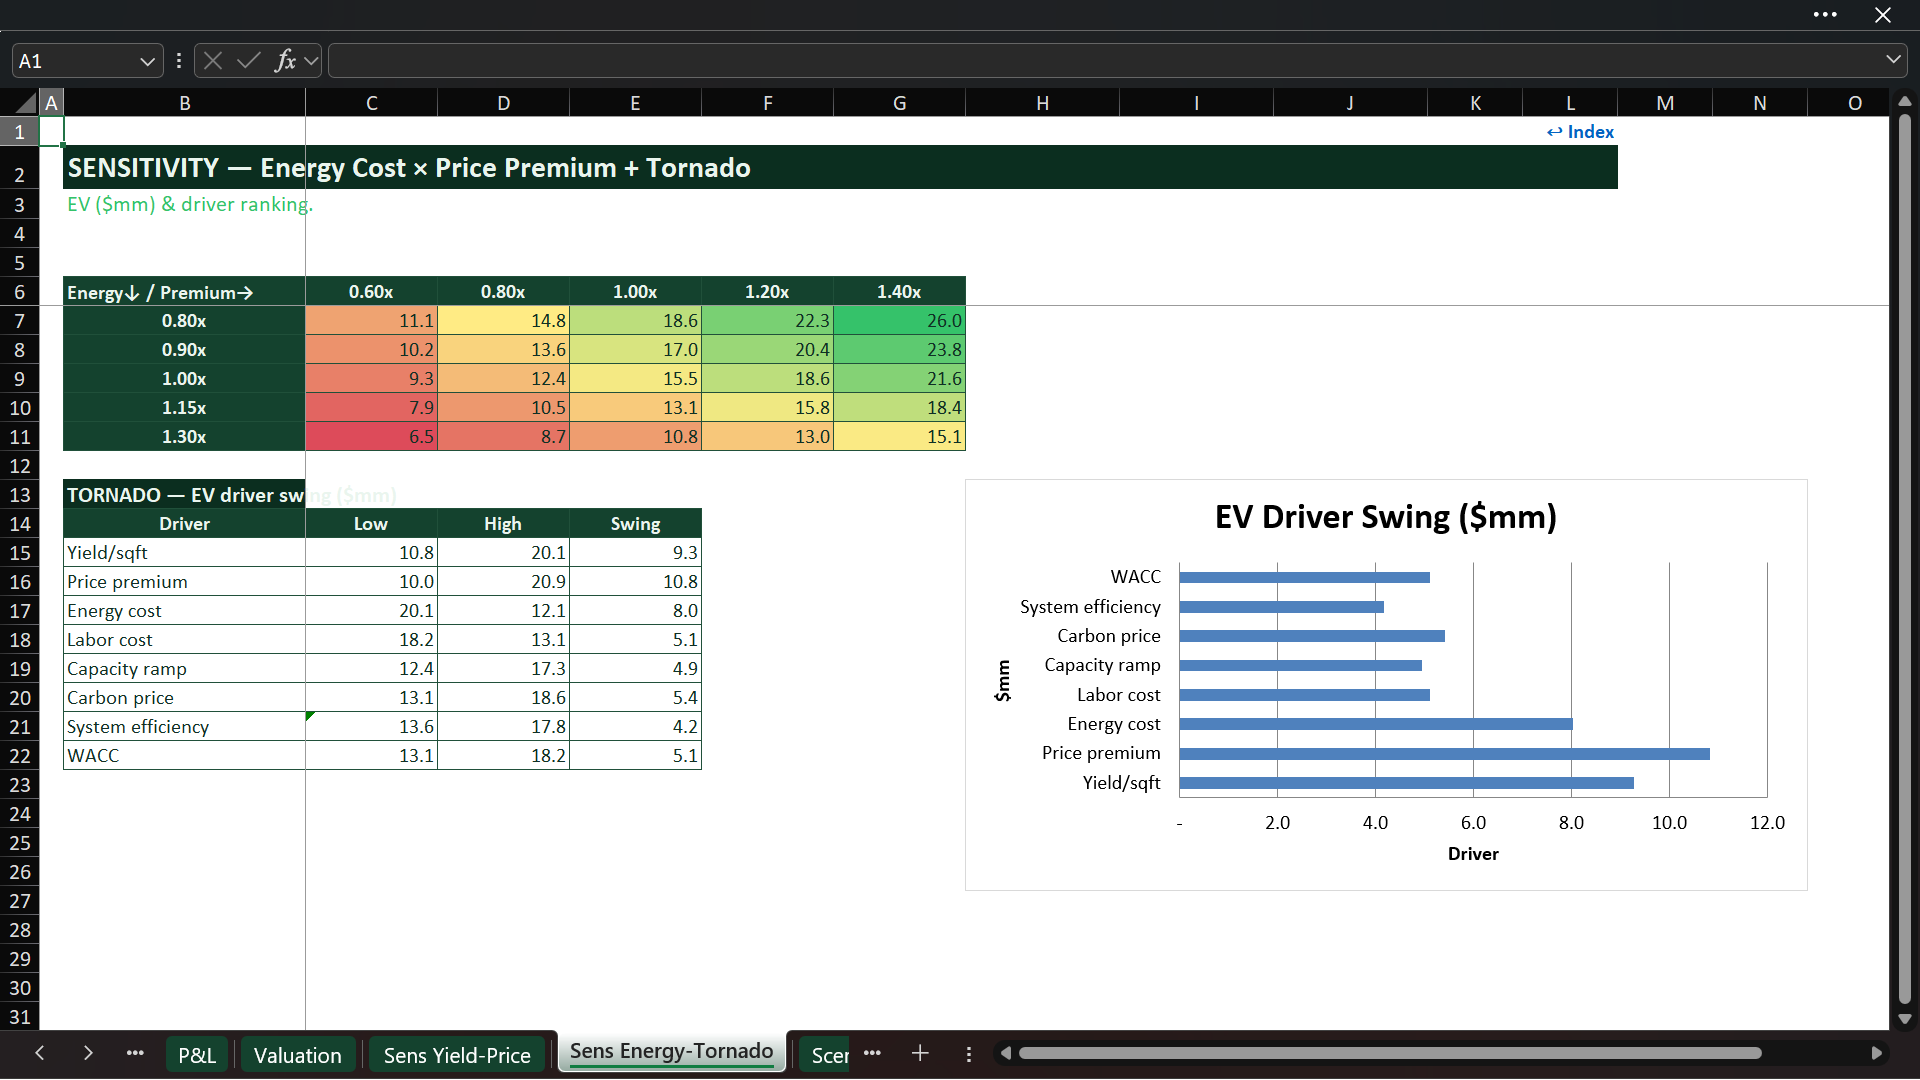
The workbook also includes illustrative yield-versus-price and energy-versus-premium enterprise-value grids, plus a tornado-style driver-ranking view covering yield, price premium, energy cost, labor cost, capacity ramp, carbon price, system efficiency, and WACC. These are designed to frame risk discussions and identify which assumptions deserve the most diligence.

📉 EXECUTIVE & OPERATING DASHBOARDS
Two dashboard sheets translate the detailed model into decision-ready views:
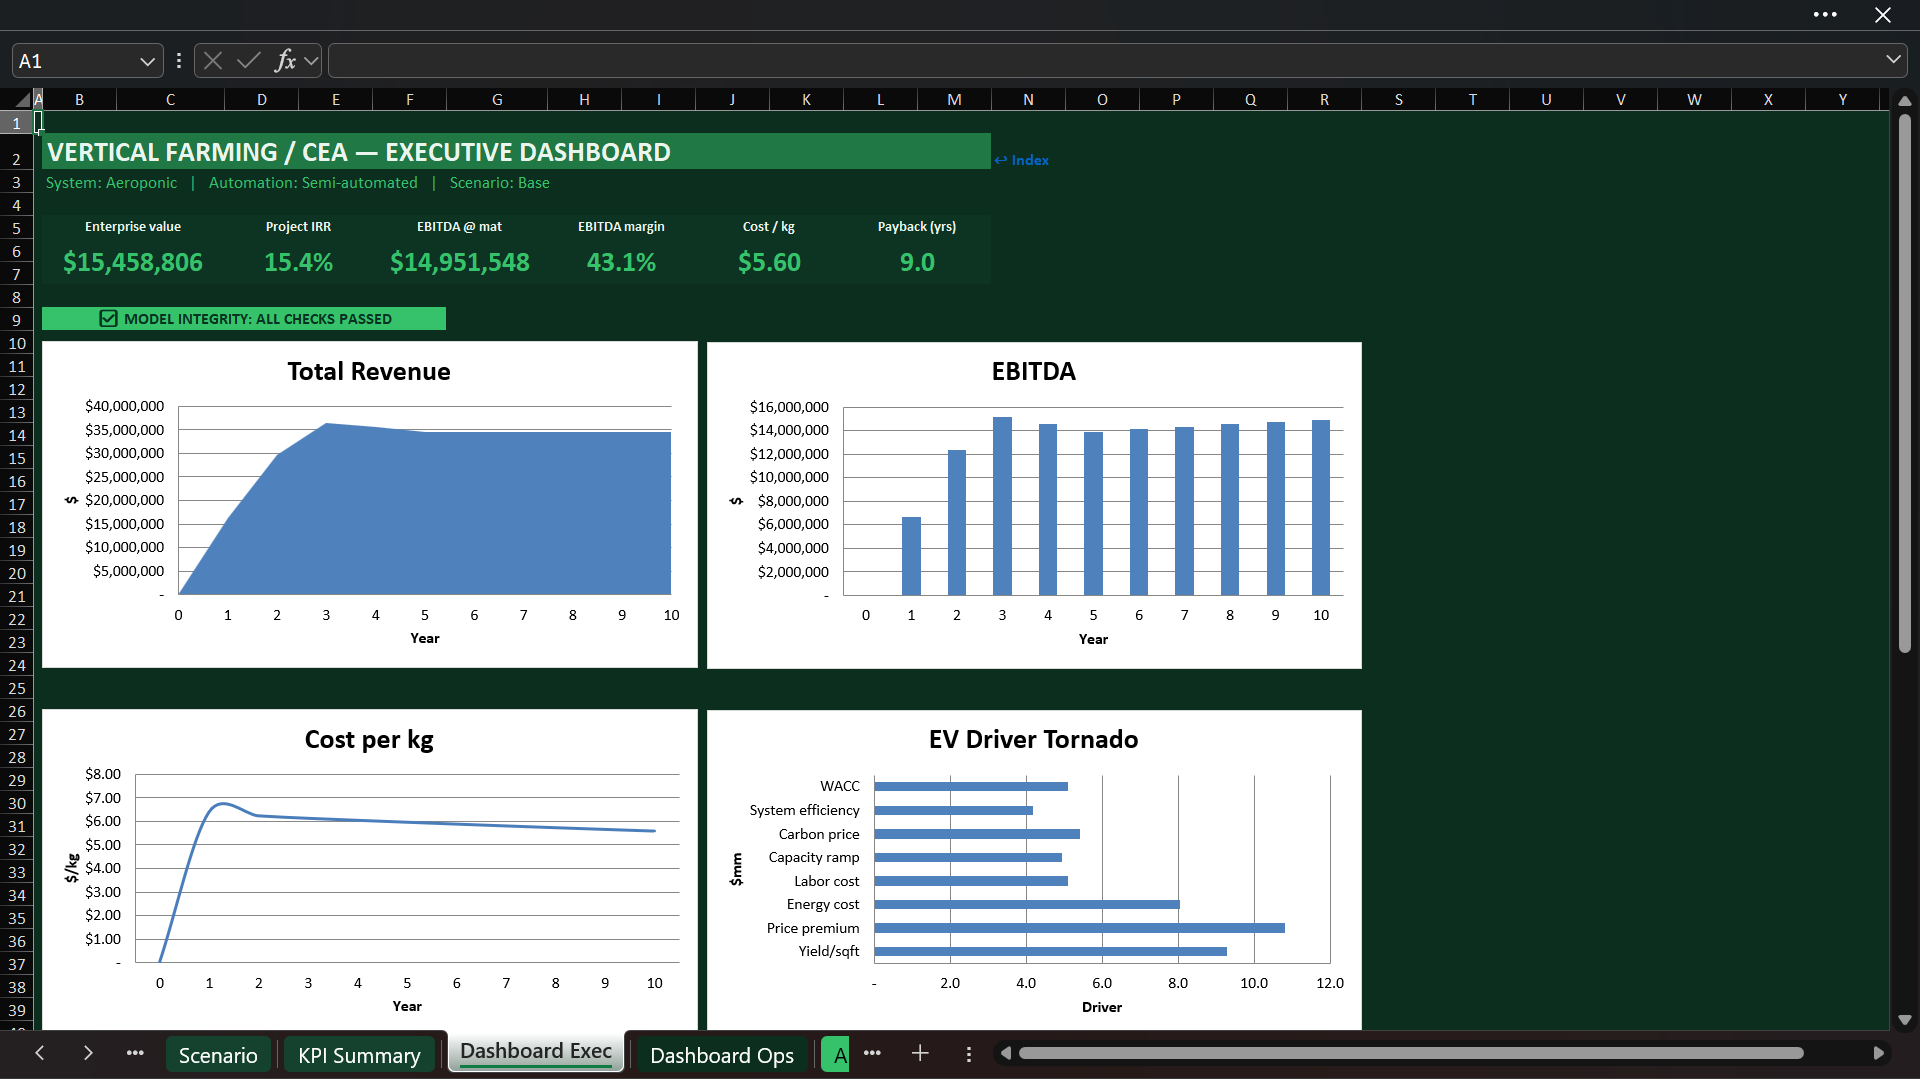
• Executive Dashboard: active system, automation and scenario; value, IRR, EBITDA, margin, cost per kilogram, payback, trends, and driver ranking.
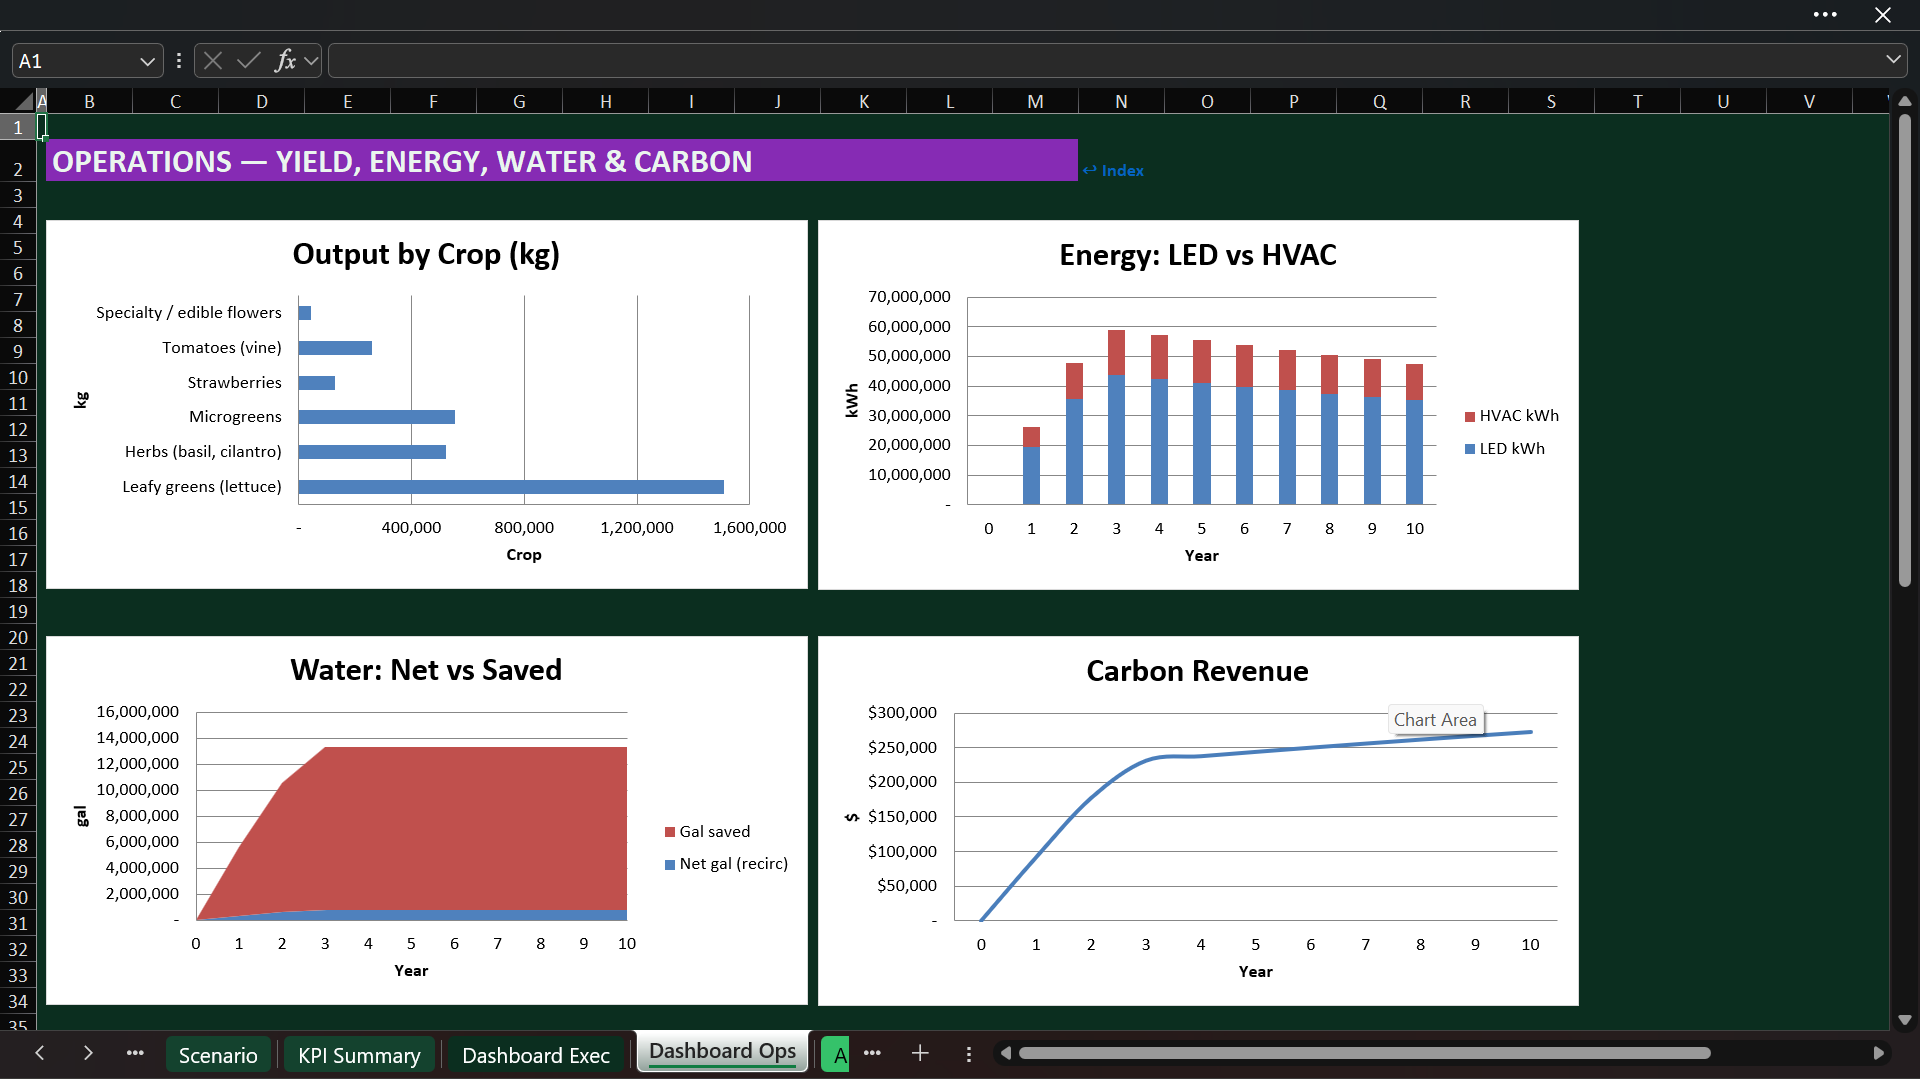
• Operations Dashboard: crop output, energy, unit energy cost, water draw and savings, and carbon-revenue trend.
The workbook contains 25 embedded Excel charts across its analytical and dashboard sheets, together with trend indicators on the core time-series schedules.

✅ AUDITABILITY, NAVIGATION & MODEL CONTROLS
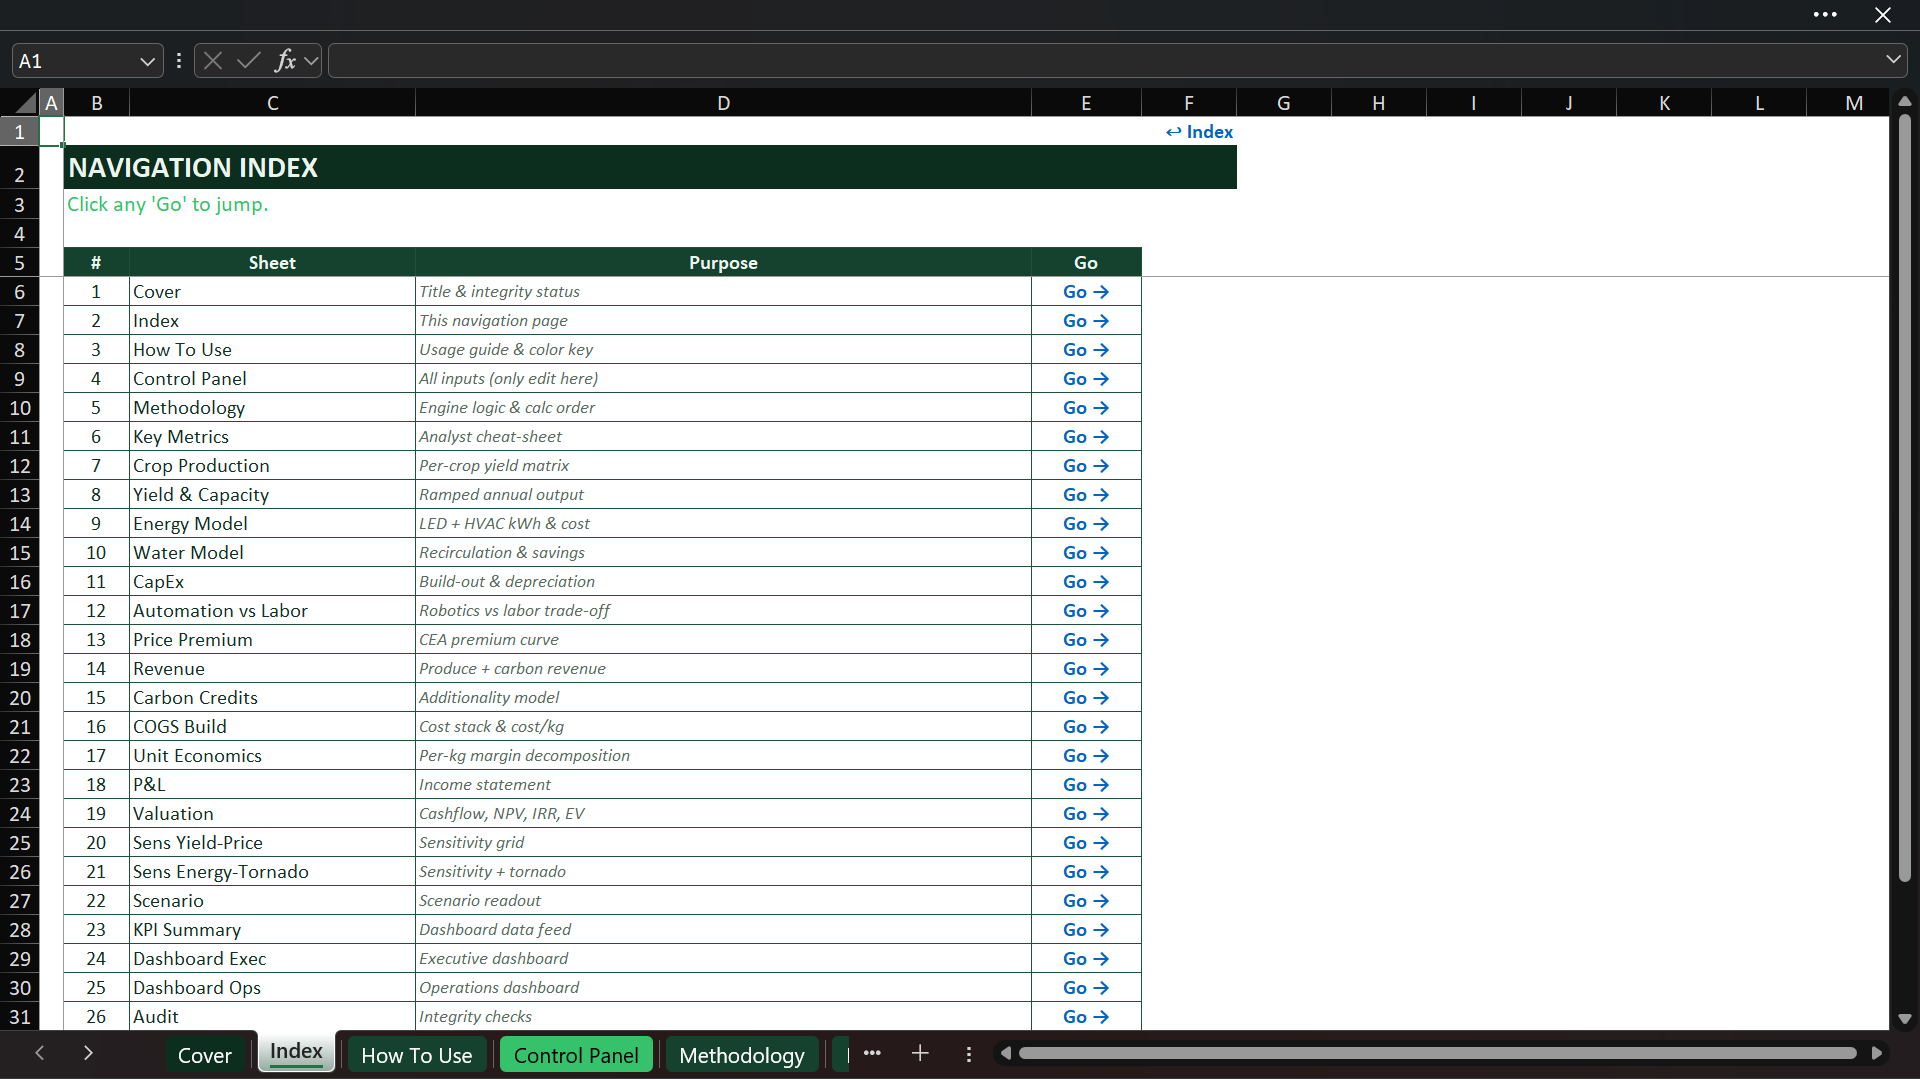
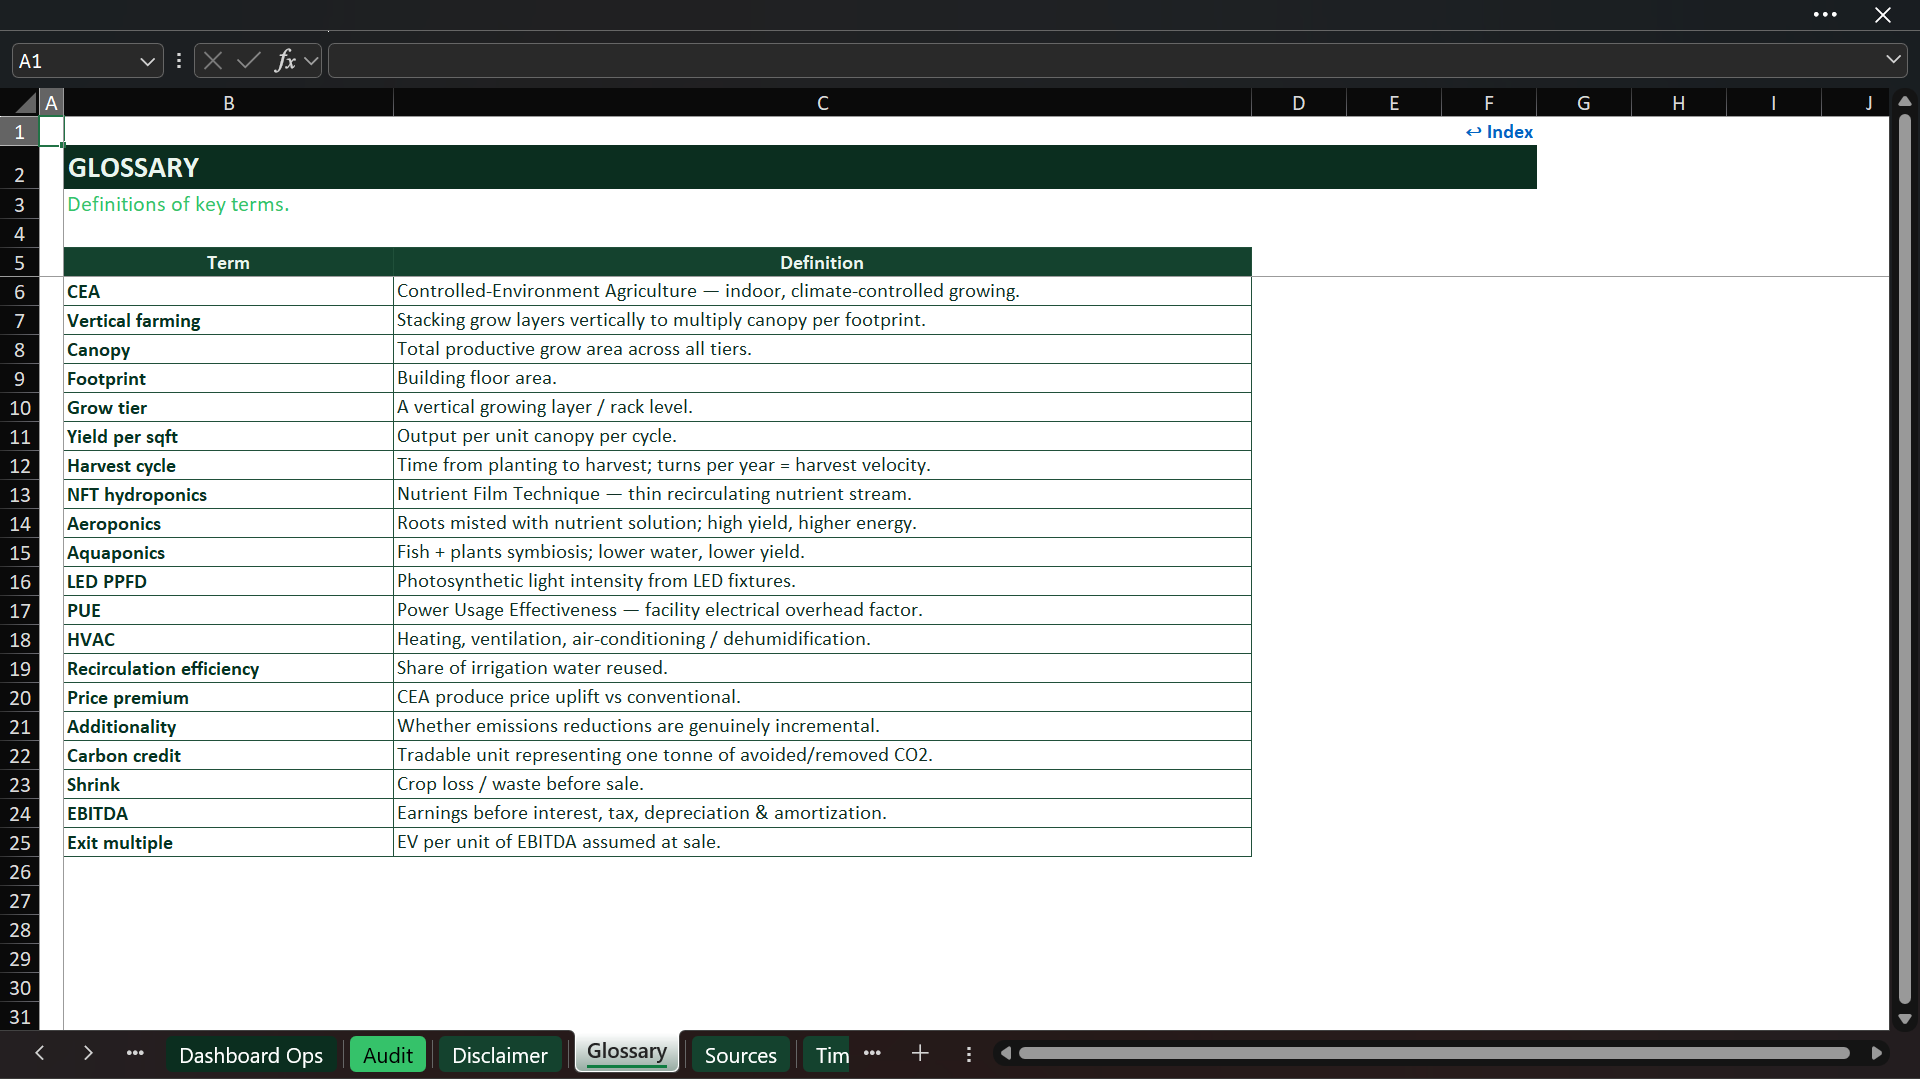
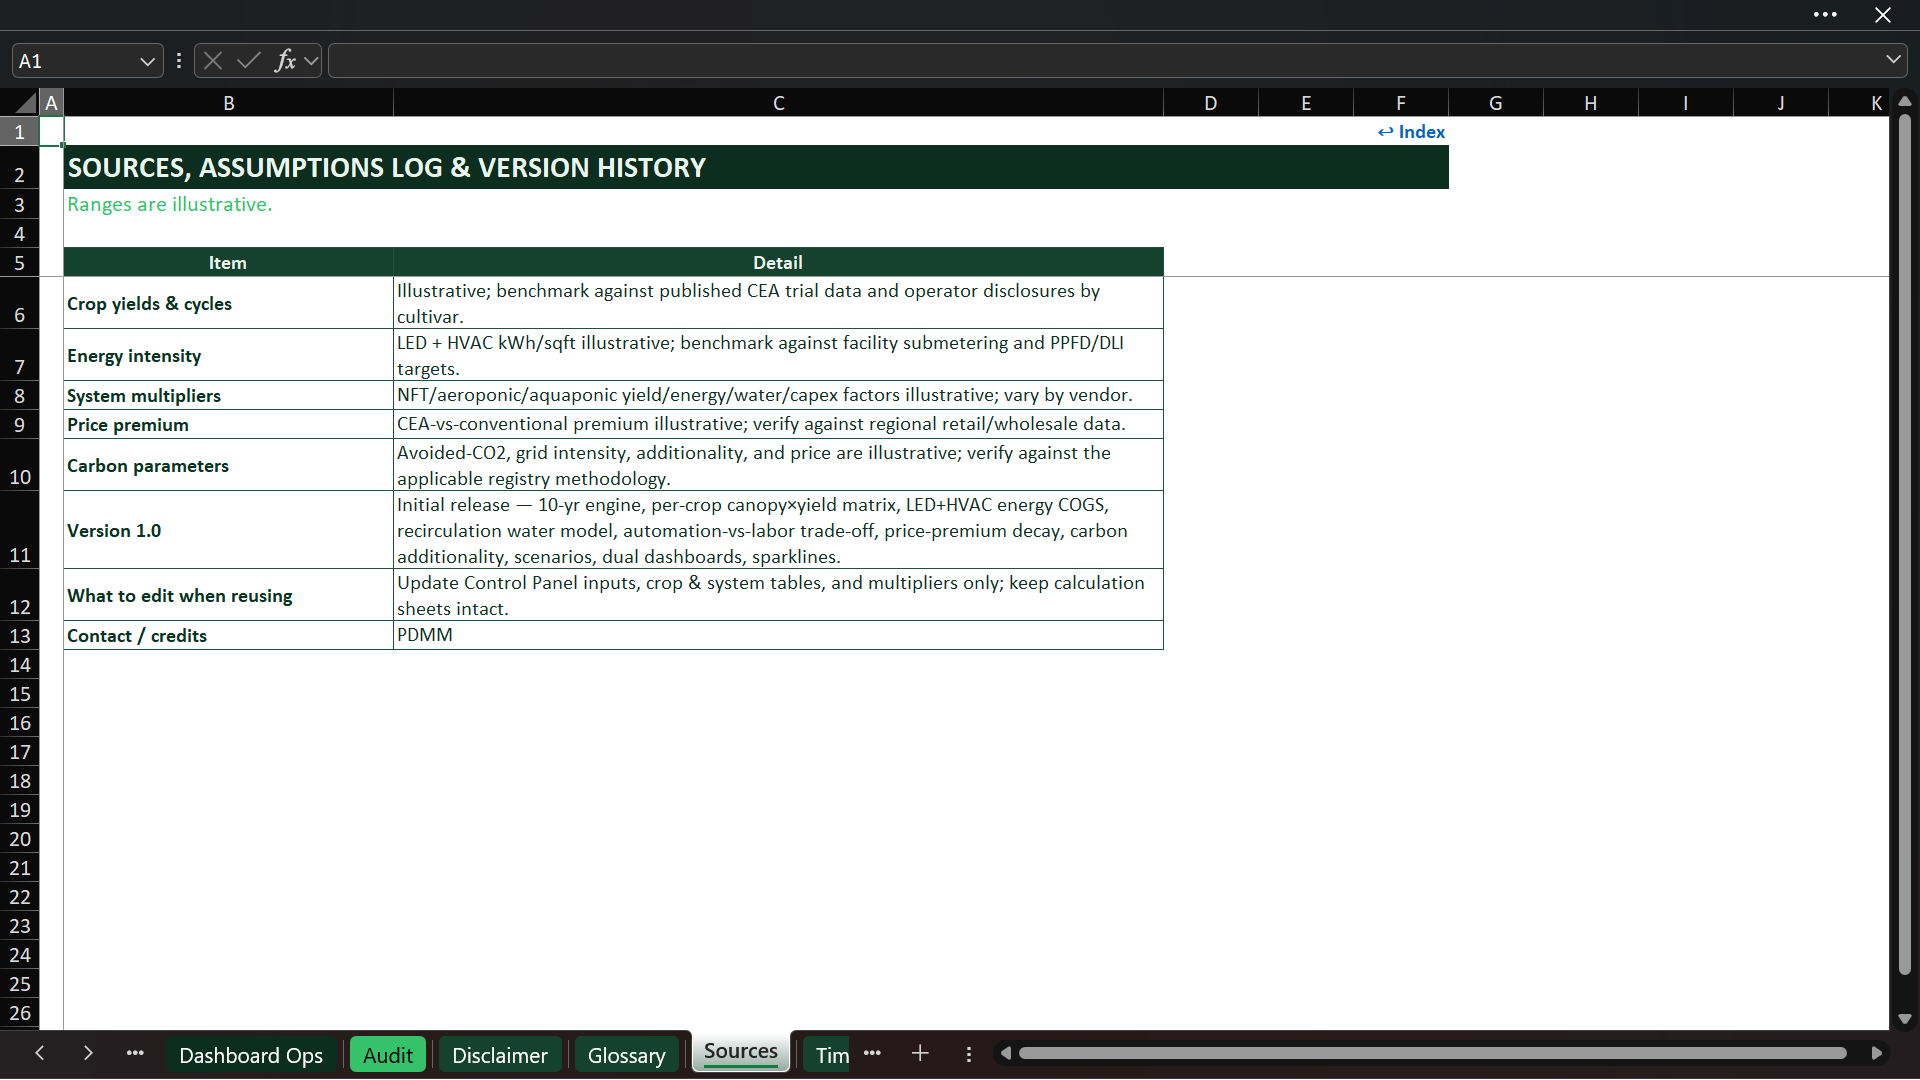
The model contains 30 worksheets, a navigation index, instructions, methodology, KPI definitions, glossary, assumptions log, and timeline.
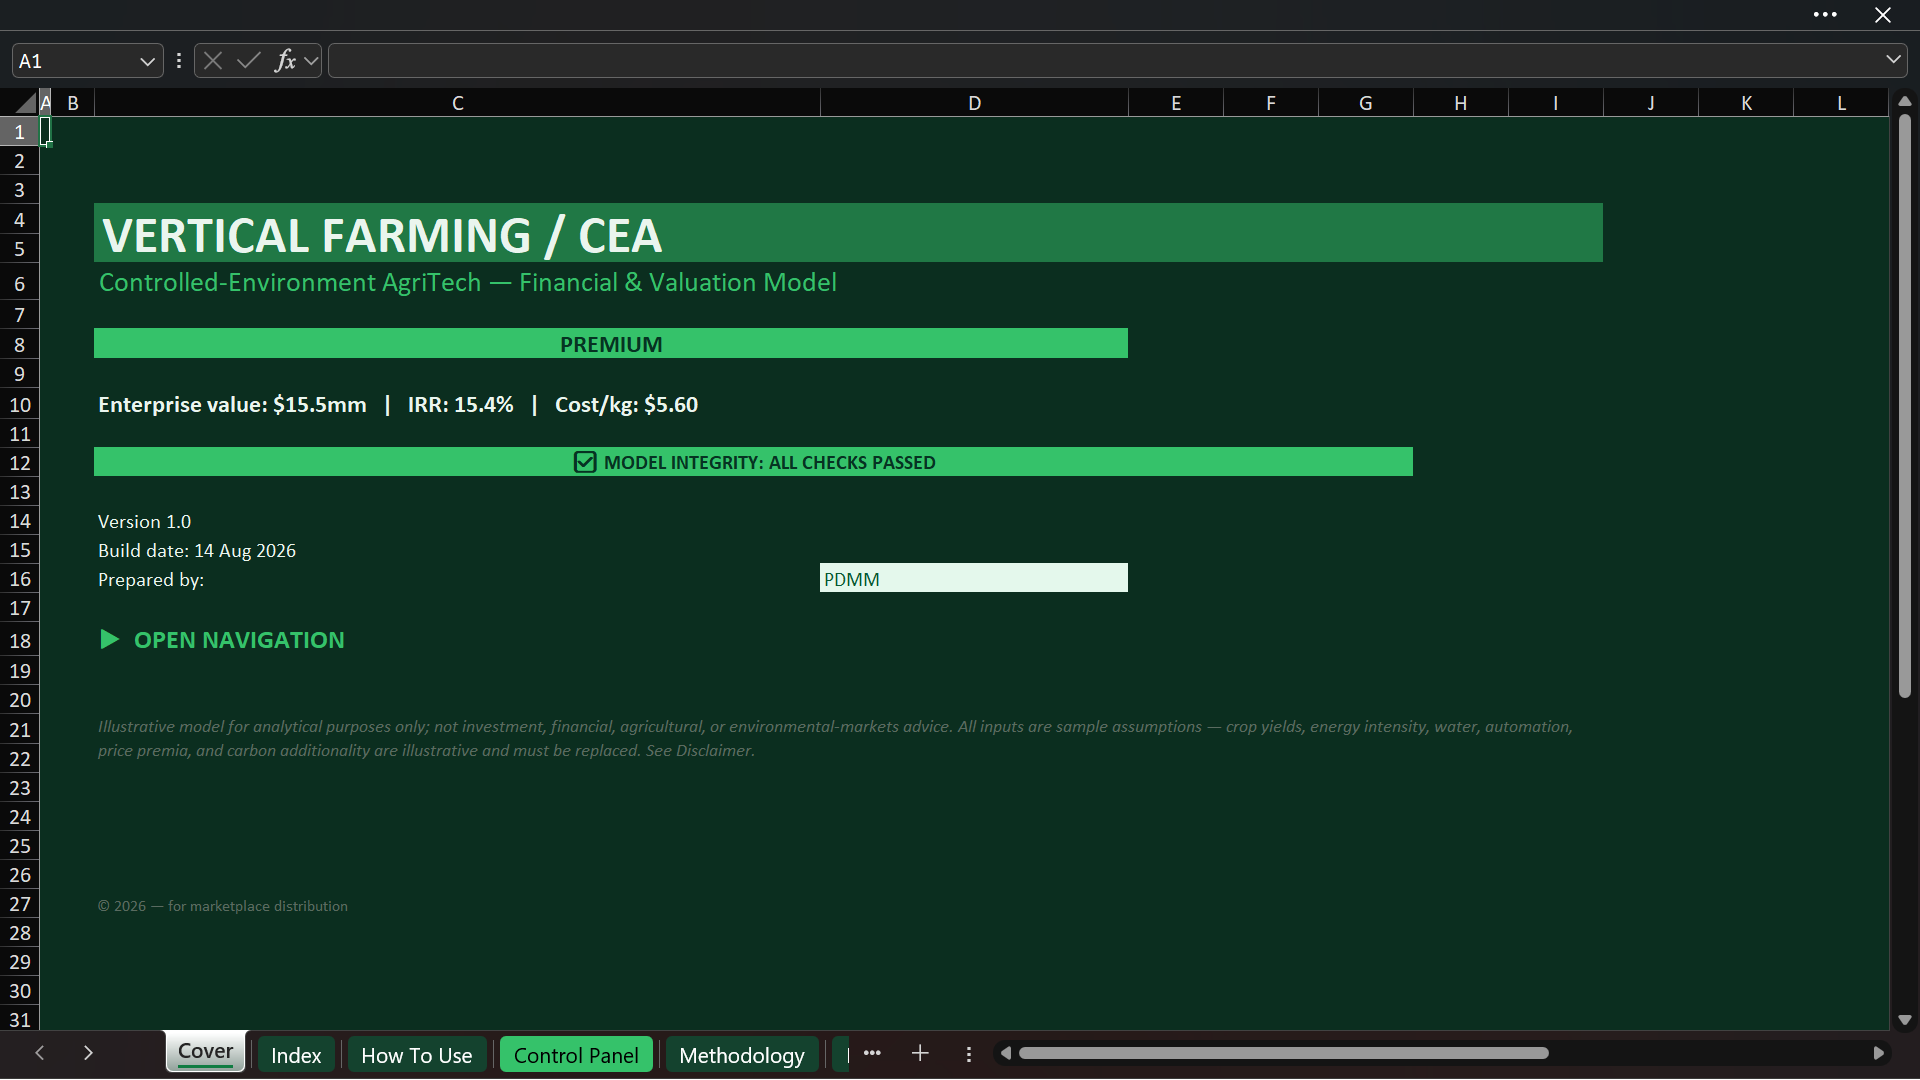
A formula-driven Audit sheet runs 22 checks covering canopy allocation, utilization, recirculation, canopy calculation, crop production, saleable output, water logic, revenue, COGS, gross profit, EBITDA, CapEx, unit cost, creditable emissions, energy cost per kilogram, enterprise value, IRR, discount factors, capacity ramp, grow-system selection, automation selection, and scenario selection. The supplied base case reads “ALL CHECKS PASSED.”
The file is a fully editable, macro-free Excel workbook. Formulas are visible, inputs are centralized, and key outputs are linked rather than pasted.

🛠️ HOW TO USE THE MODEL
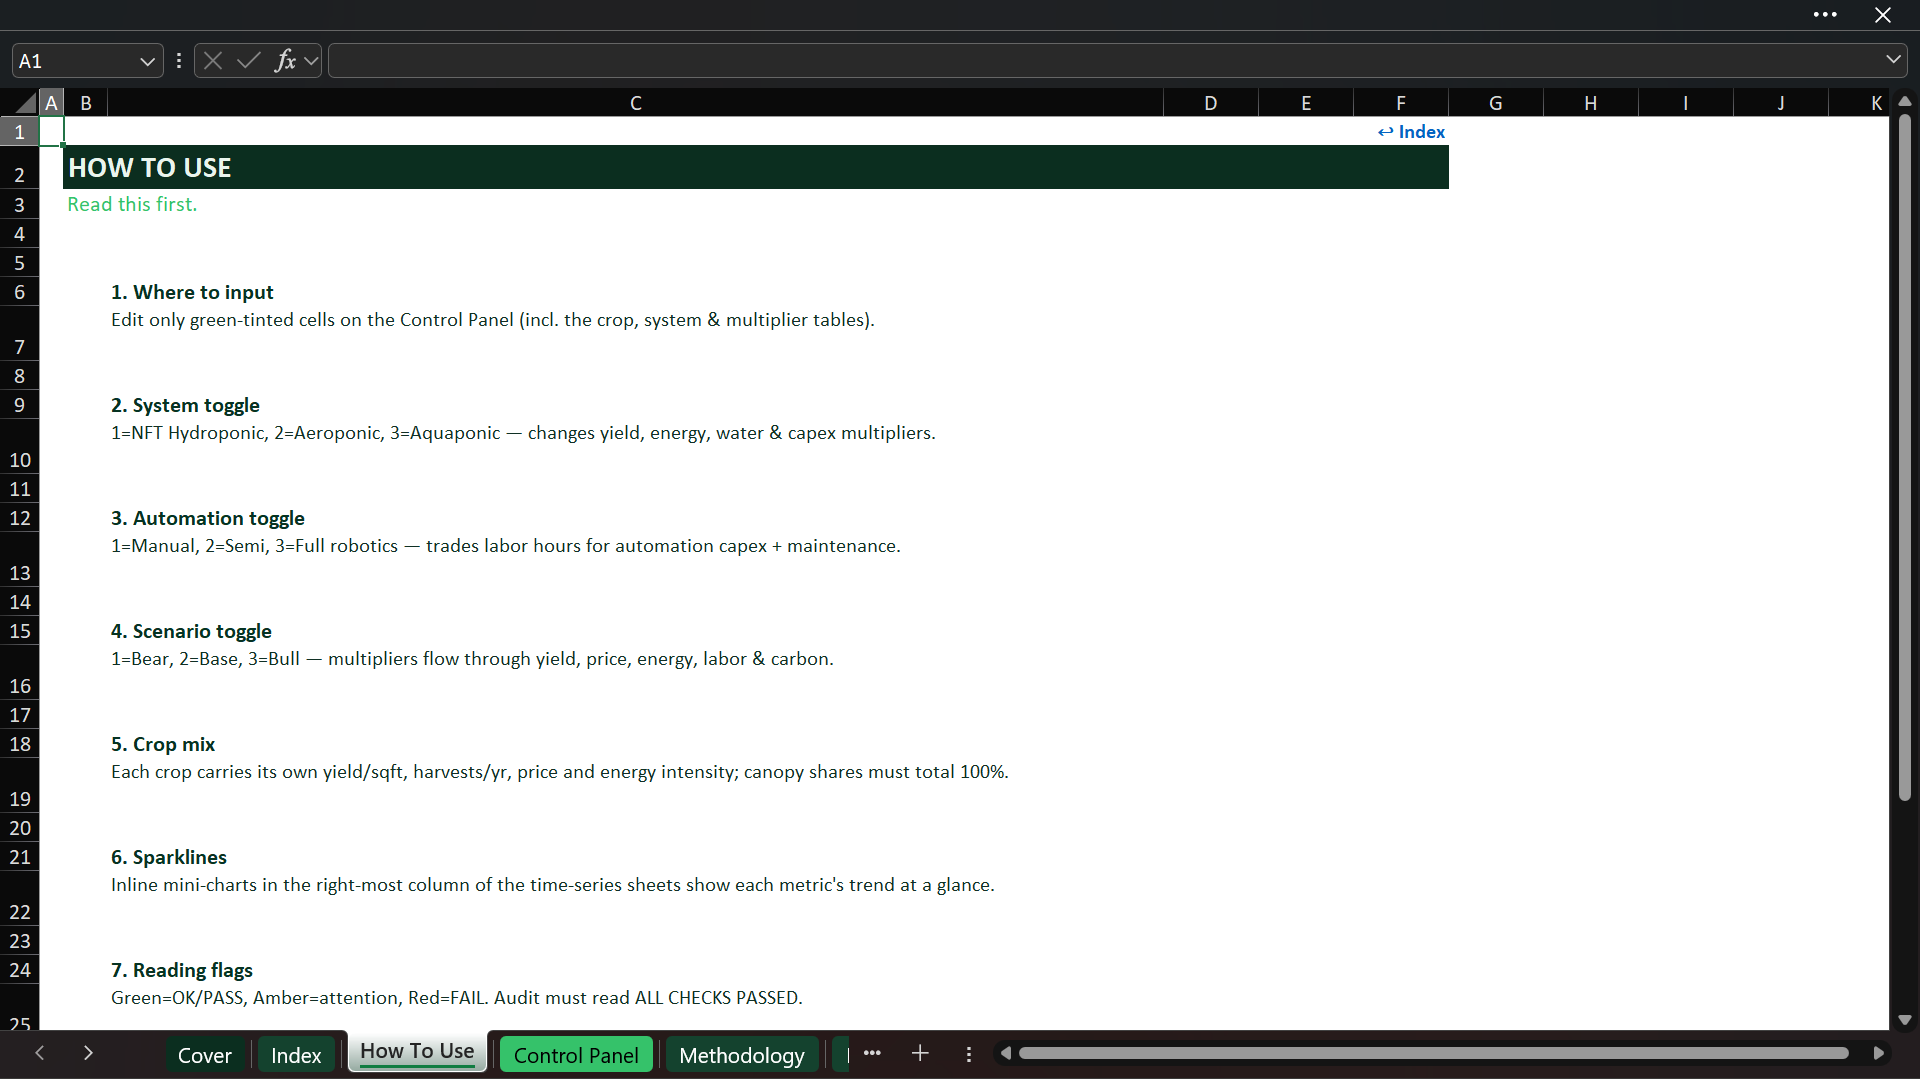
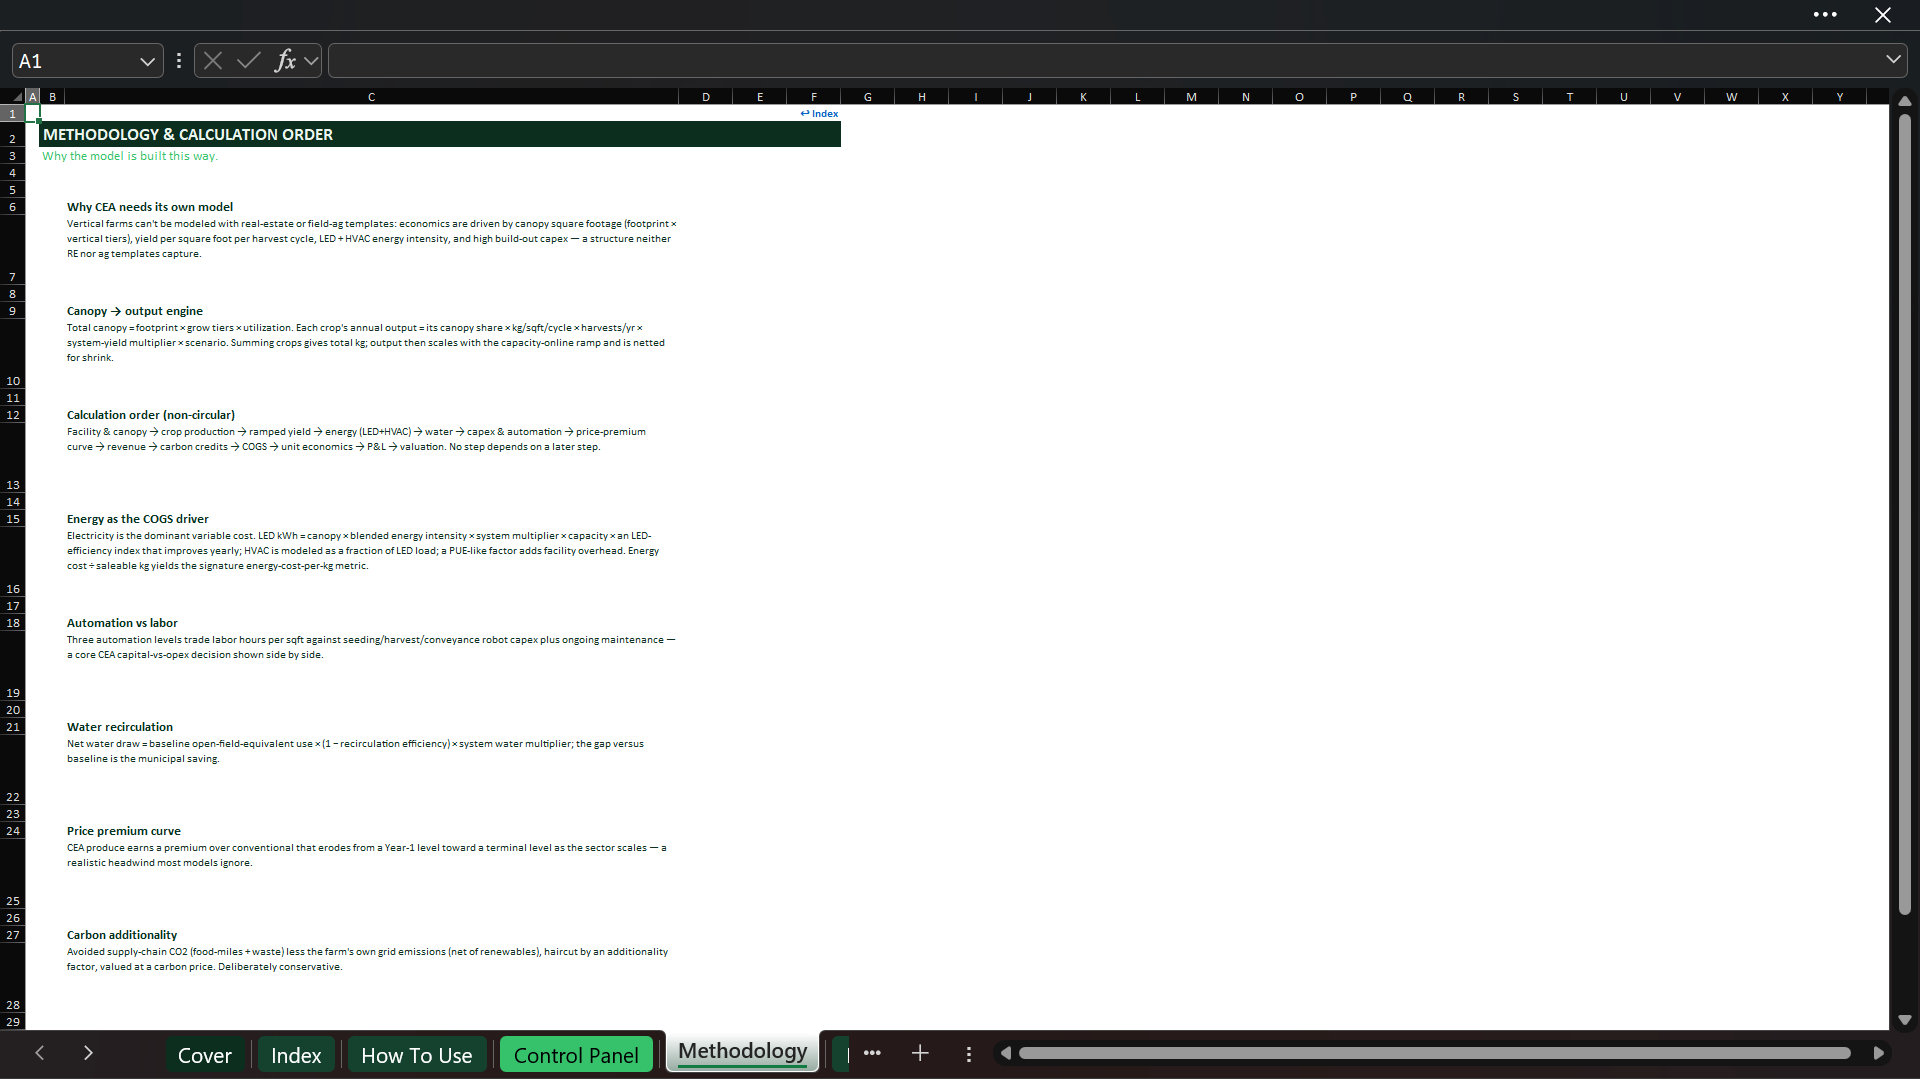
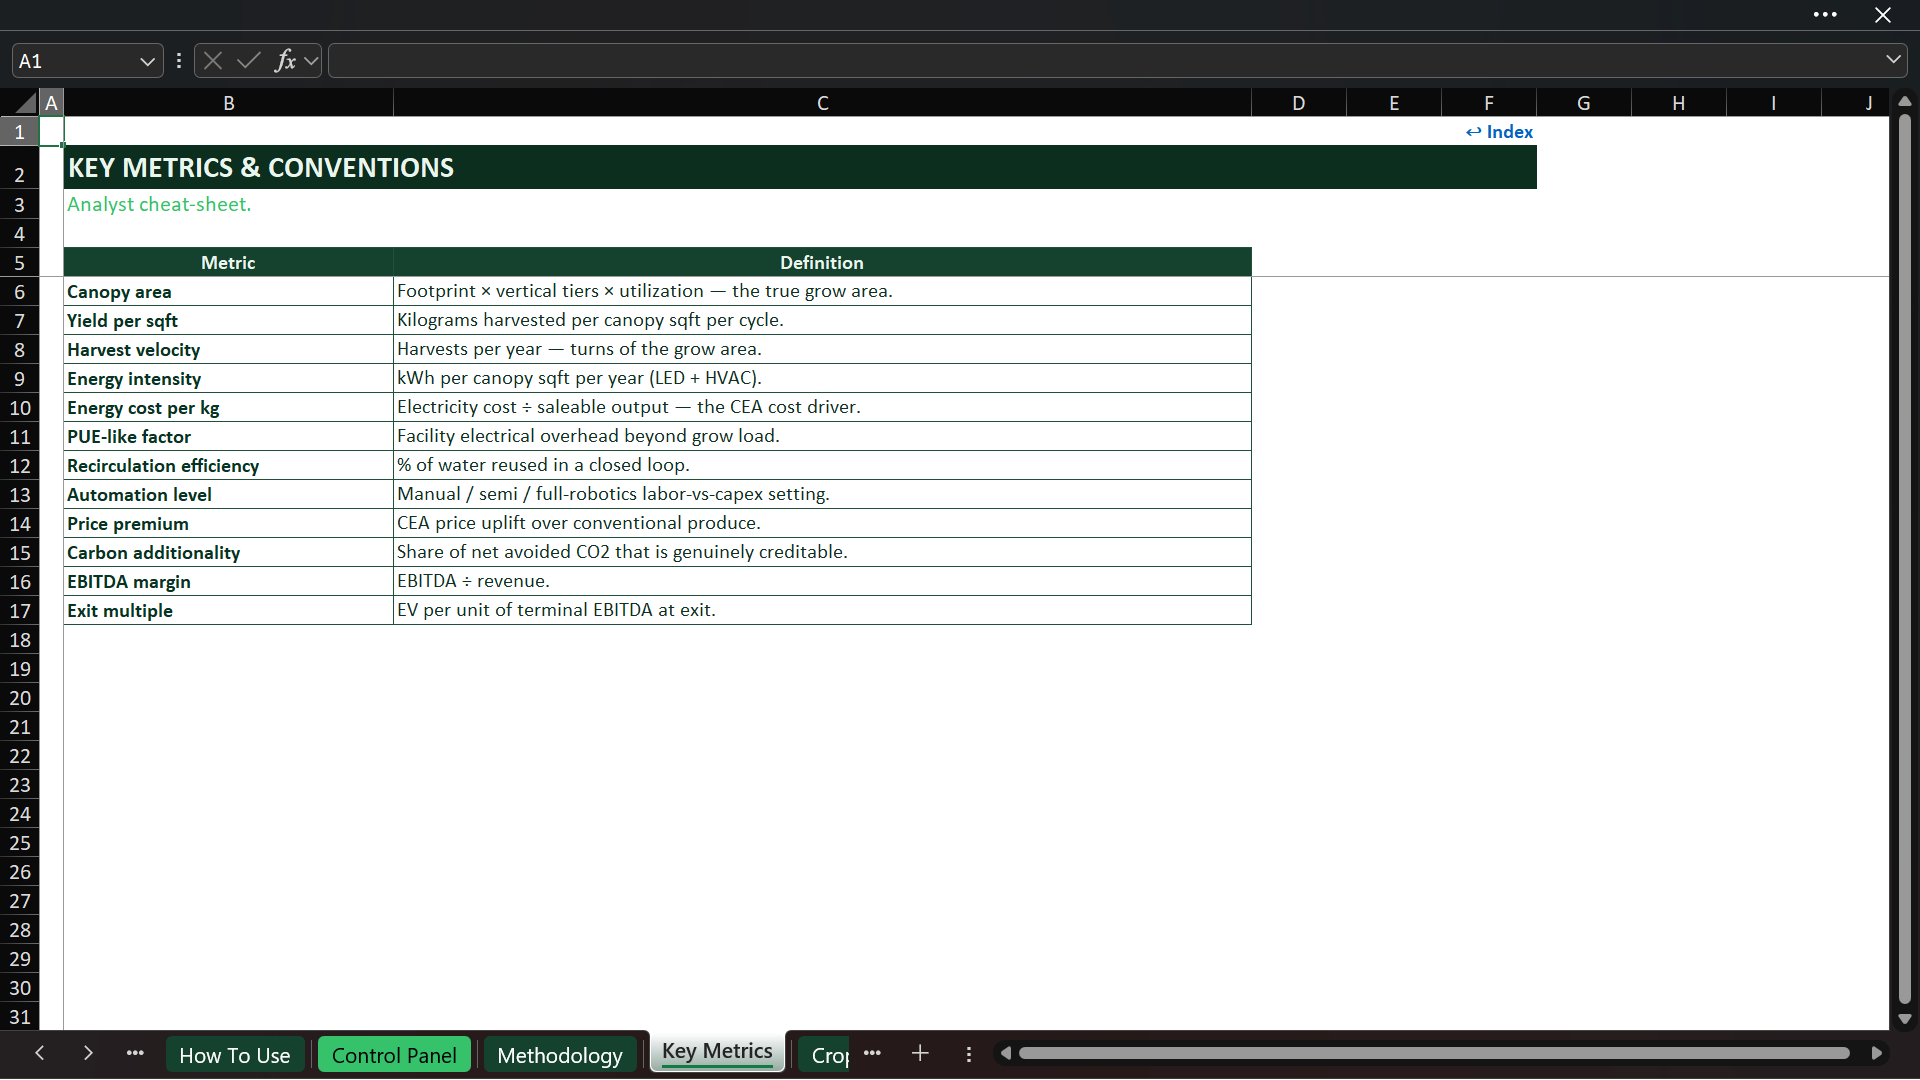
  1. Read the Cover, How to Use, Methodology, and Key Metrics sheets.
  2. Edit only the green-tinted cells on the Control Panel.
  3. Replace the example facility, crop, pricing, operating, utility, CapEx, tax, carbon, and valuation inputs with project-specific assumptions.
  4. Select the grow system, automation level, and Bear/Base/Bull scenario.
  5. Review crop production, yield, energy, water, automation, CapEx, pricing, revenue, carbon, COGS, unit economics, P&L, and valuation in sequence.
  6. Use the dashboards and sensitivity views to communicate the case and prioritize diligence.
  7. Confirm every validation flag is OK and the Audit sheet reads “ALL CHECKS PASSED.”

👥 WHO SHOULD USE THIS TEMPLATE?
• Vertical-farm and indoor-farm founders preparing a feasibility case.
• Existing CEA operators evaluating expansion, crop mix, or automation.
• Agritech investors and corporate-development teams screening opportunities.
• Consultants and analysts preparing client-ready operating and valuation work.
• Lenders or strategic partners performing preliminary commercial review.

This Best Practice includes
1 Fully Editable Premium Excel Model

Acquire business license for $80.00

Add to cart

Add to bookmarks

Discuss

Further information

Translate building footprint, grow tiers, and utilization into productive canopy area.
Forecast full-capacity and ramped saleable output for an editable multi-crop portfolio.
Compare NFT hydroponic, aeroponic, and aquaponic operating configurations.
Quantify LED, HVAC, facility-overhead, water, nutrient, labor, automation, packaging, and distribution costs.
Evaluate the trade-off between manual labor and capital-intensive robotics.
Build a component-based estimate of initial and sustaining capital requirements.
Test commercial pricing and the erosion of CEA premiums over time.
Evaluate optional carbon-credit economics using explicit emissions and additionality assumptions.
Calculate cost per kilogram, gross margin, EBITDA, net income, annual cash flow, NPV, enterprise value, project IRR, payback status, and funding need.
Compare Bear, Base, and Bull outcomes and identify the drivers with the greatest potential effect on value.
Present results through executive and operating dashboards suitable for early-stage decision discussions.

You are developing or evaluating a vertical farm, indoor farm, or CEA facility.
You need an initial feasibility case that links technical design to unit economics and valuation.
You want to compare crop allocations, yield assumptions, harvest frequency, pricing, and energy intensity.
You need to compare hydroponic, aeroponic, or aquaponic settings using editable operating multipliers.
You are deciding between manual, semi-automated, and full-robotics operating strategies.
You need a 10-year annual forecast for management, investors, lenders, strategic partners, or consultants.
You want a transparent unlevered project view with NPV, enterprise value, IRR, payback status, and peak funding need.
You need dashboards, scenarios, sensitivity views, and audit controls in one editable Excel workbook.
You have site-specific assumptions that can replace the illustrative starting inputs.

You need daily or weekly crop scheduling, harvest planning, inventory control, or farm-management software.
You need monthly bookkeeping, accounts payable, accounts receivable, payroll processing, or tax filing.
You require a complete three-statement model with a balance sheet and working-capital schedules.
You require debt tranches, interest calculations, financing covenants, cash sweeps, or an investor distribution waterfall.
You need a construction schedule, procurement bill of materials, engineering design, or vendor-ready cost estimate.
You need certified agronomic yields, equipment specifications, energy performance, or water-use guarantees.
You need a carbon registry eligibility opinion, verified emissions calculation, or guaranteed carbon-credit issuance.
You are modeling conventional open-field agriculture or a greenhouse without adapting the CEA-specific drivers.
You require fully dynamic Excel data-table sensitivities that recalculate the full operating model for every grid point; the included grids are illustrative value-scaling views.
You plan to rely on the included sample assumptions without validating them against project-specific evidence.


0.0 / 5 (0 votes)

please wait...