
Originally published: 23/03/2023 10:39
Publication number: ELQ-33360-1
View all versions & Certificate
Publication number: ELQ-33360-1
View all versions & Certificate

MACD Indicator Google Sheets Template – Technical Analysis
Get MACD Indicator in Google Sheets for stock analysis.
macd technical indicatorstock market templategoogle sheet templatestock market analysisfree stock market template
Description
What is MACD indicator?
MACD is used by a lot of traders, since it captures multiple aspects of stock performance. It not only helps identify trends, but it can also measure momentum. This technical indicator involves a lot more components.
How to calculate MACD?
i. First, we calculate two different Moving Averages (one fast and one slow). Then, we take the difference in values between those two Moving Averages and that is called the MACD Line.
ii. We then calculate an EMA of the MACD line and that is called Signal line. Signal line is thus an indicator of an indicator.
iii. Finally, we calculate difference between MACD and Signal line and display as a MACD histogram which oscillates above and below zero.
Three different elements are shown on the chart typically when you view MACD indicator.
a. MACD Line = (12-day EMA – 26-day EMA)
b. Signal Line = 9-day EMA of MACD Line
c. MACD Histogram = MACD Line – Signal Line
The MACD histogram values are plotted as red and green bars. A bar is green when the MACD histogram value is greater than 0. A red bar indicates that its value is lesser than 0.
A general interpretation of MACD is that when MACD is positive and the histogram value is increasing, then upside momentum is increasing. When MACD is negative and the histogram value is decreasing, then downside momentum is increasing.
Trading Signals
Some key signals observed using the MACD indicator are below.
1. Bullish Signal Line Crossovers occur when MACD Line crosses above Signal Line.
2. Bearish Signal Line Crossovers occur when MACD Line crosses below Signal Line.
3. Bullish Zero Line Crossovers occur when MACD Line crosses above the Zero Line and go from negative to positive.
4. Bearish Zero Line Crossovers occur when MACD Line crosses below the Zero Line and go from positive to negative.
MACD Google Sheet Template
The template will help you create the MACD indicator automatically and also calculate the trading signals instantly for any stock.
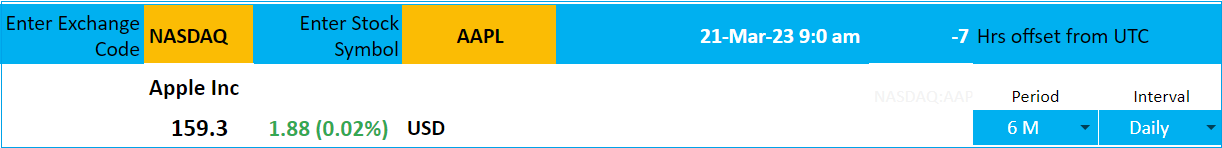
Type in a stock sticker symbol along with the exchange code on the top left.
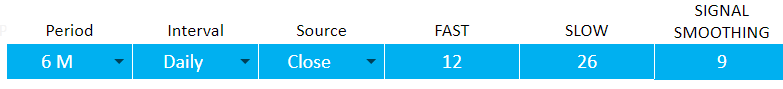
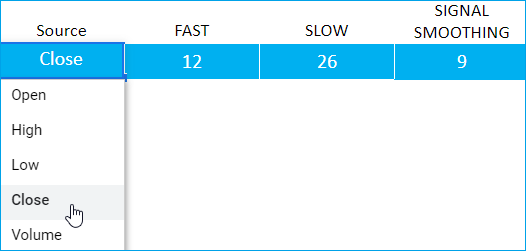
Enter the required period and interval along with the input parameters:
1. Source: Closing price is the one that is used for calculations typically. However, you can choose from Open, High, Low, Close or Volume.
2. Fast EMA Length: You can type in a length in periods. The commonly used is 12.
3. Slow EMA Length: You can type in a length in periods. The commonly used is 26.
4. Signal Smoothing: You can type in a length in periods. The commonly used is 9.
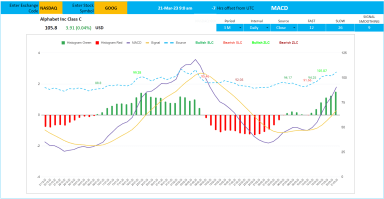
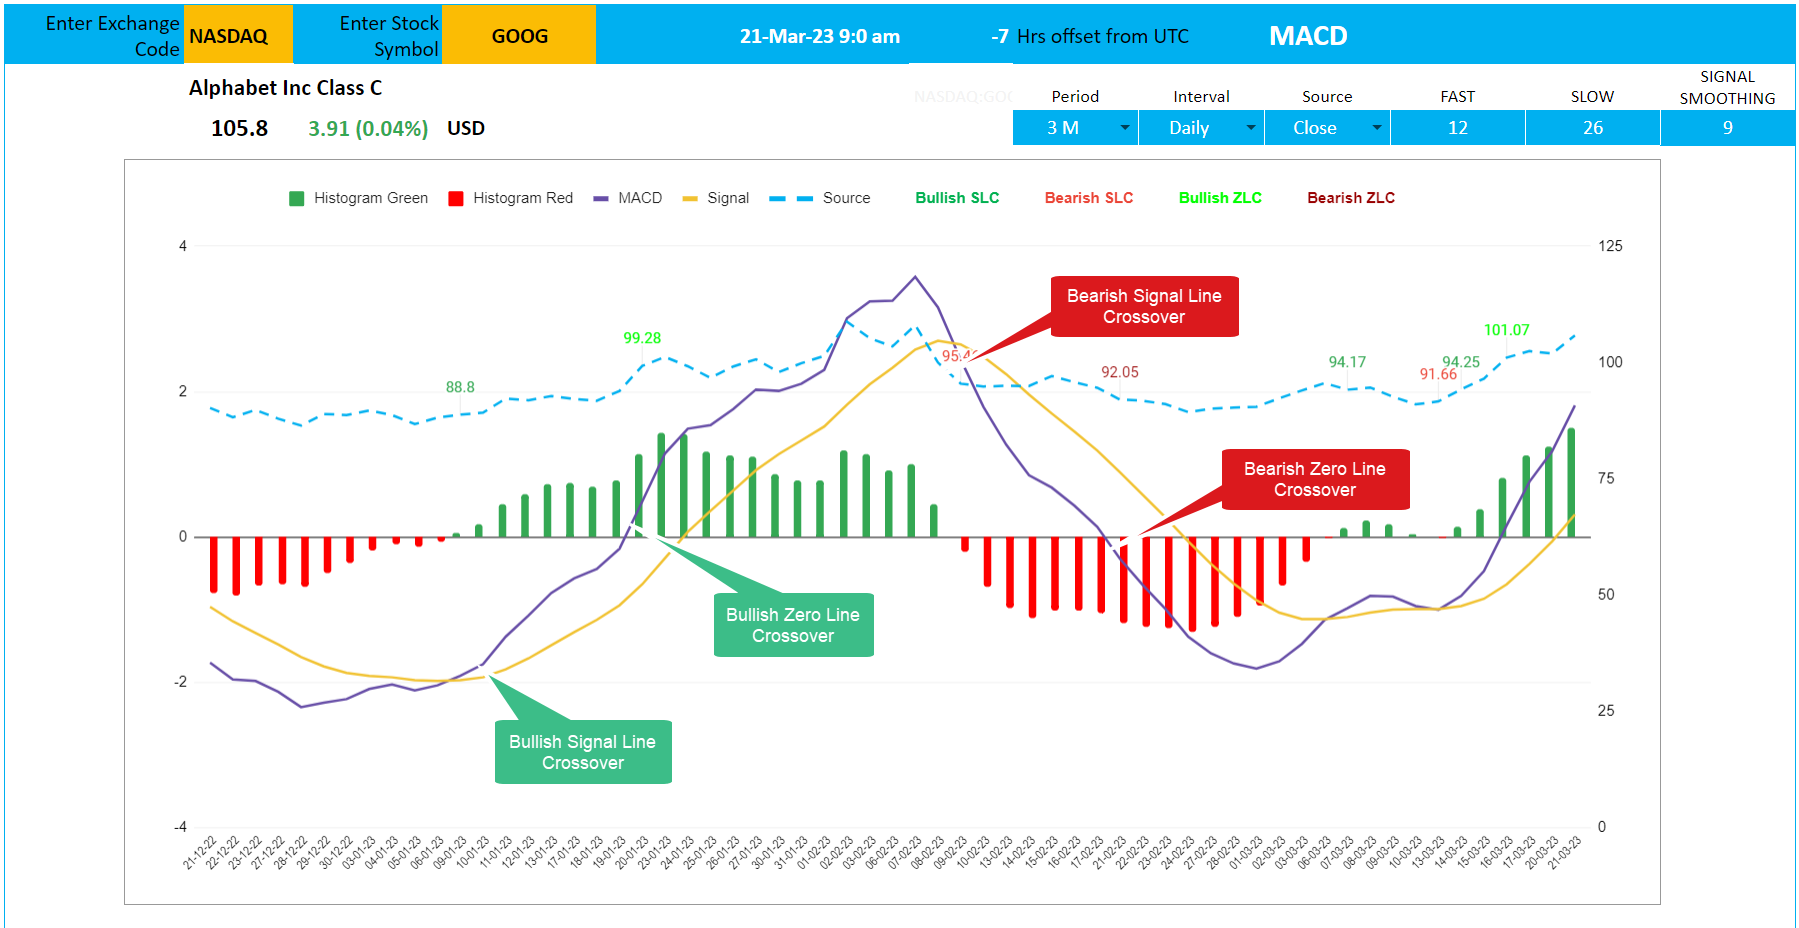
Once the required input are given the google sheets generates a MACD Indicator charts with signals:
The template shows two types of signals (Signal Line Crossovers, Zero Line Crossovers) on the chart.
What is MACD indicator?
MACD is used by a lot of traders, since it captures multiple aspects of stock performance. It not only helps identify trends, but it can also measure momentum. This technical indicator involves a lot more components.
How to calculate MACD?
i. First, we calculate two different Moving Averages (one fast and one slow). Then, we take the difference in values between those two Moving Averages and that is called the MACD Line.
ii. We then calculate an EMA of the MACD line and that is called Signal line. Signal line is thus an indicator of an indicator.
iii. Finally, we calculate difference between MACD and Signal line and display as a MACD histogram which oscillates above and below zero.
Three different elements are shown on the chart typically when you view MACD indicator.
a. MACD Line = (12-day EMA – 26-day EMA)
b. Signal Line = 9-day EMA of MACD Line
c. MACD Histogram = MACD Line – Signal Line
The MACD histogram values are plotted as red and green bars. A bar is green when the MACD histogram value is greater than 0. A red bar indicates that its value is lesser than 0.
A general interpretation of MACD is that when MACD is positive and the histogram value is increasing, then upside momentum is increasing. When MACD is negative and the histogram value is decreasing, then downside momentum is increasing.
Trading Signals
Some key signals observed using the MACD indicator are below.
1. Bullish Signal Line Crossovers occur when MACD Line crosses above Signal Line.
2. Bearish Signal Line Crossovers occur when MACD Line crosses below Signal Line.
3. Bullish Zero Line Crossovers occur when MACD Line crosses above the Zero Line and go from negative to positive.
4. Bearish Zero Line Crossovers occur when MACD Line crosses below the Zero Line and go from positive to negative.
MACD Google Sheet Template
The template will help you create the MACD indicator automatically and also calculate the trading signals instantly for any stock.
Type in a stock sticker symbol along with the exchange code on the top left.
Enter the required period and interval along with the input parameters:
1. Source: Closing price is the one that is used for calculations typically. However, you can choose from Open, High, Low, Close or Volume.
2. Fast EMA Length: You can type in a length in periods. The commonly used is 12.
3. Slow EMA Length: You can type in a length in periods. The commonly used is 26.
4. Signal Smoothing: You can type in a length in periods. The commonly used is 9.
Once the required input are given the google sheets generates a MACD Indicator charts with signals:
The template shows two types of signals (Signal Line Crossovers, Zero Line Crossovers) on the chart.
This Best Practice includes
1 PDF File with link to download your copy of the Google Sheet Template
