Originally published: 11/02/2022 13:57
Publication number: ELQ-47076-1
View all versions & Certificate
Publication number: ELQ-47076-1
View all versions & Certificate

Care Center Financial Model
Start Up Care Center Financial Model consists of a financial model in excel for the opening of a new care center.
Further information
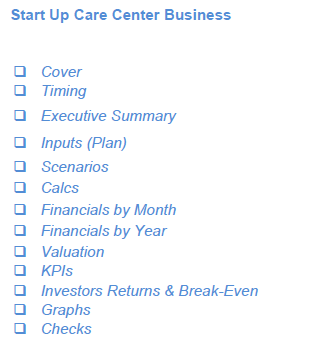
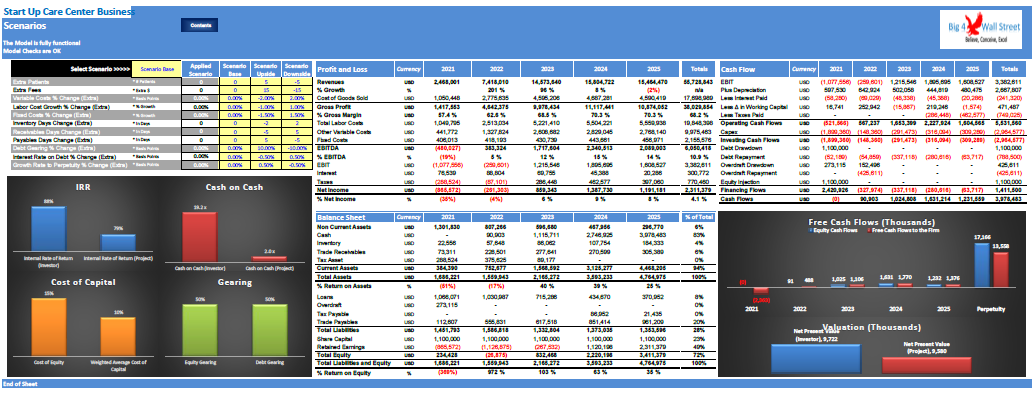
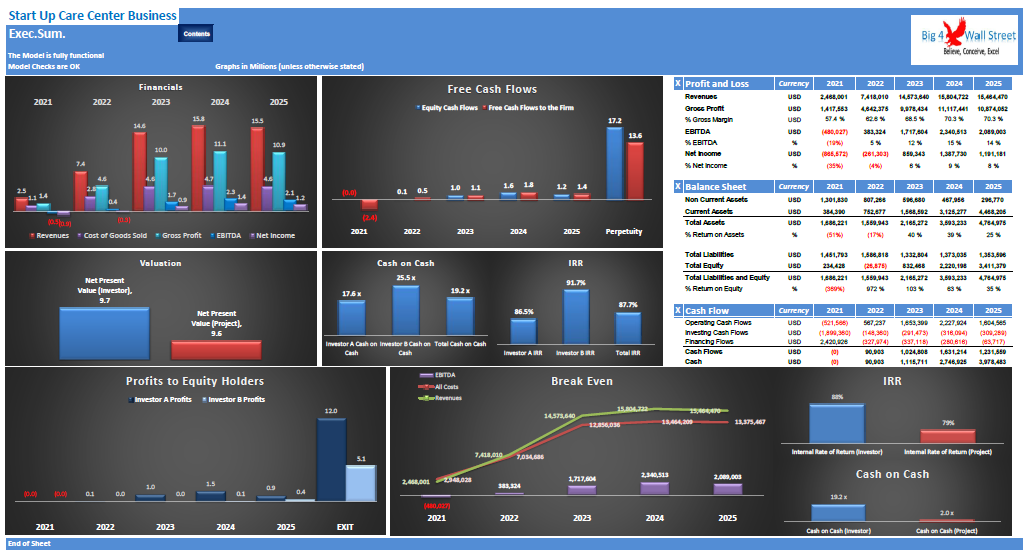
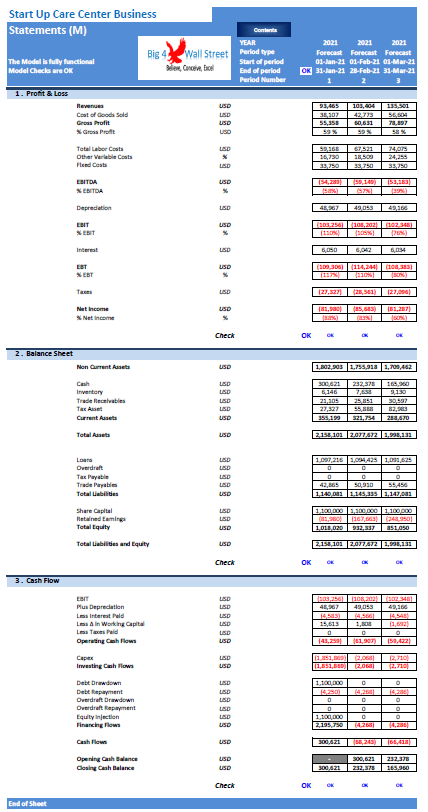
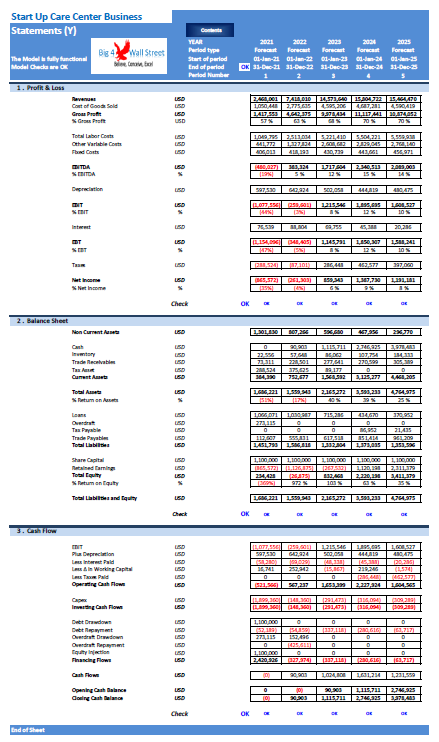
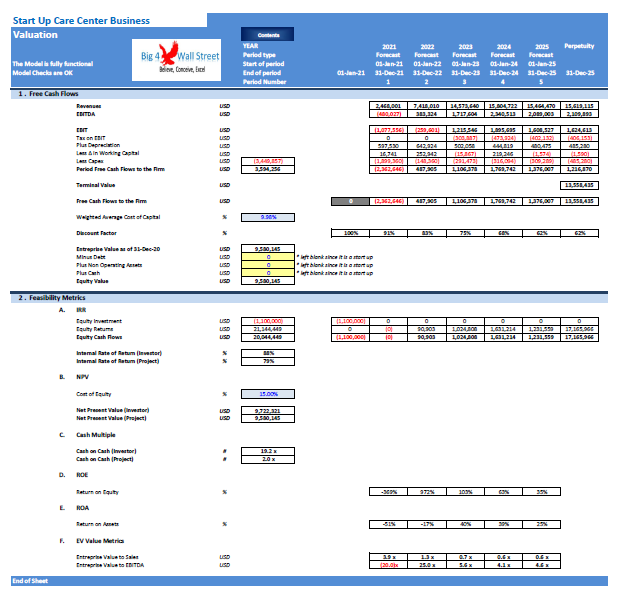
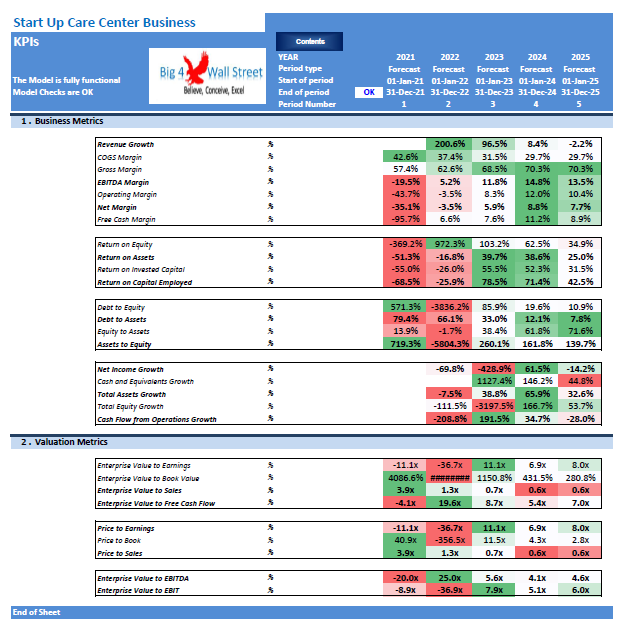
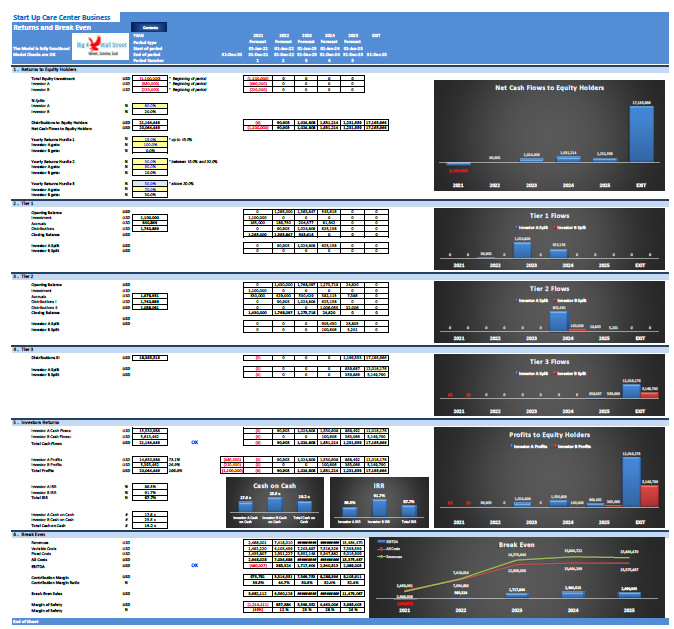
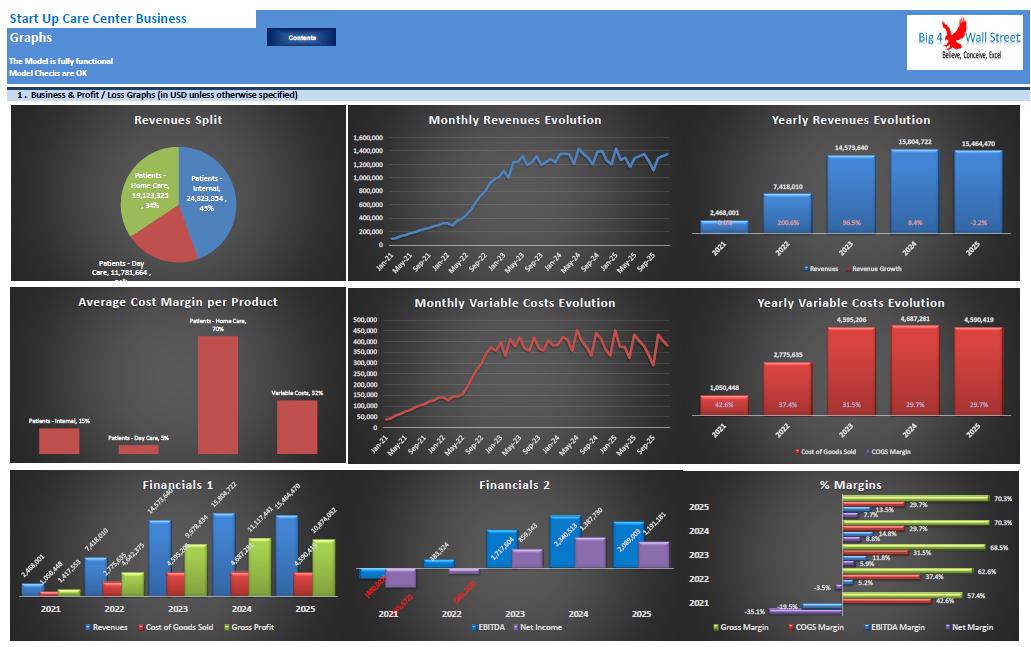
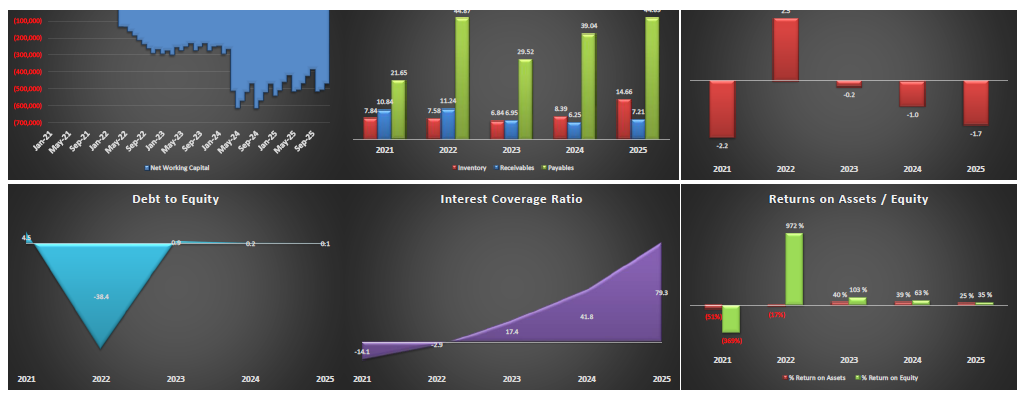
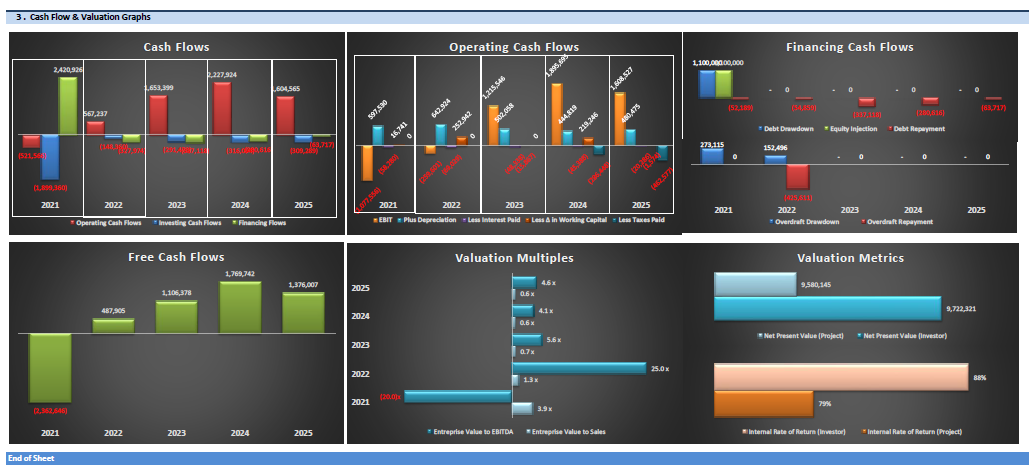
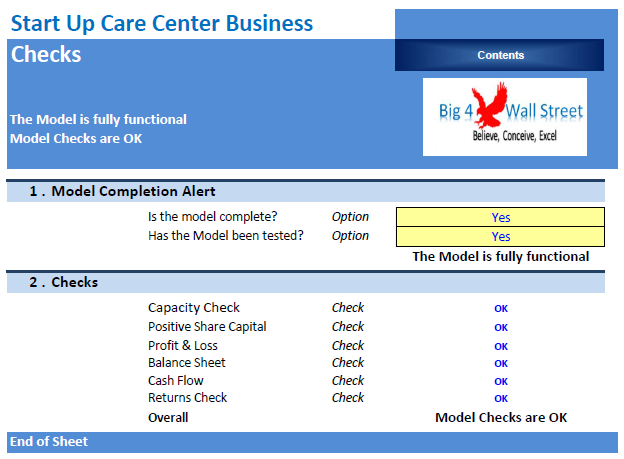
The model generates the three financial statements (profit & loss, balance sheet and cash flow), a valuation, returns per investor based on hurdle rates, various charts, a breakeven analysis and a series of margins, ratios, and feasibility metrics. Additionally, the user can set three scenarios to stress test the plan in the "Scenarios" tab. All the above is summarized in the "Executive Summary" tab which aggregates the most important metrics of the model.
For a care center, can be a senior care center, general care center, day care center, etc
