
Originally published: 13/04/2022 15:02
Publication number: ELQ-76604-1
View all versions & Certificate
Publication number: ELQ-76604-1
View all versions & Certificate

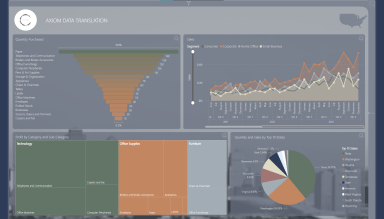
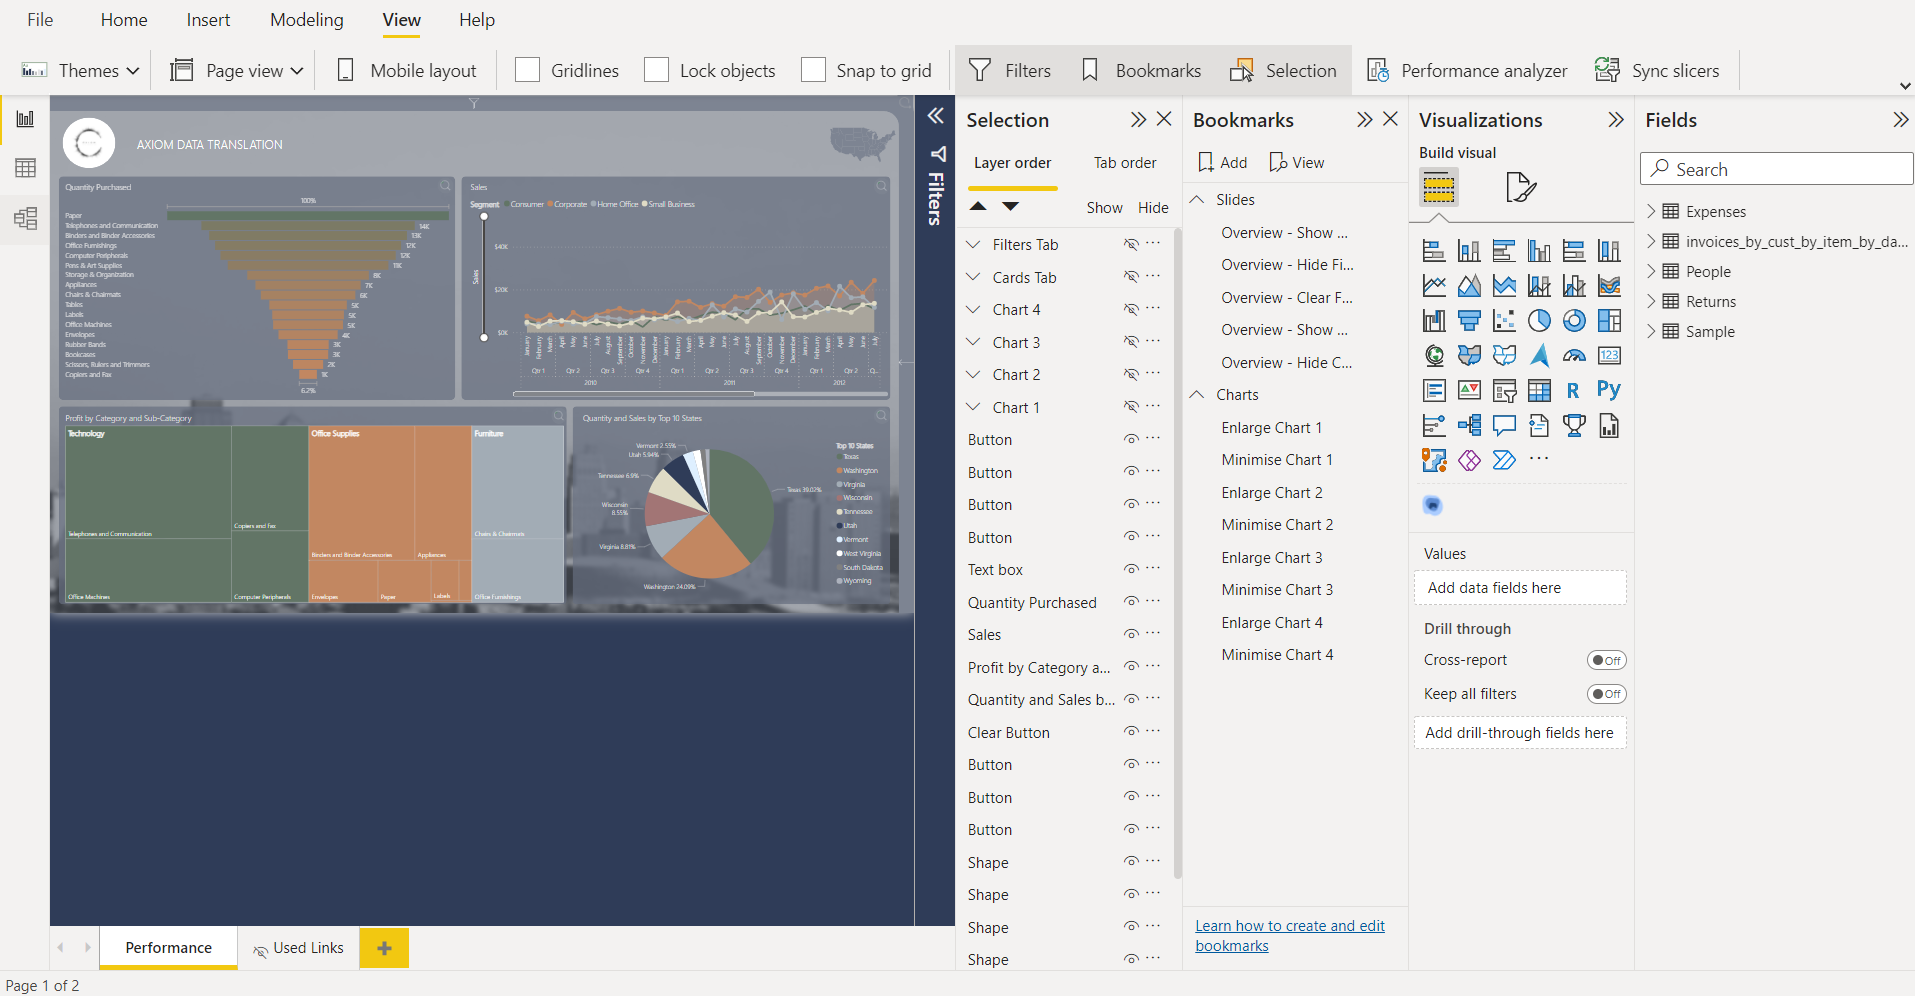
Sales Performance Analytical Dashboard - POWER BI
Highly Interactive Sales Performance Analytical Dashboard - POWER BI
