
Last version published: 26/08/2025 16:34
Publication number: ELQ-68918-17
View all versions & Certificate

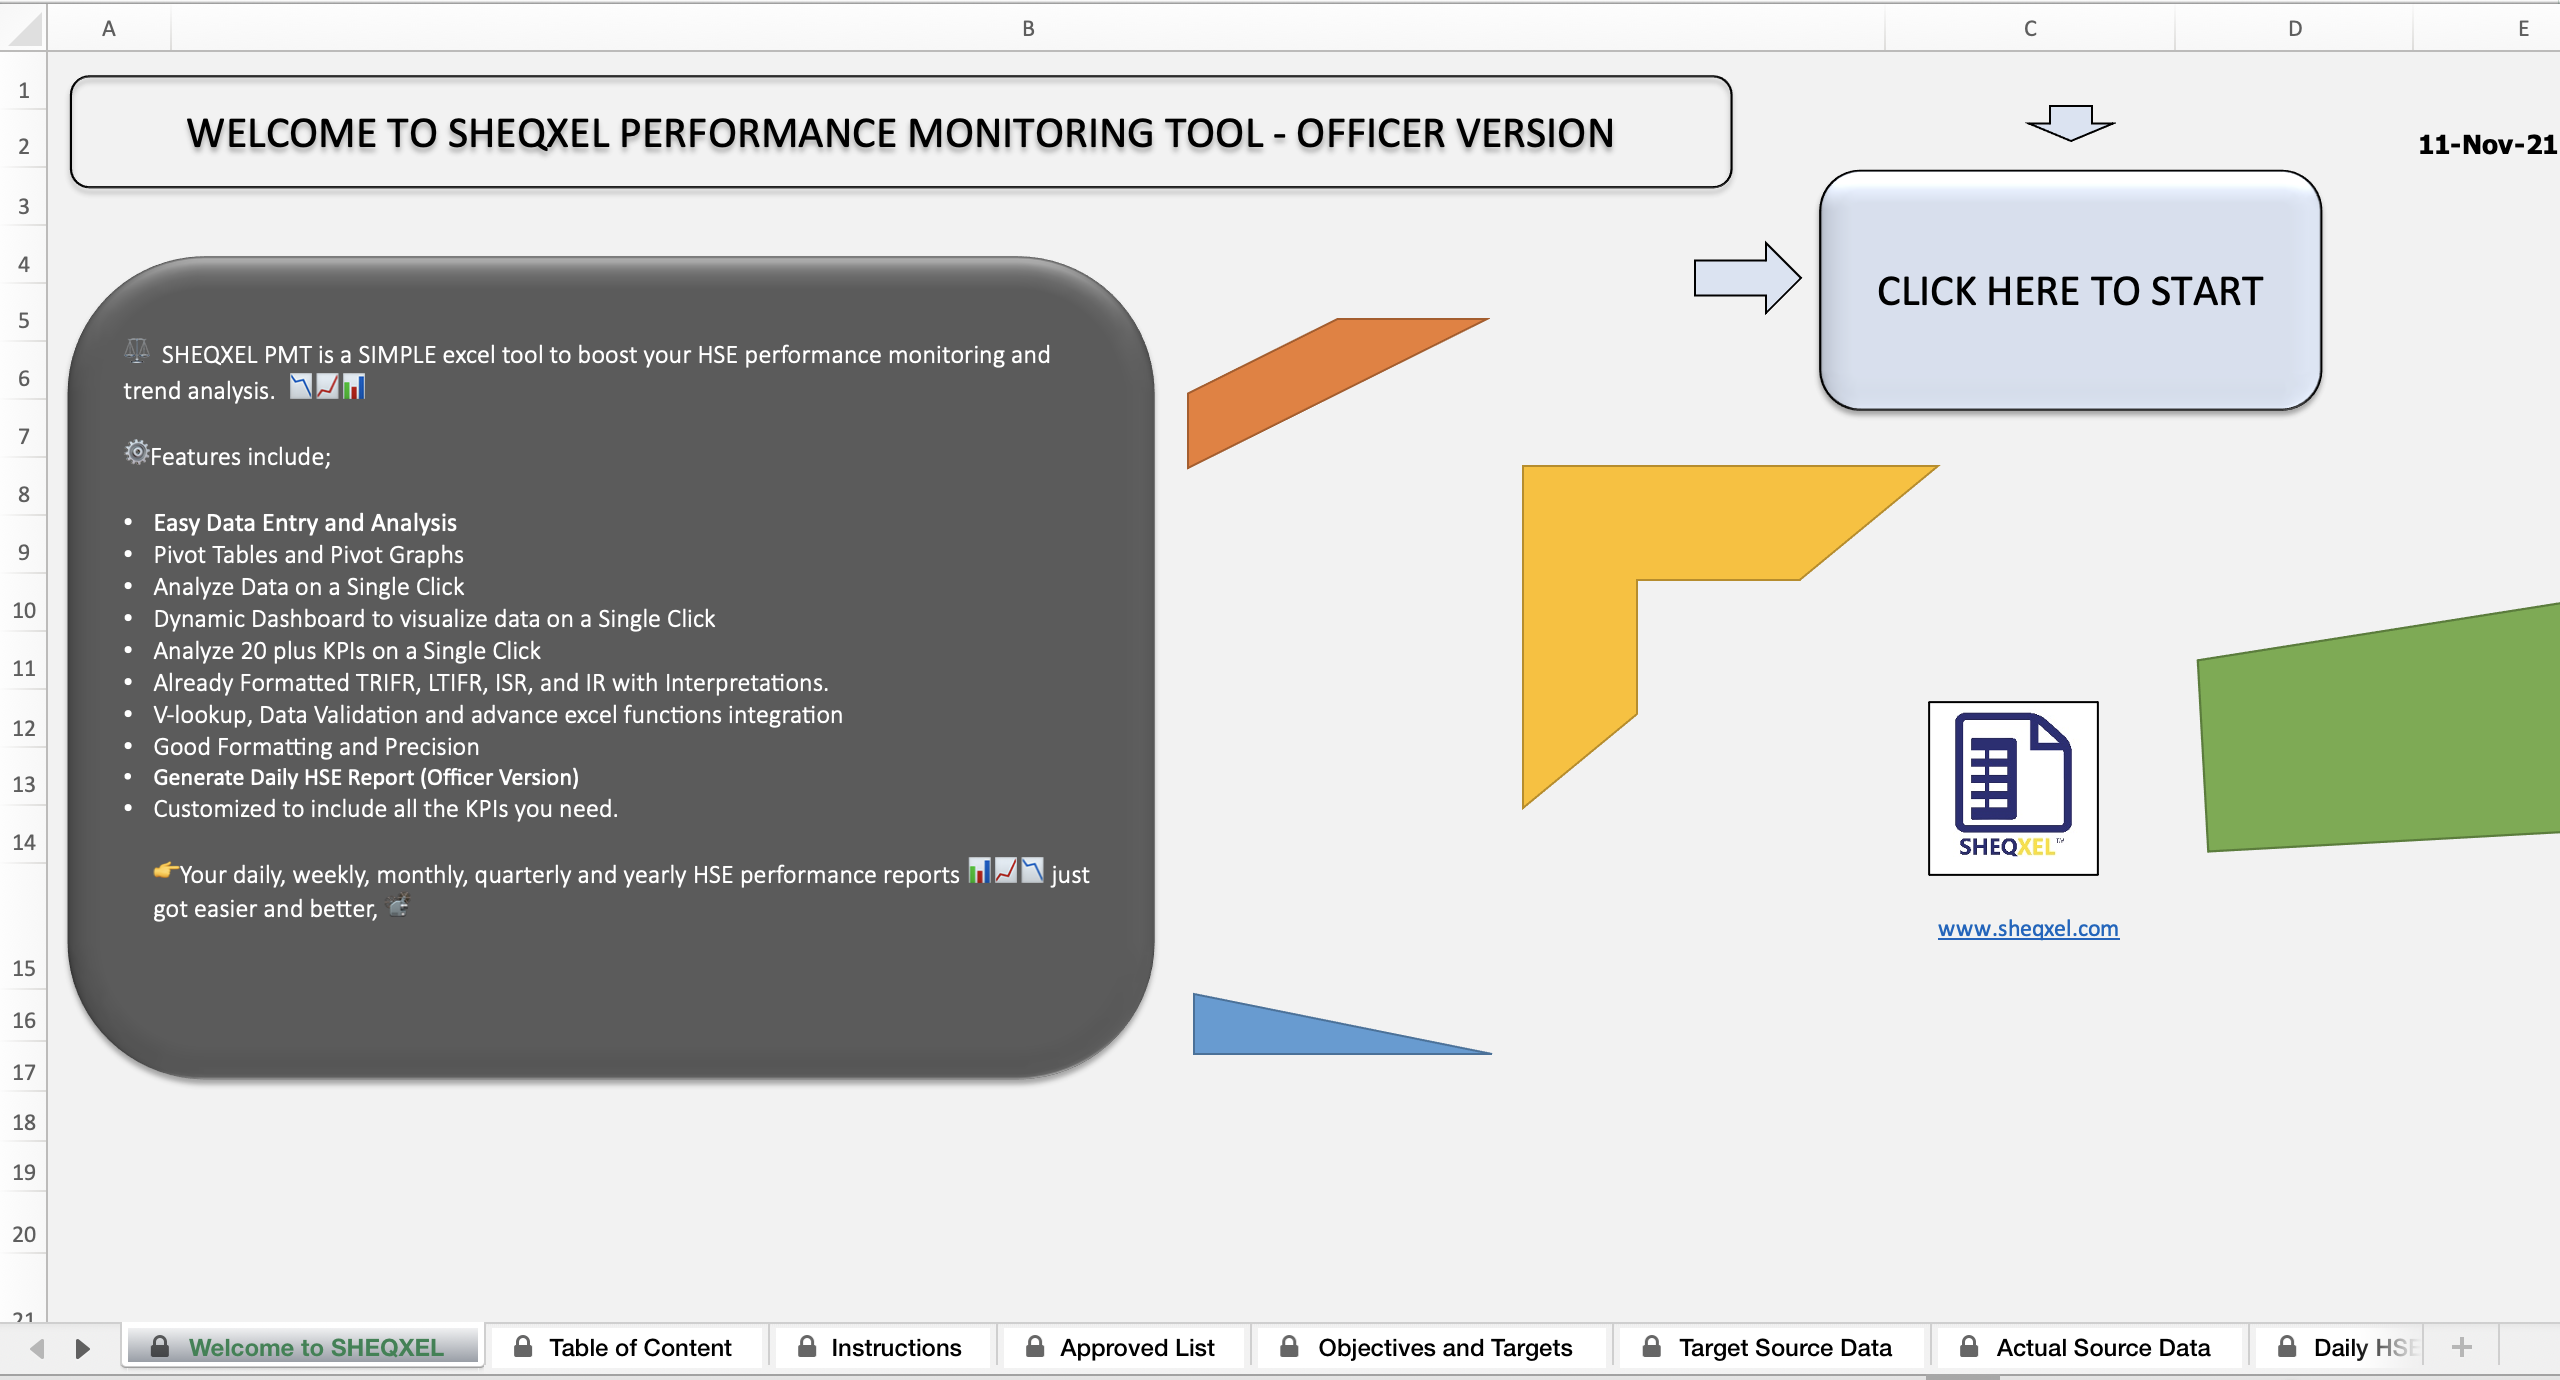
HSE Performance Monitoring Tool - Officer Version
This tool is designed to generate HSE performance reports based on daily data entries.
This tool is designed to build an HSE (Health, Safety and Environment) database and analyze over 40 leading indicators and 10 lagging indicators to generate HSE performance reports.
It has five main features:
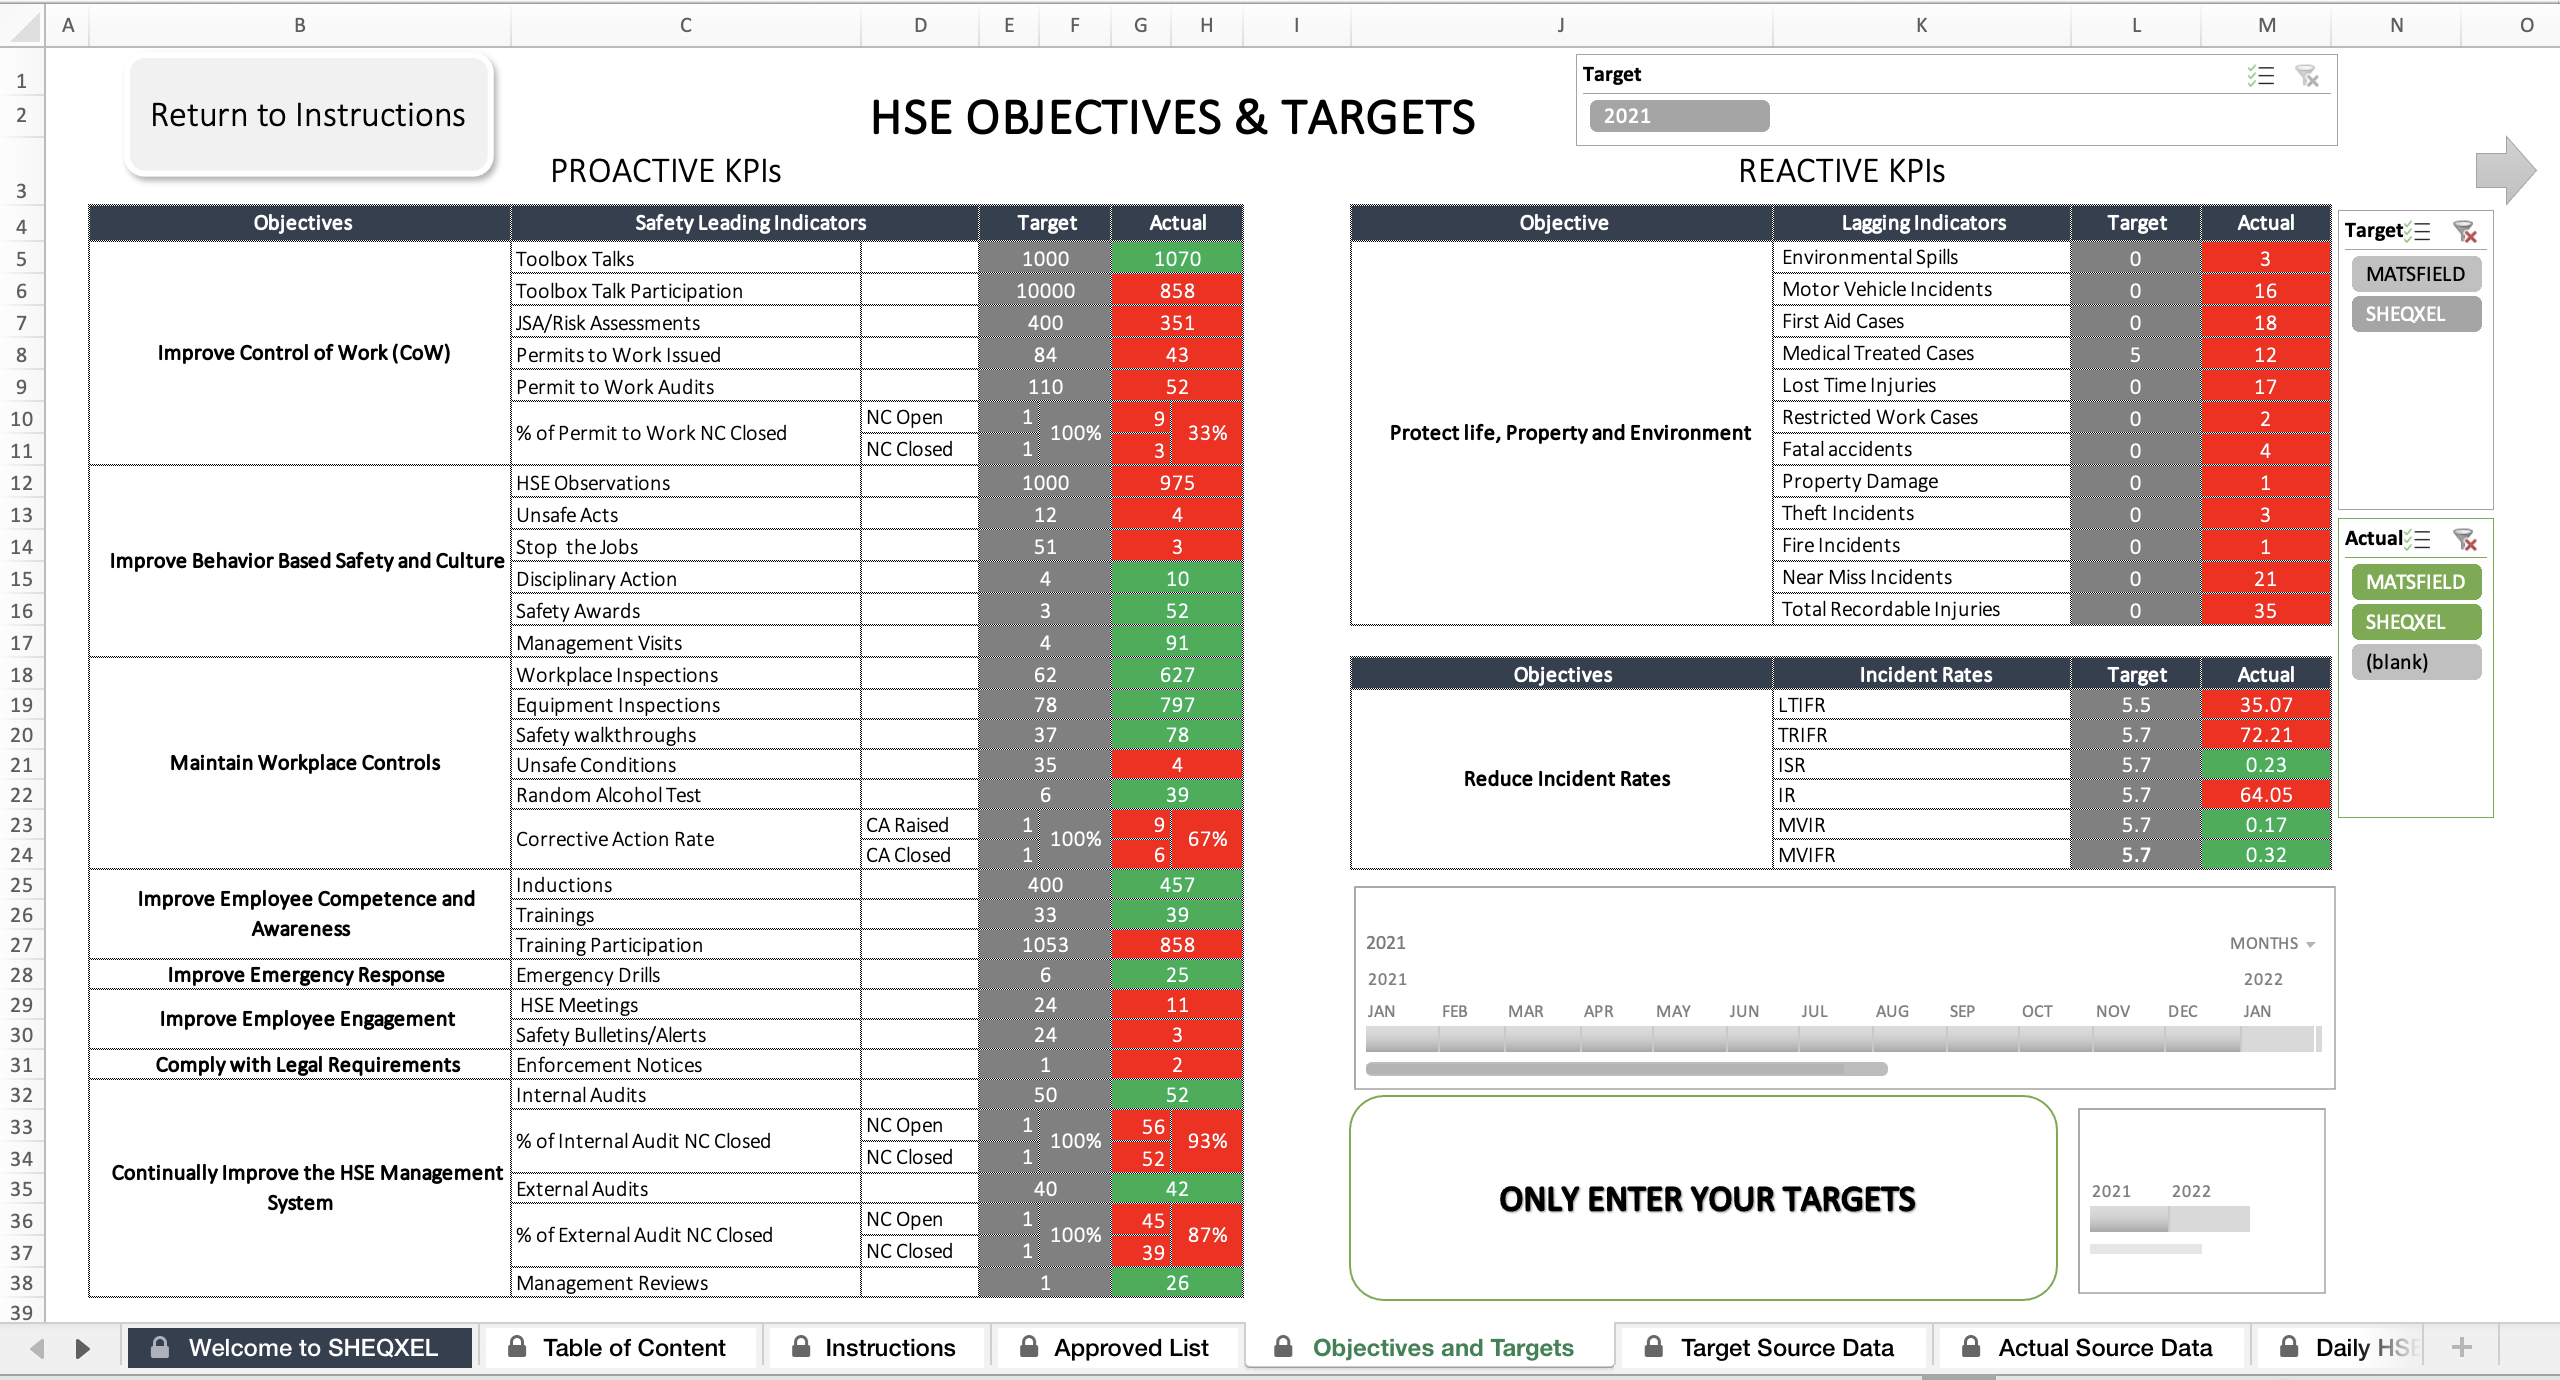
HSE Objectives and Targets Sheet
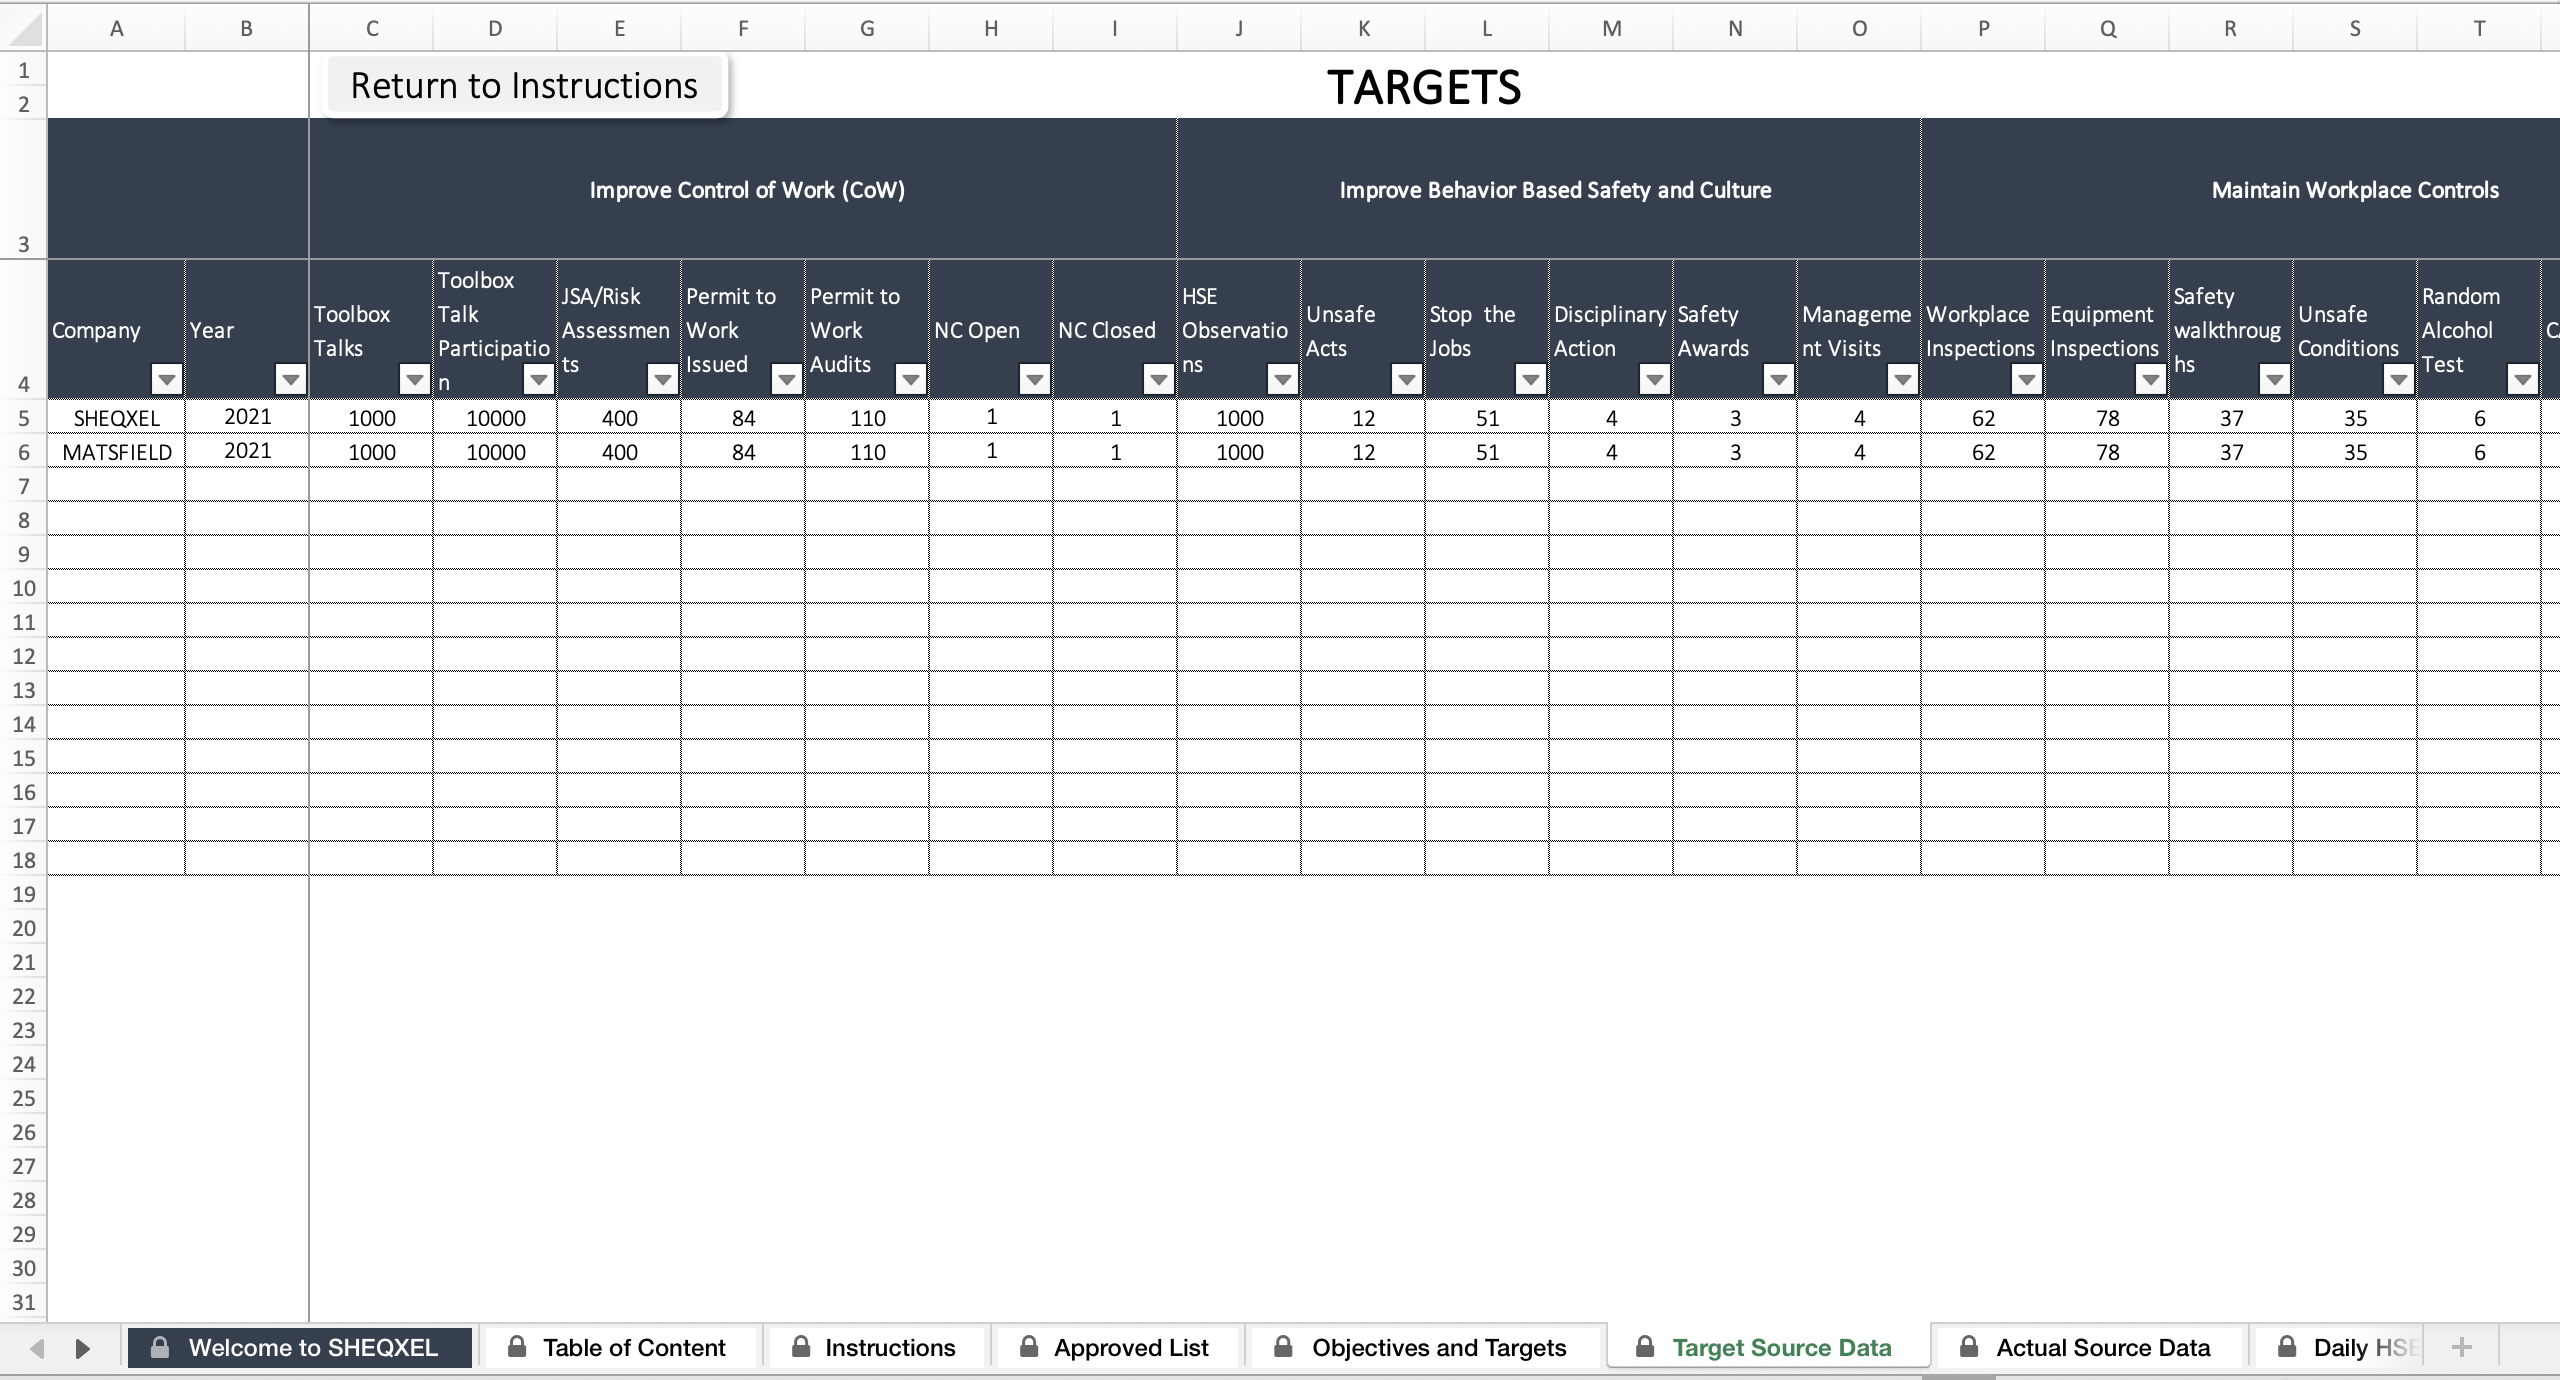
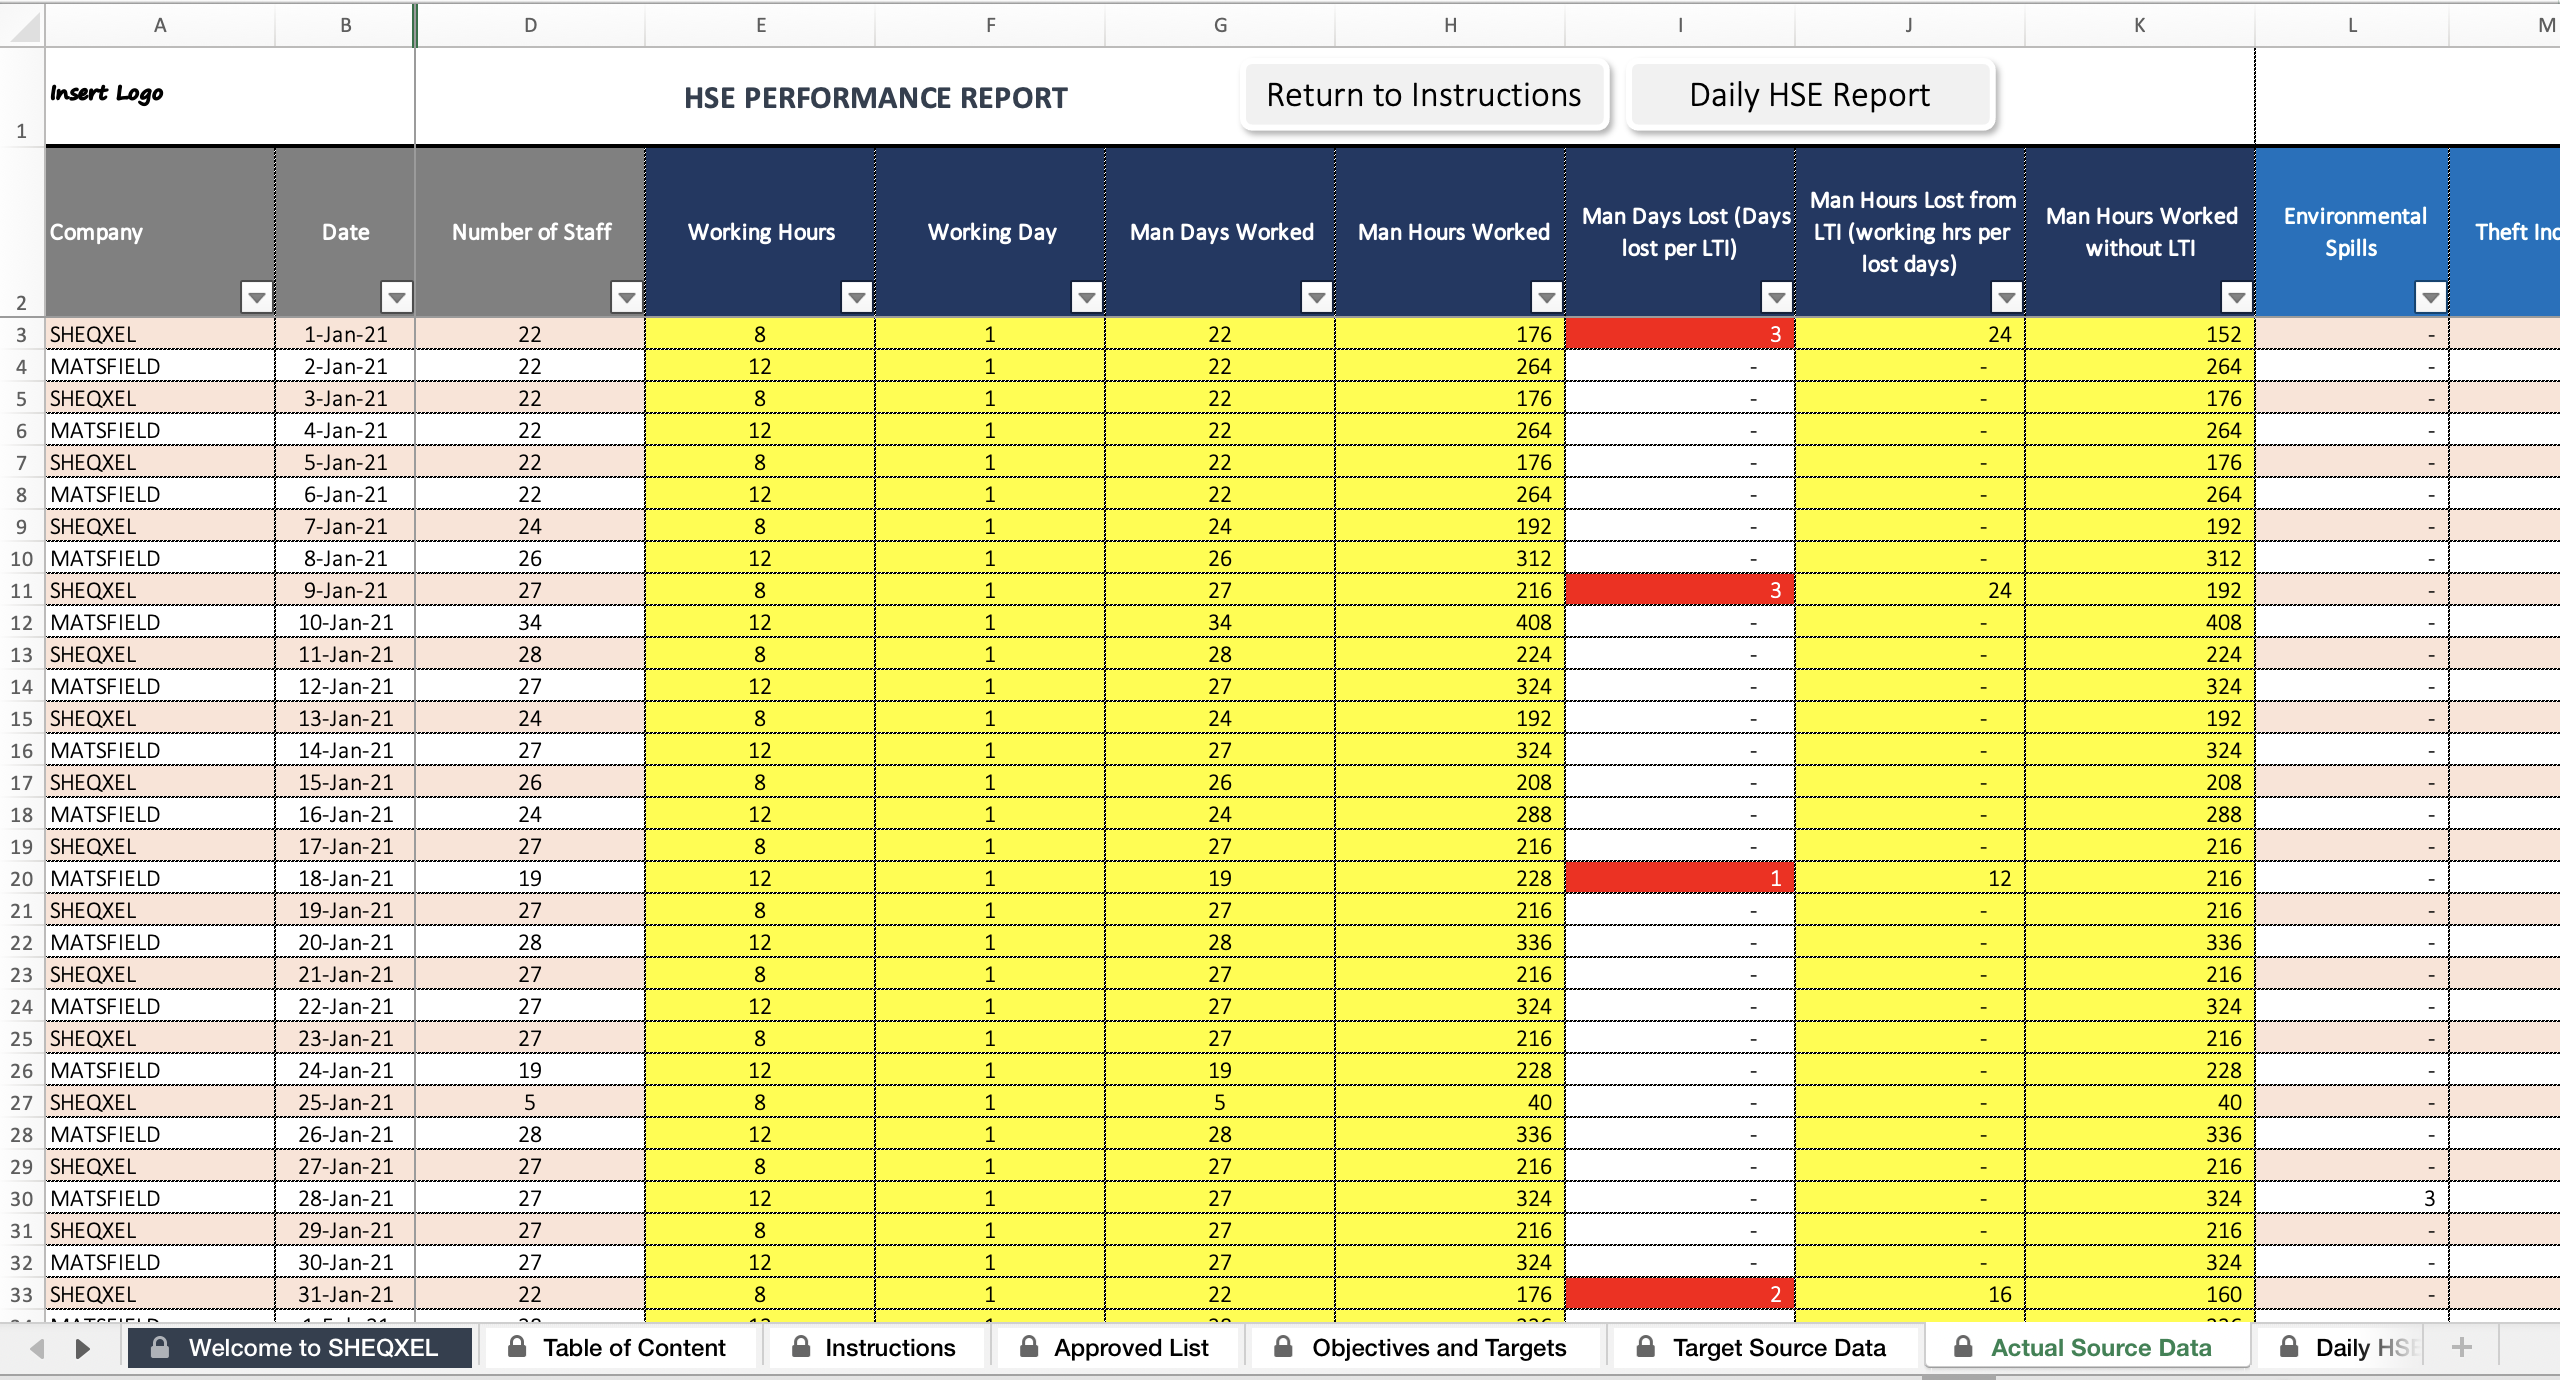
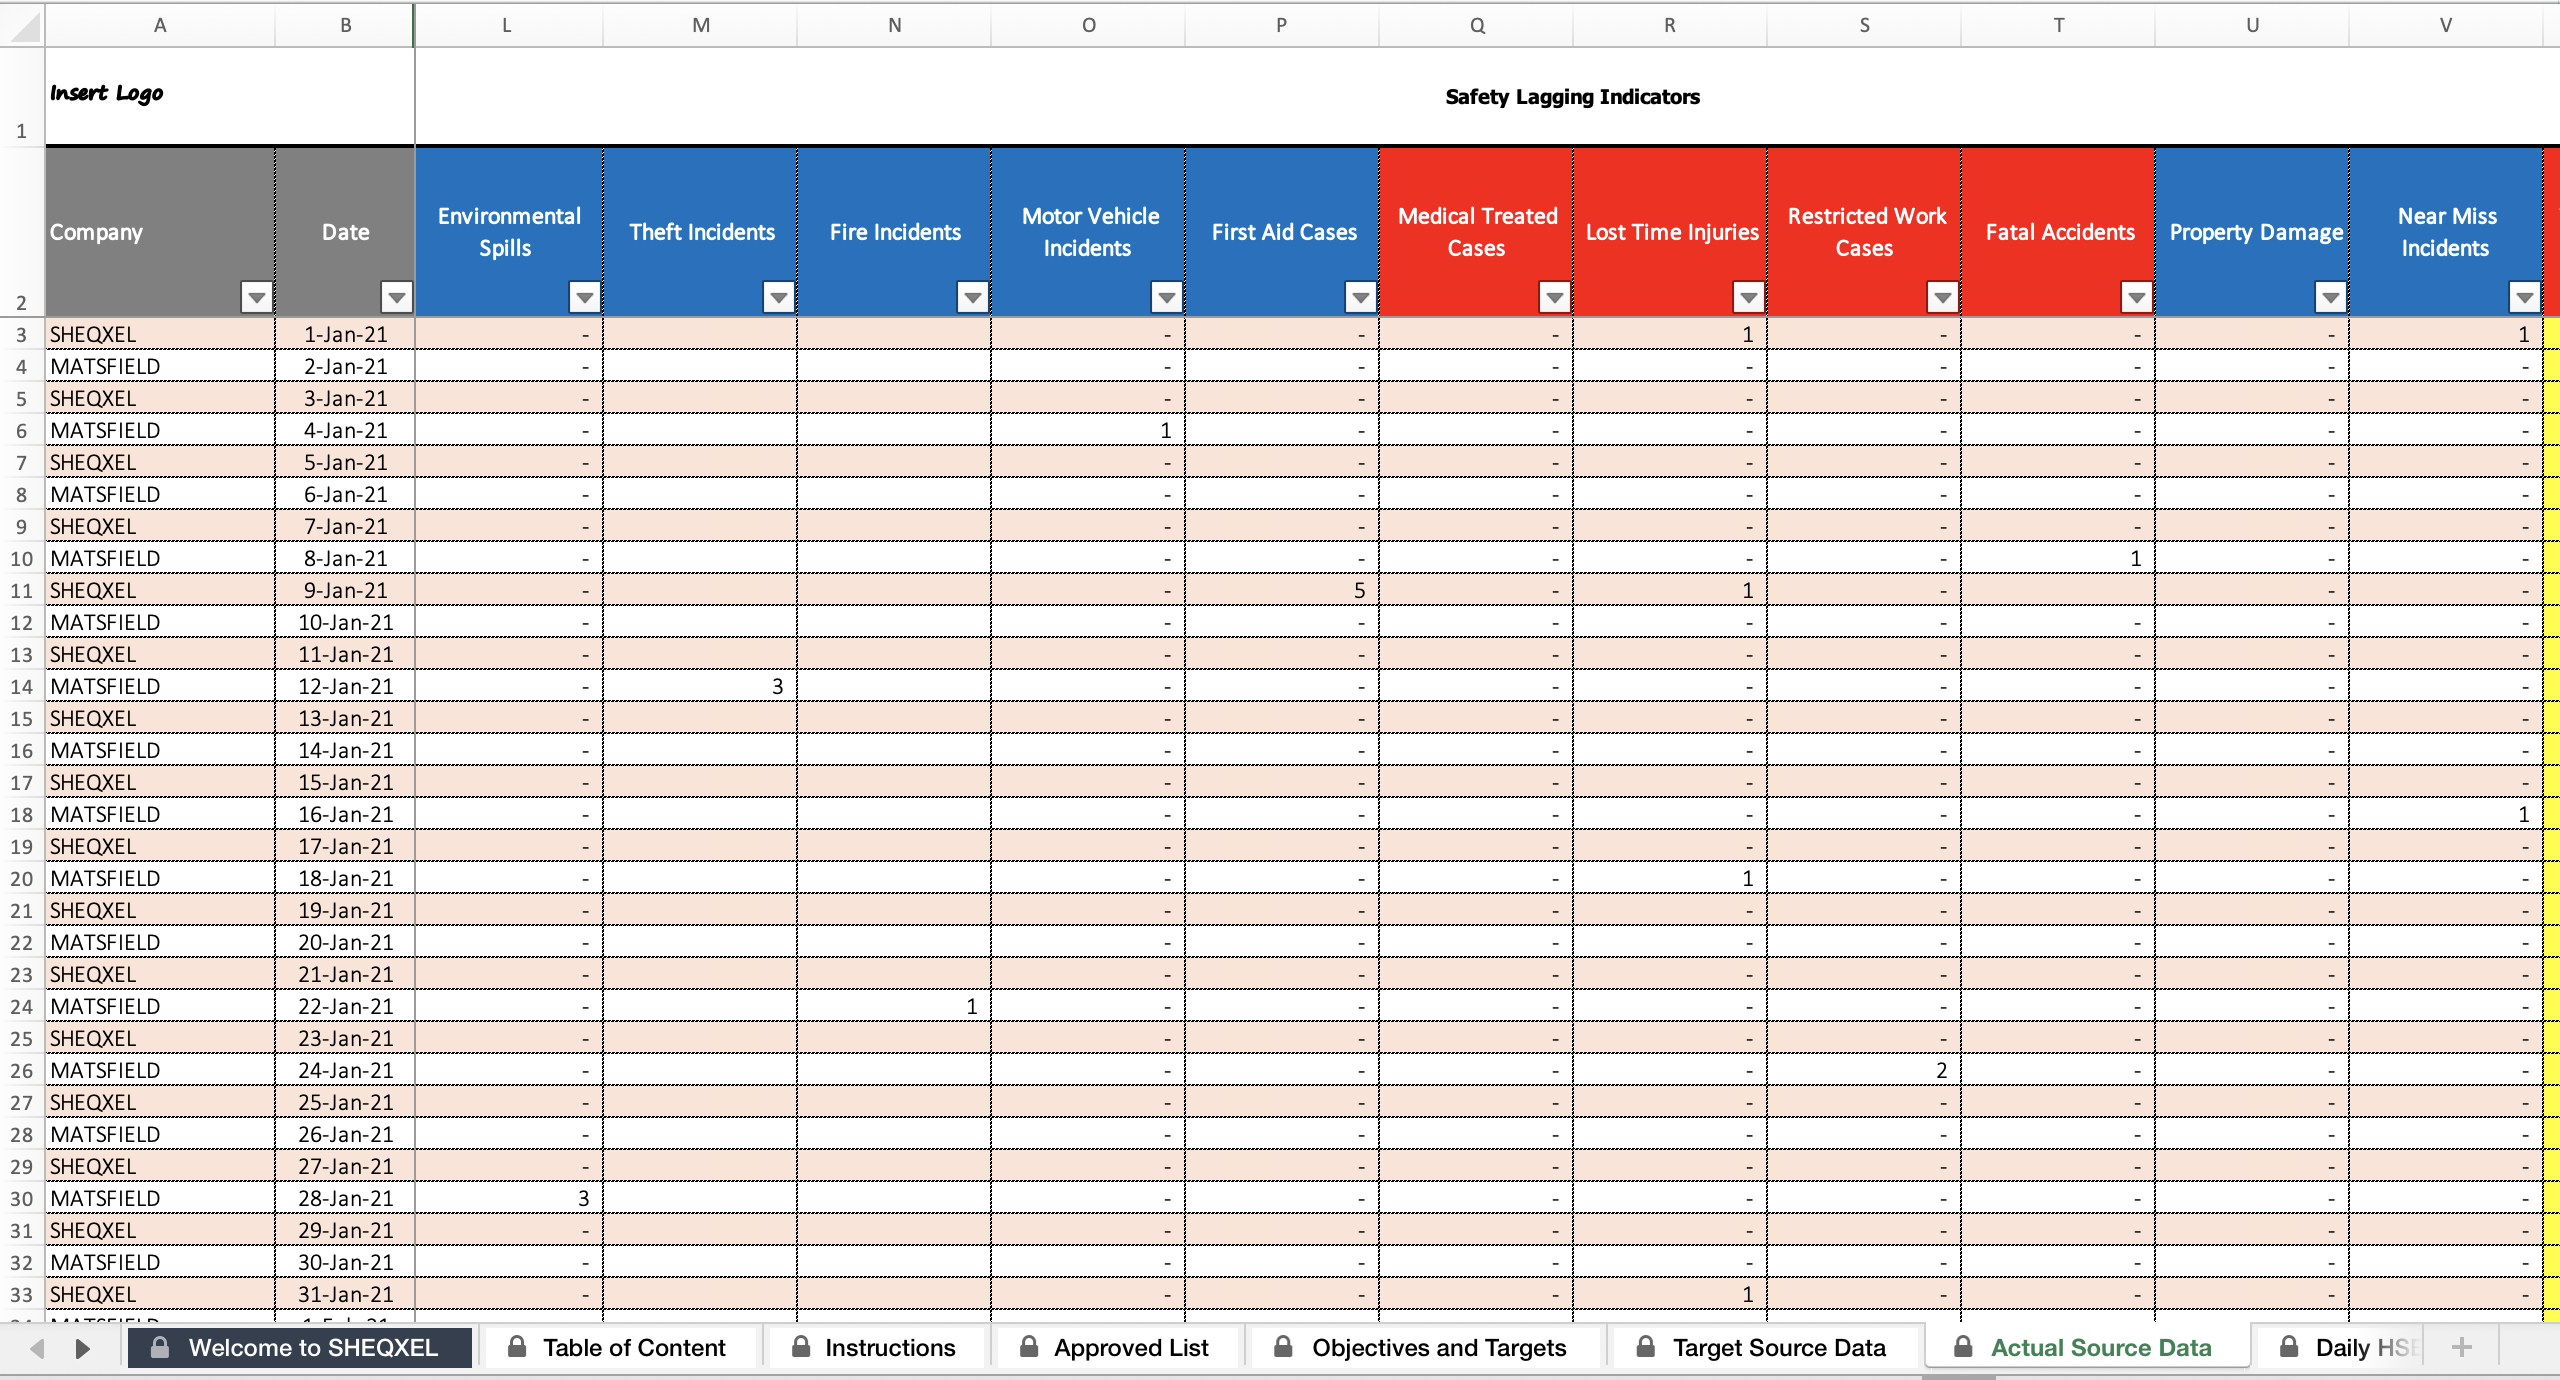
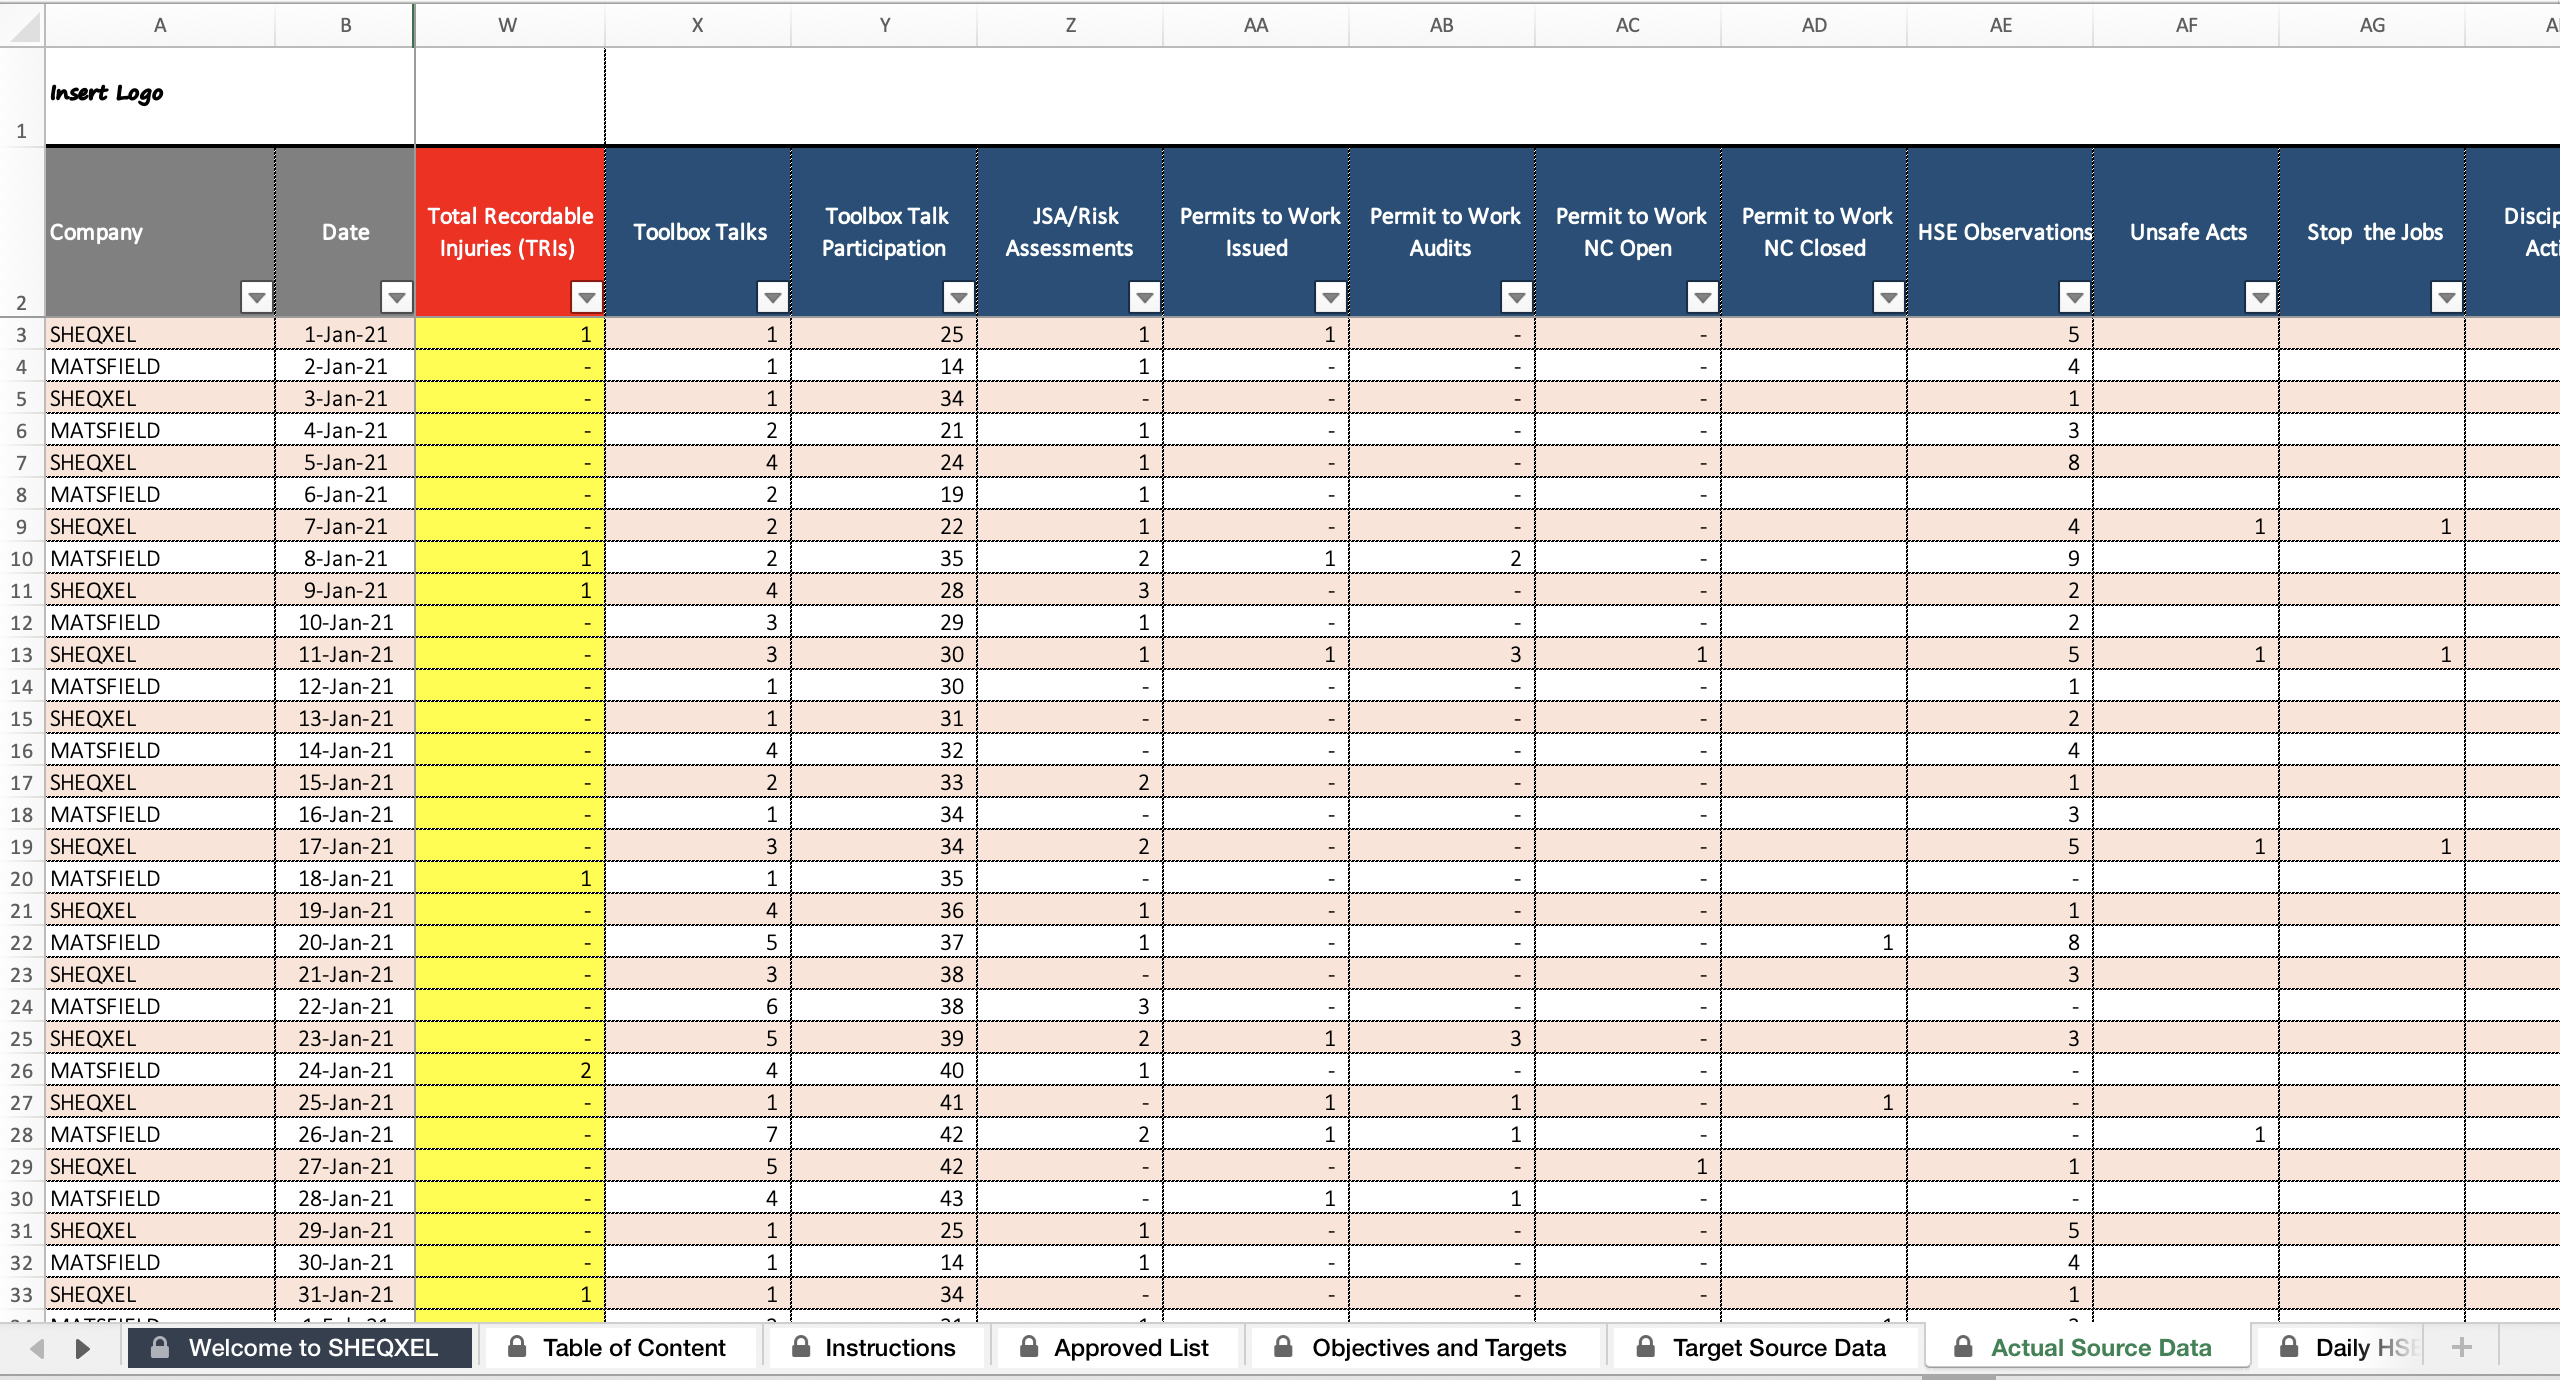
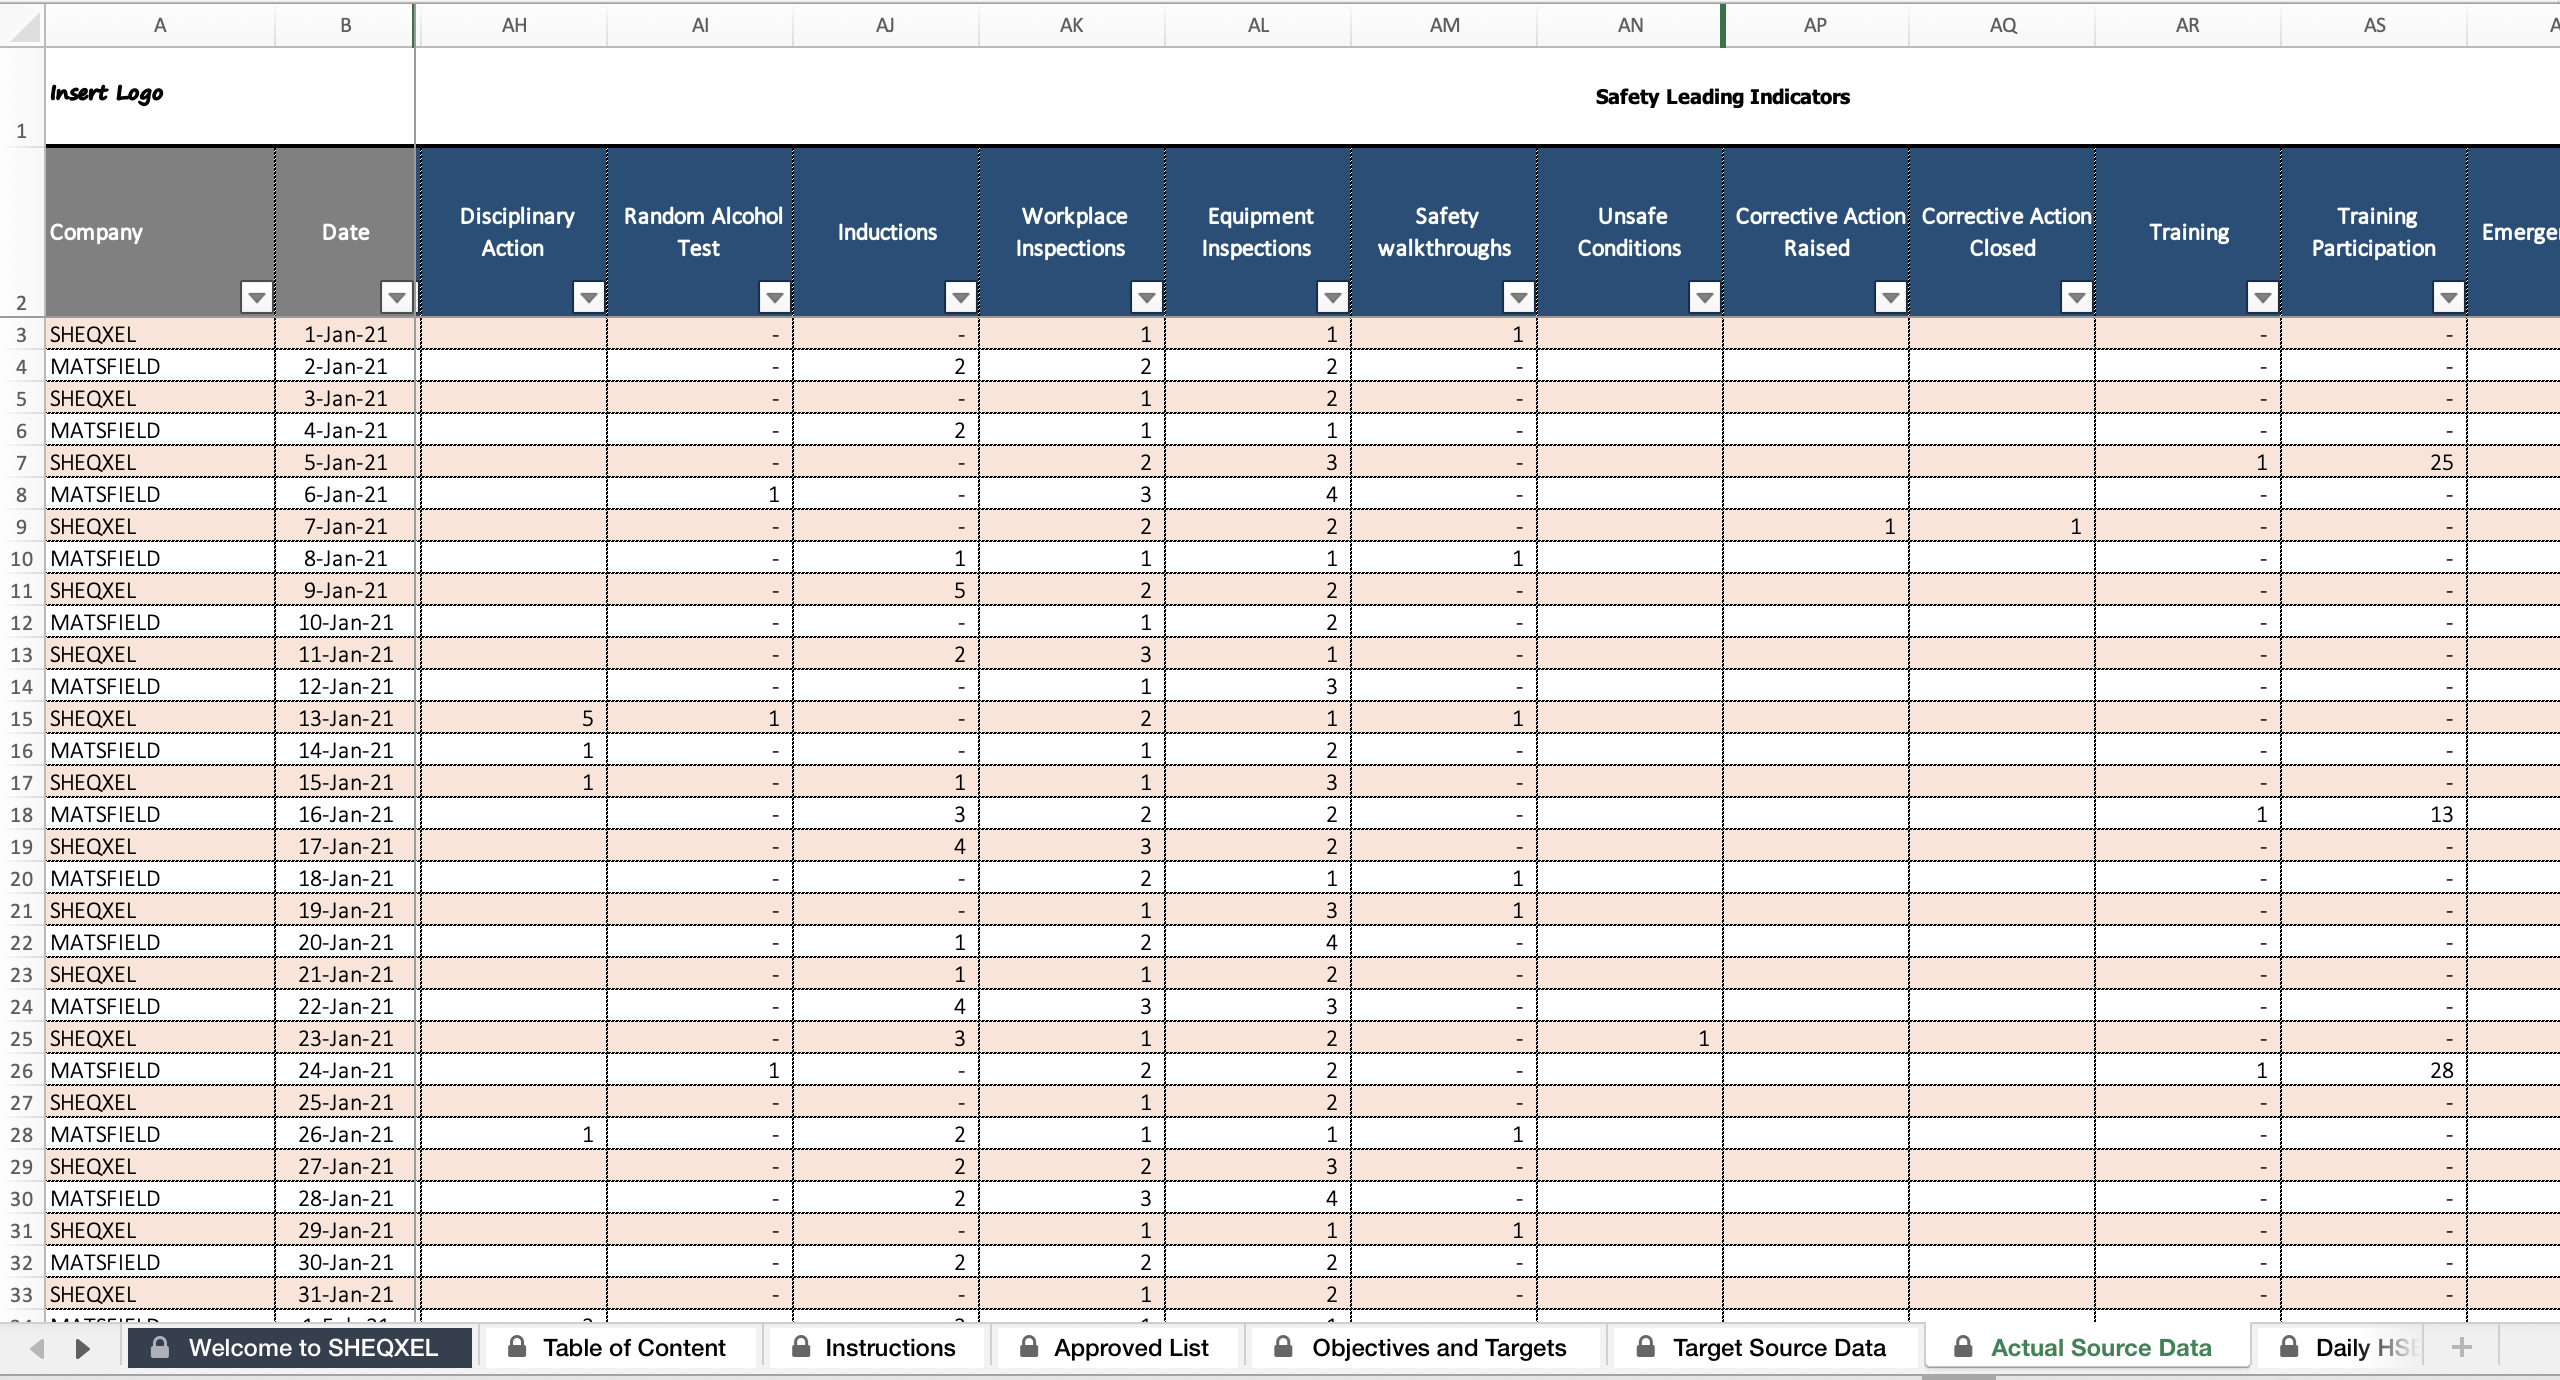
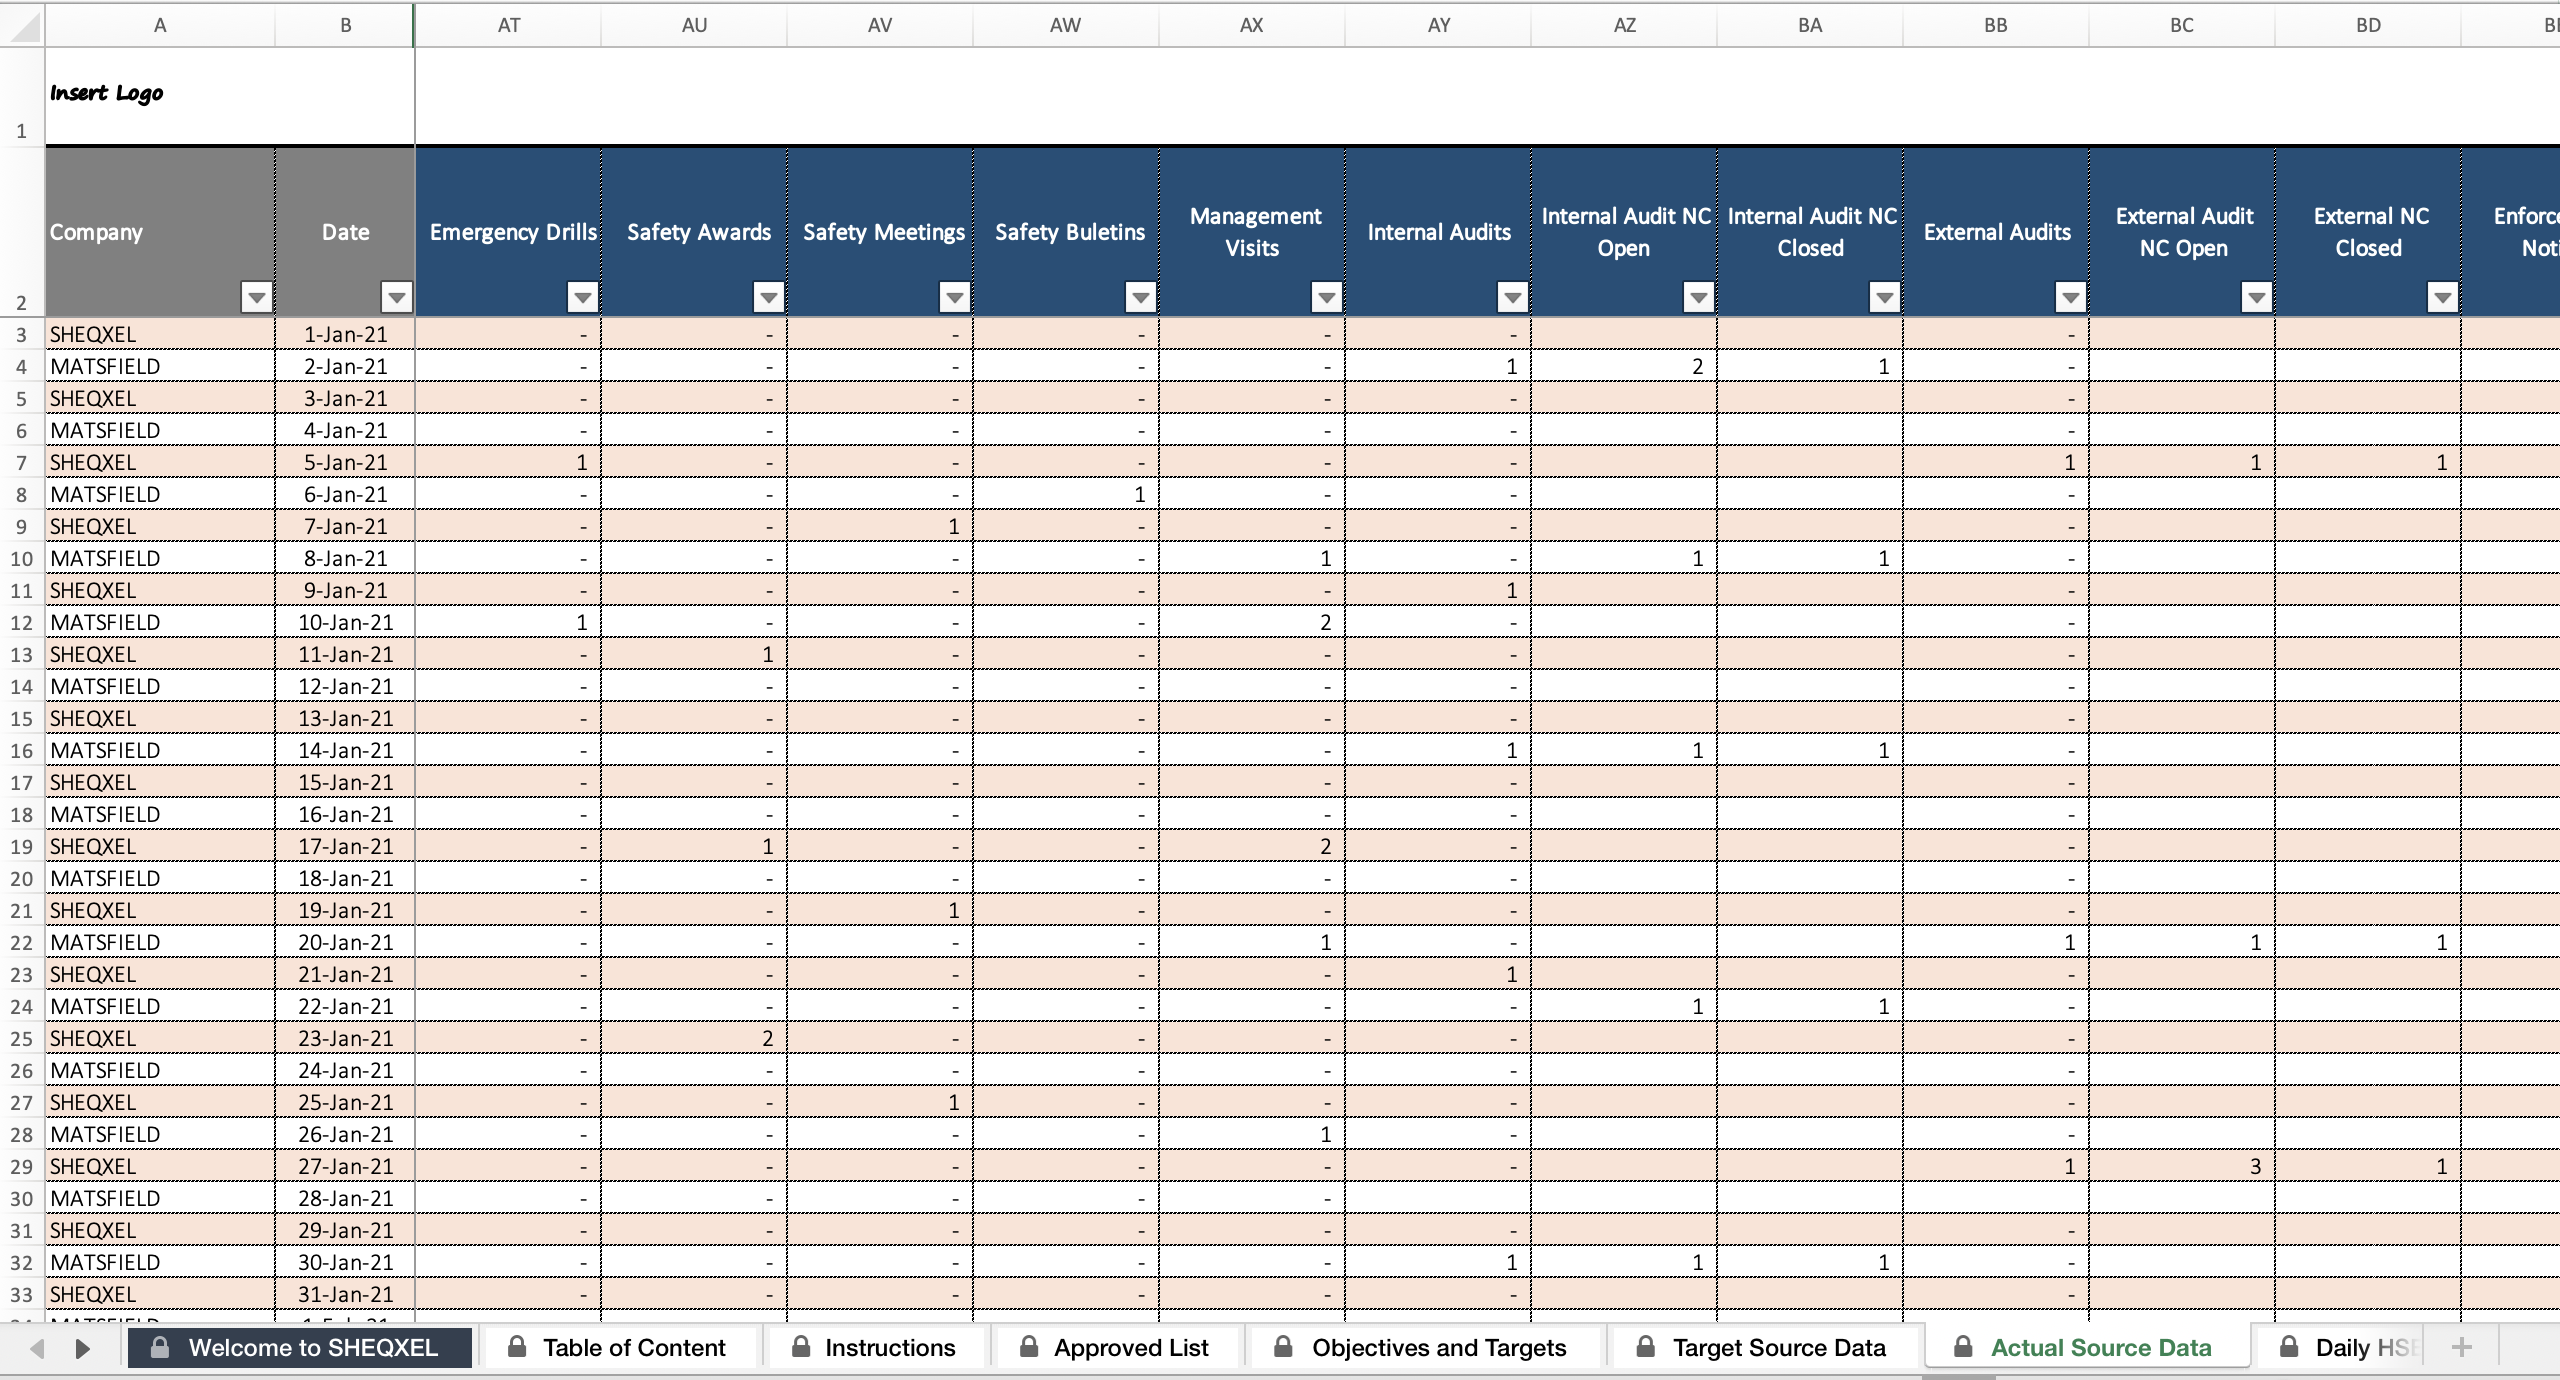
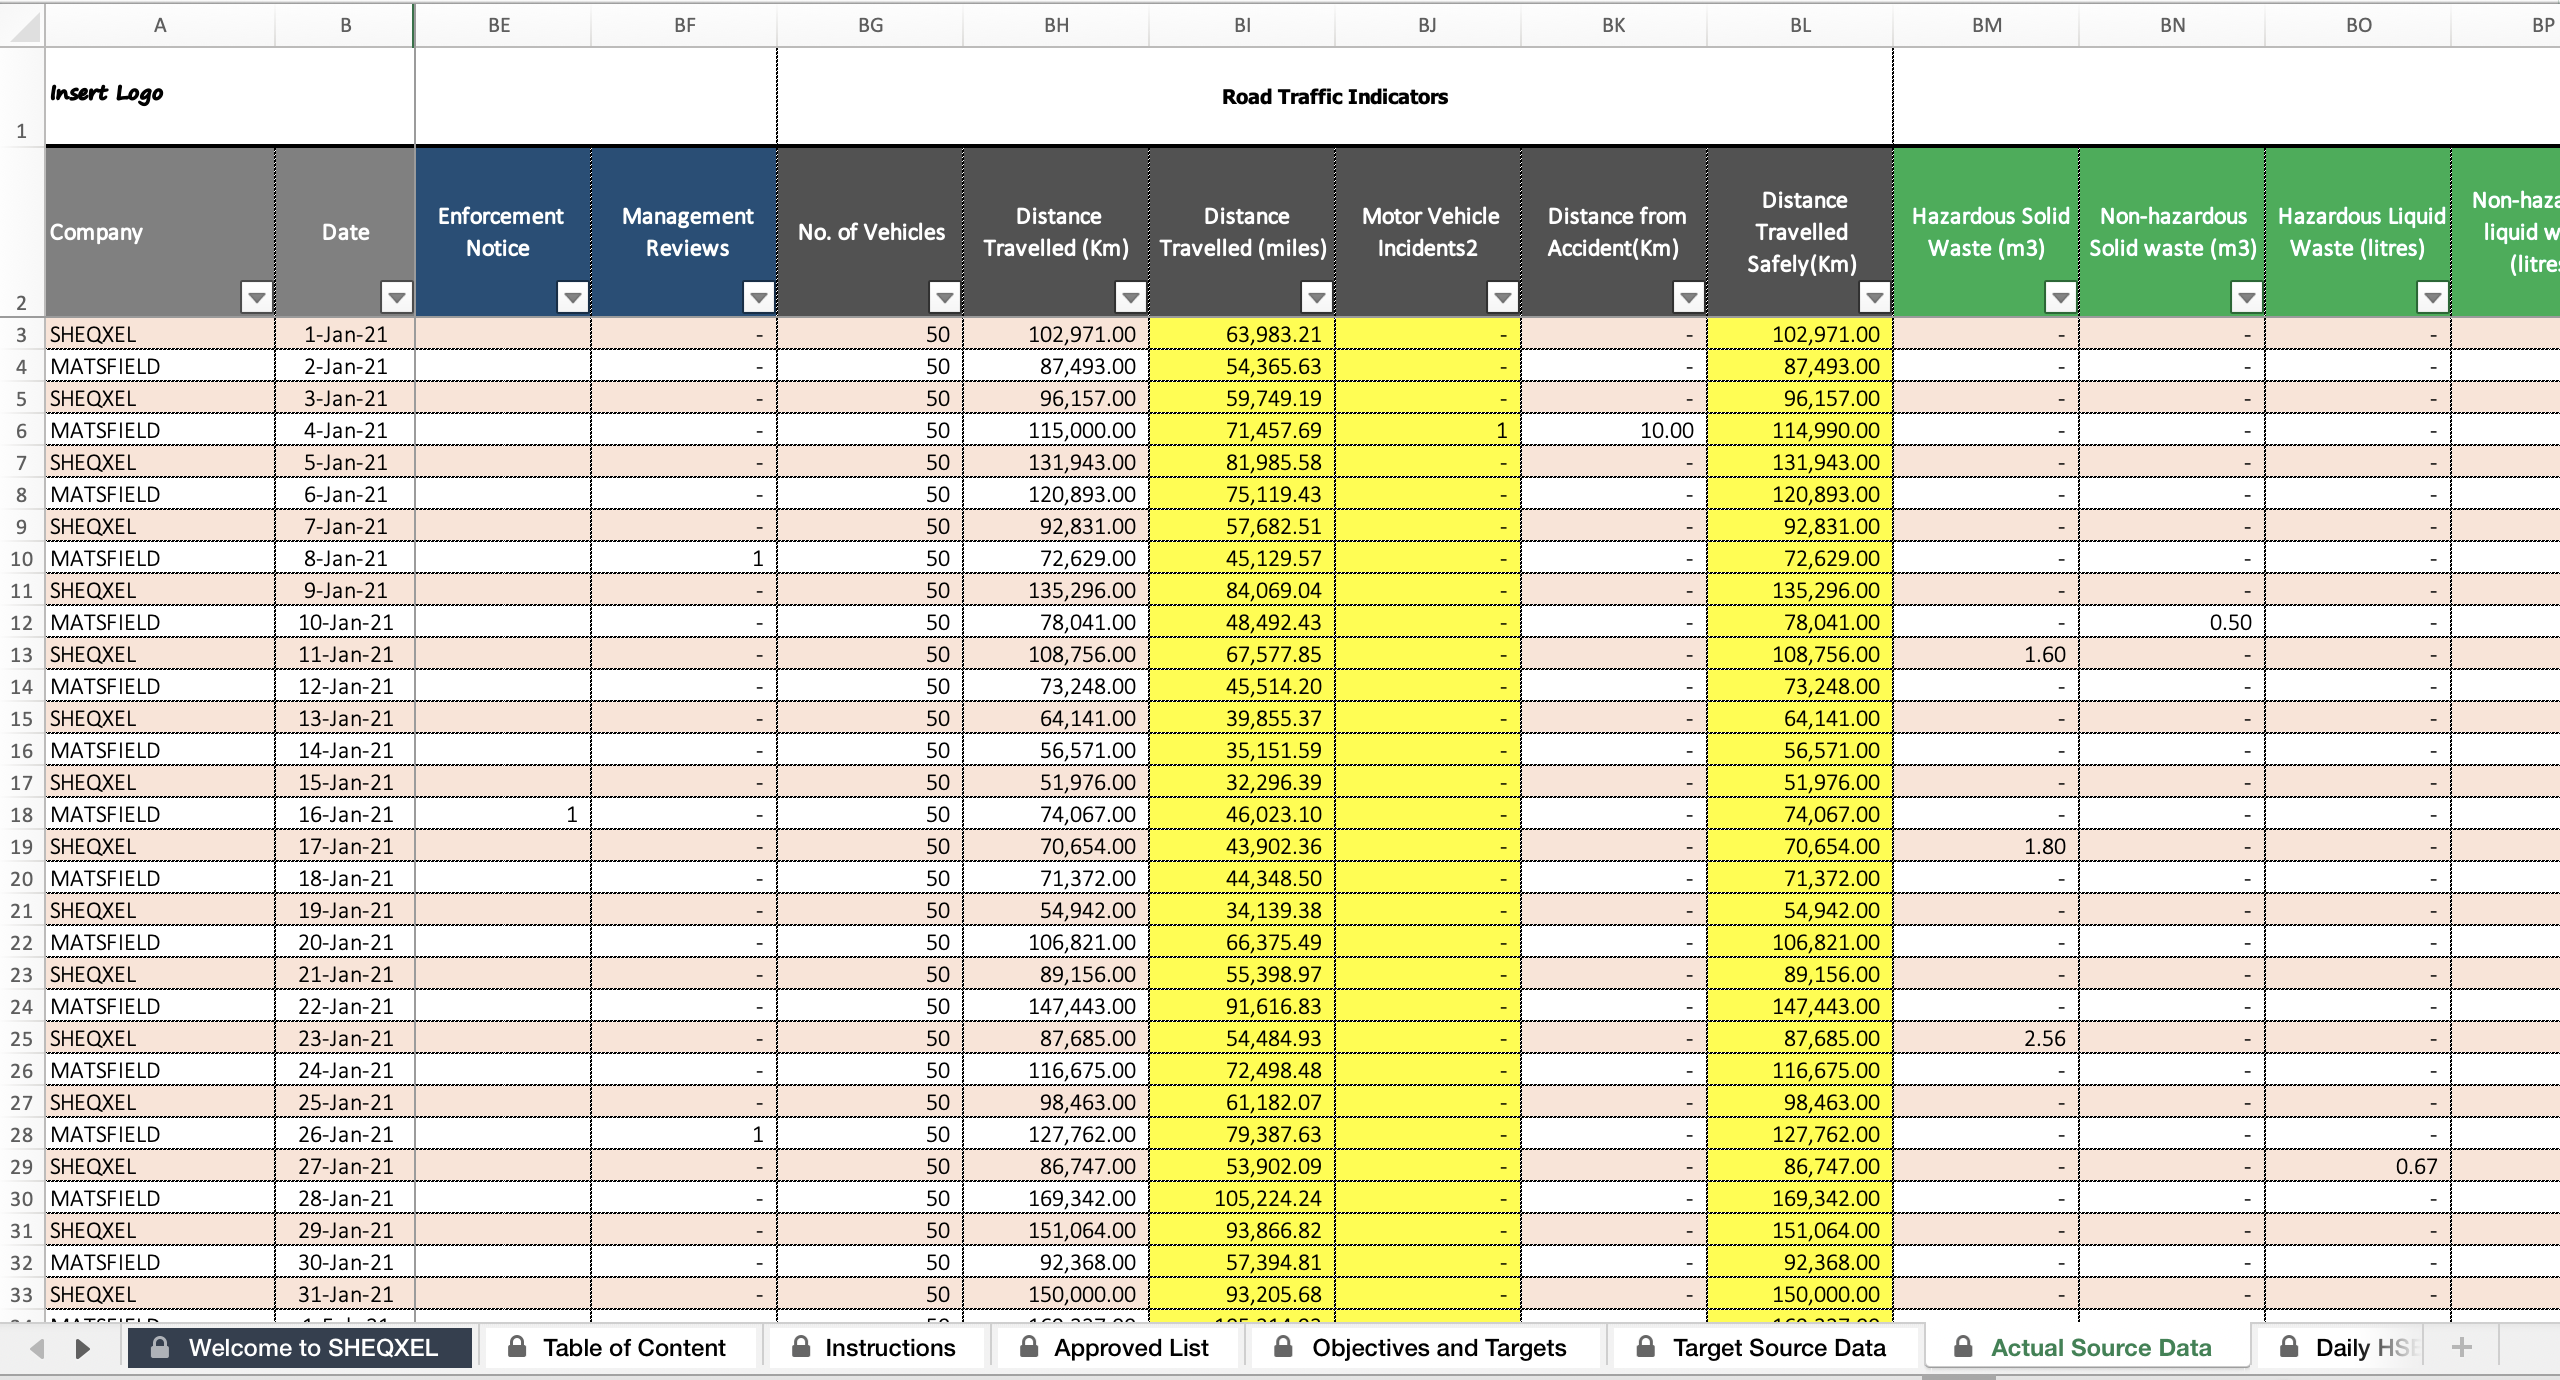
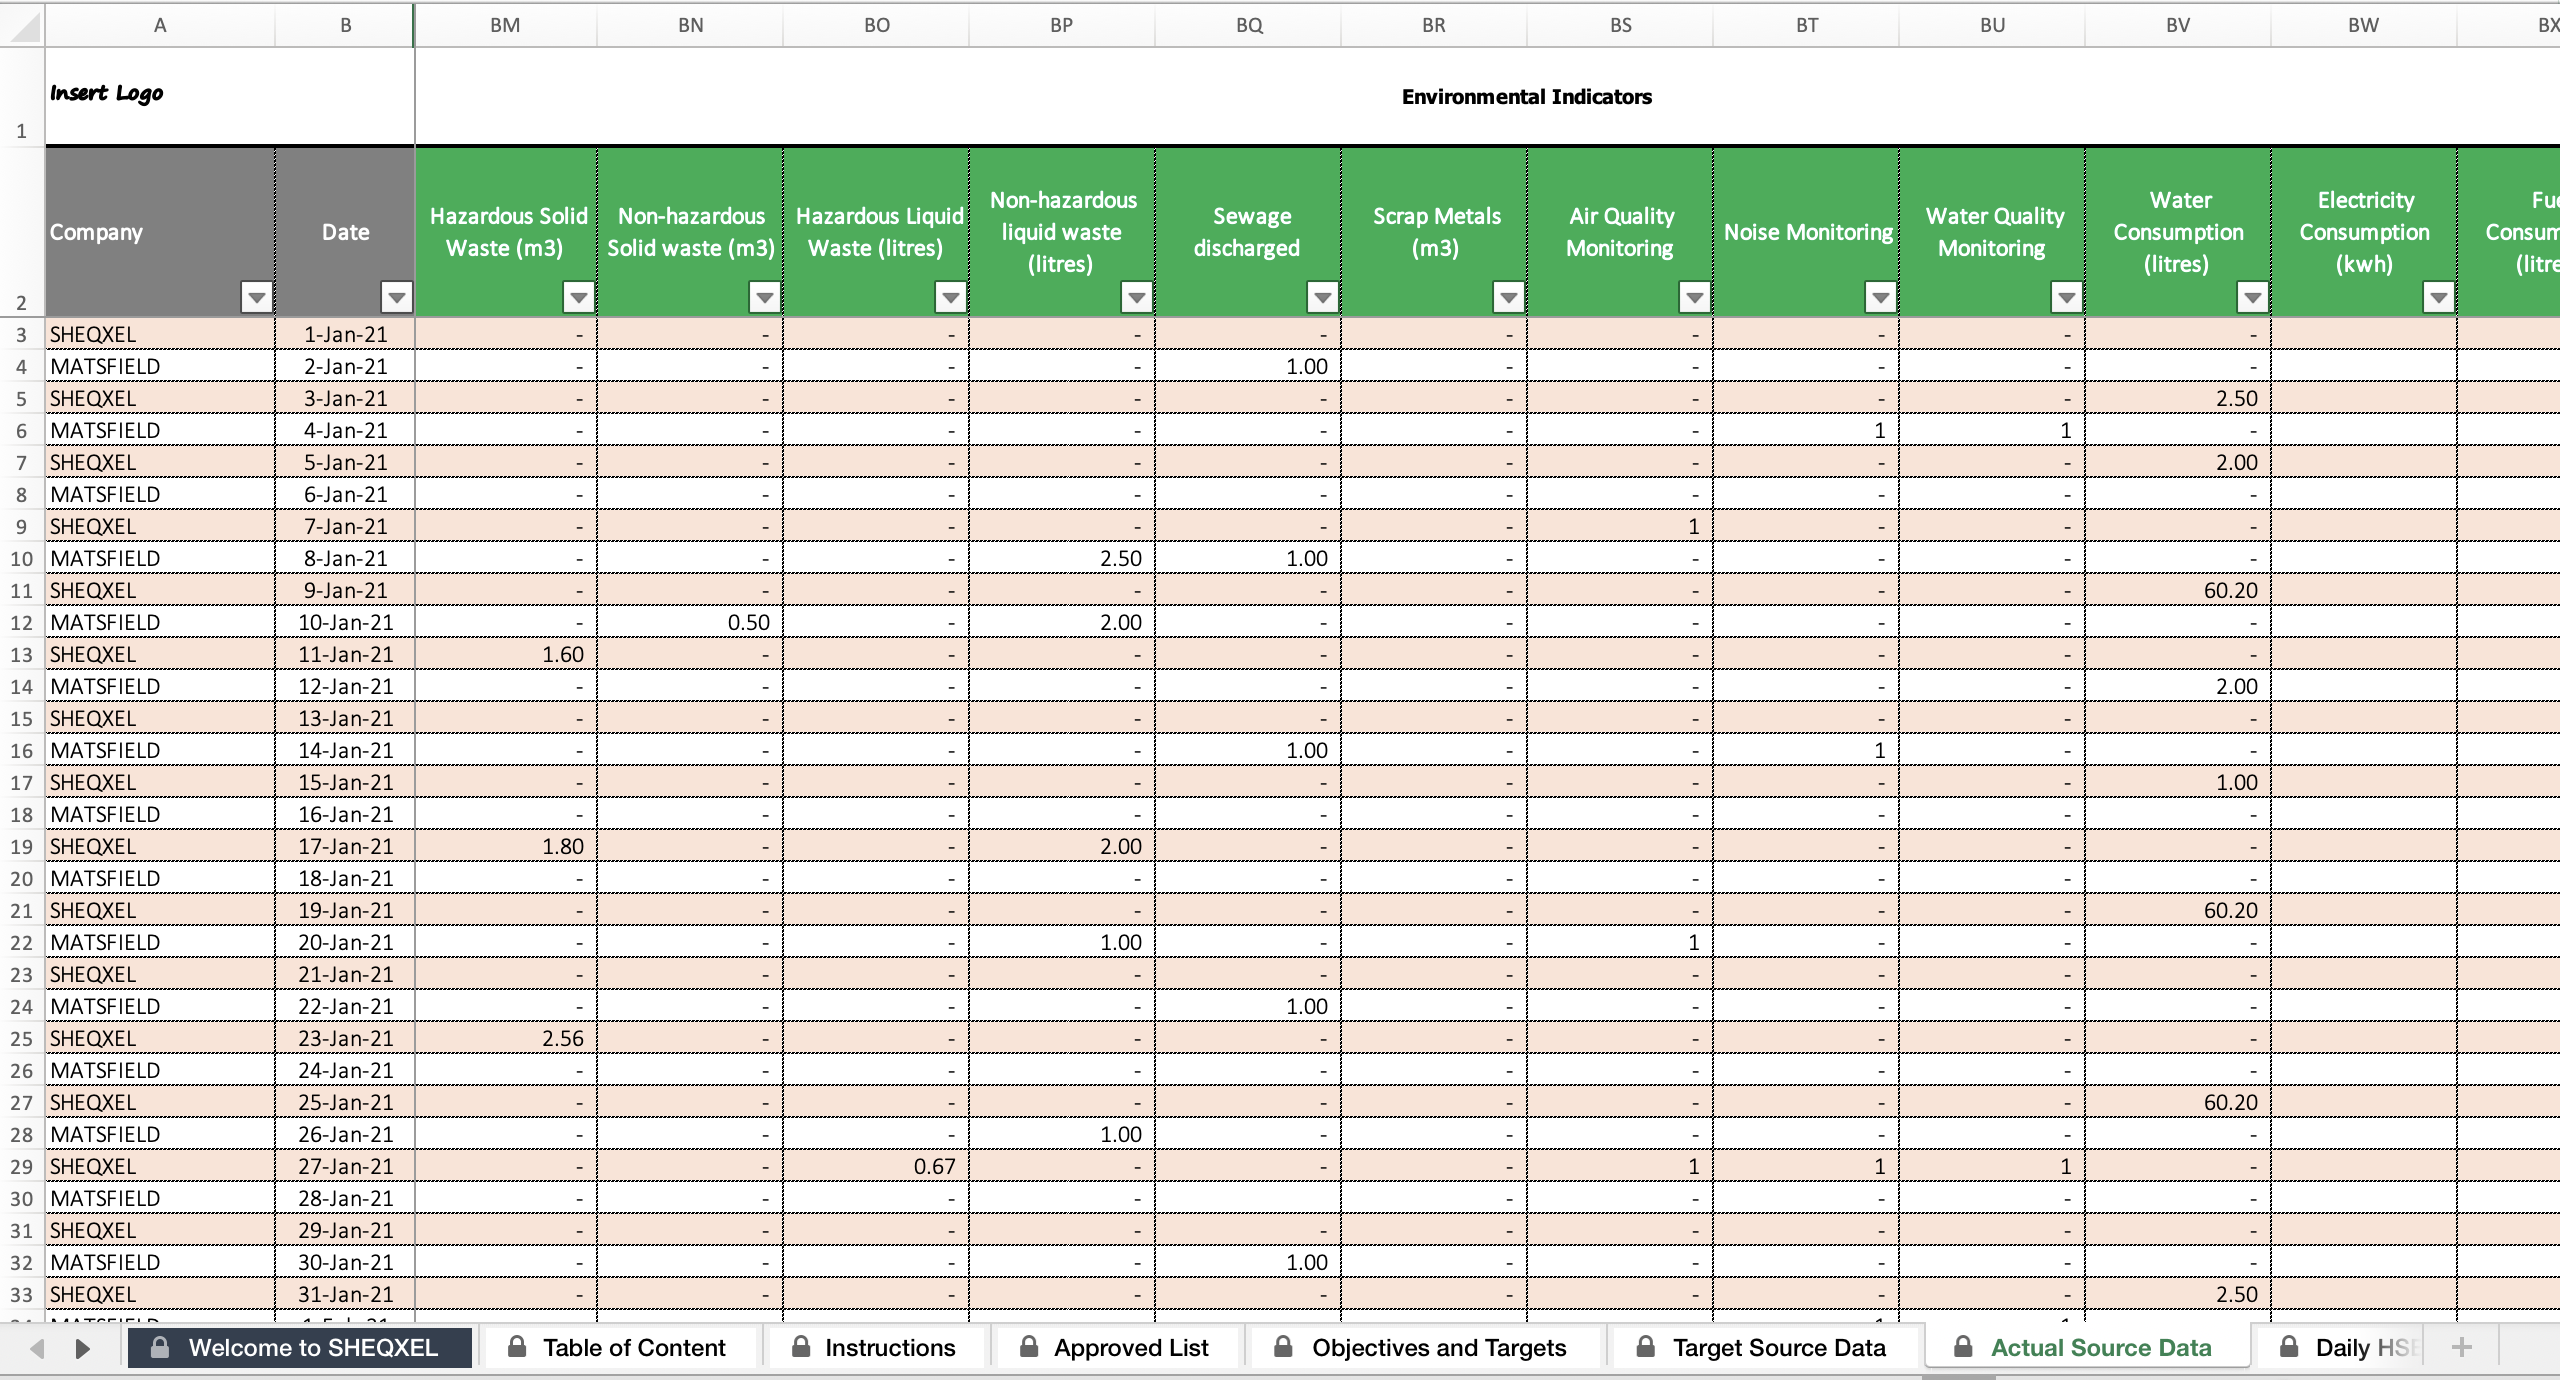
Source Data Sheet
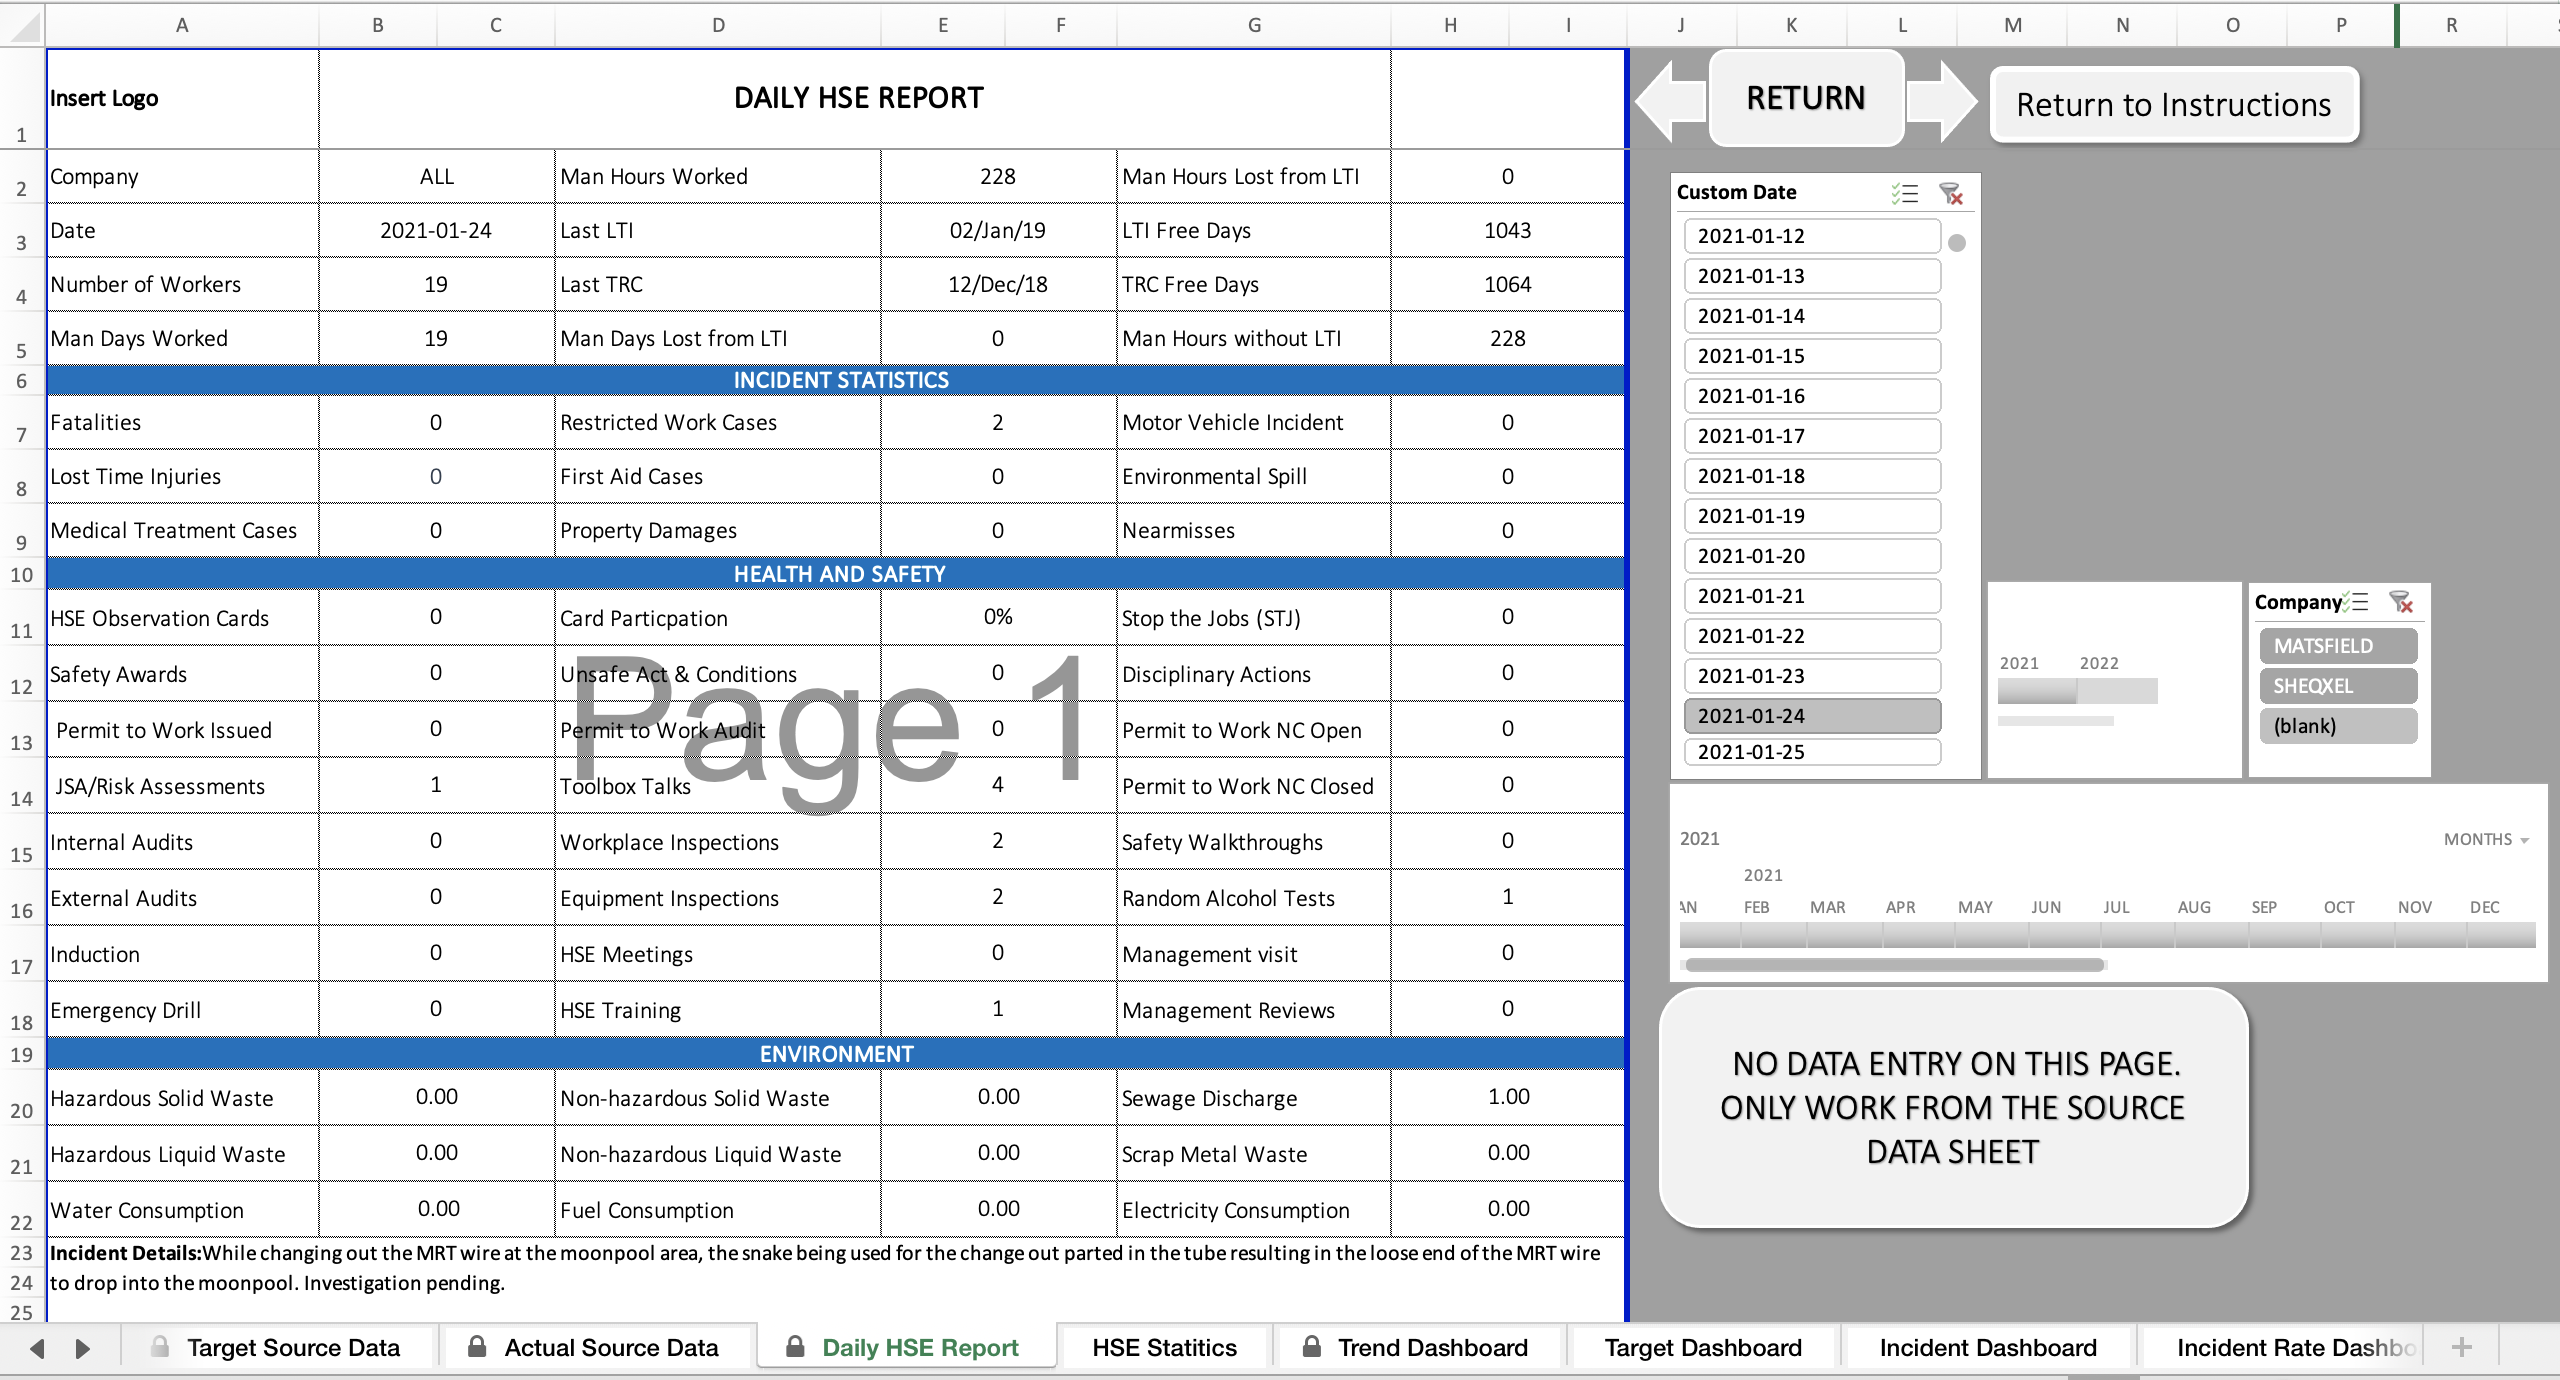
Daily HSE Report Template
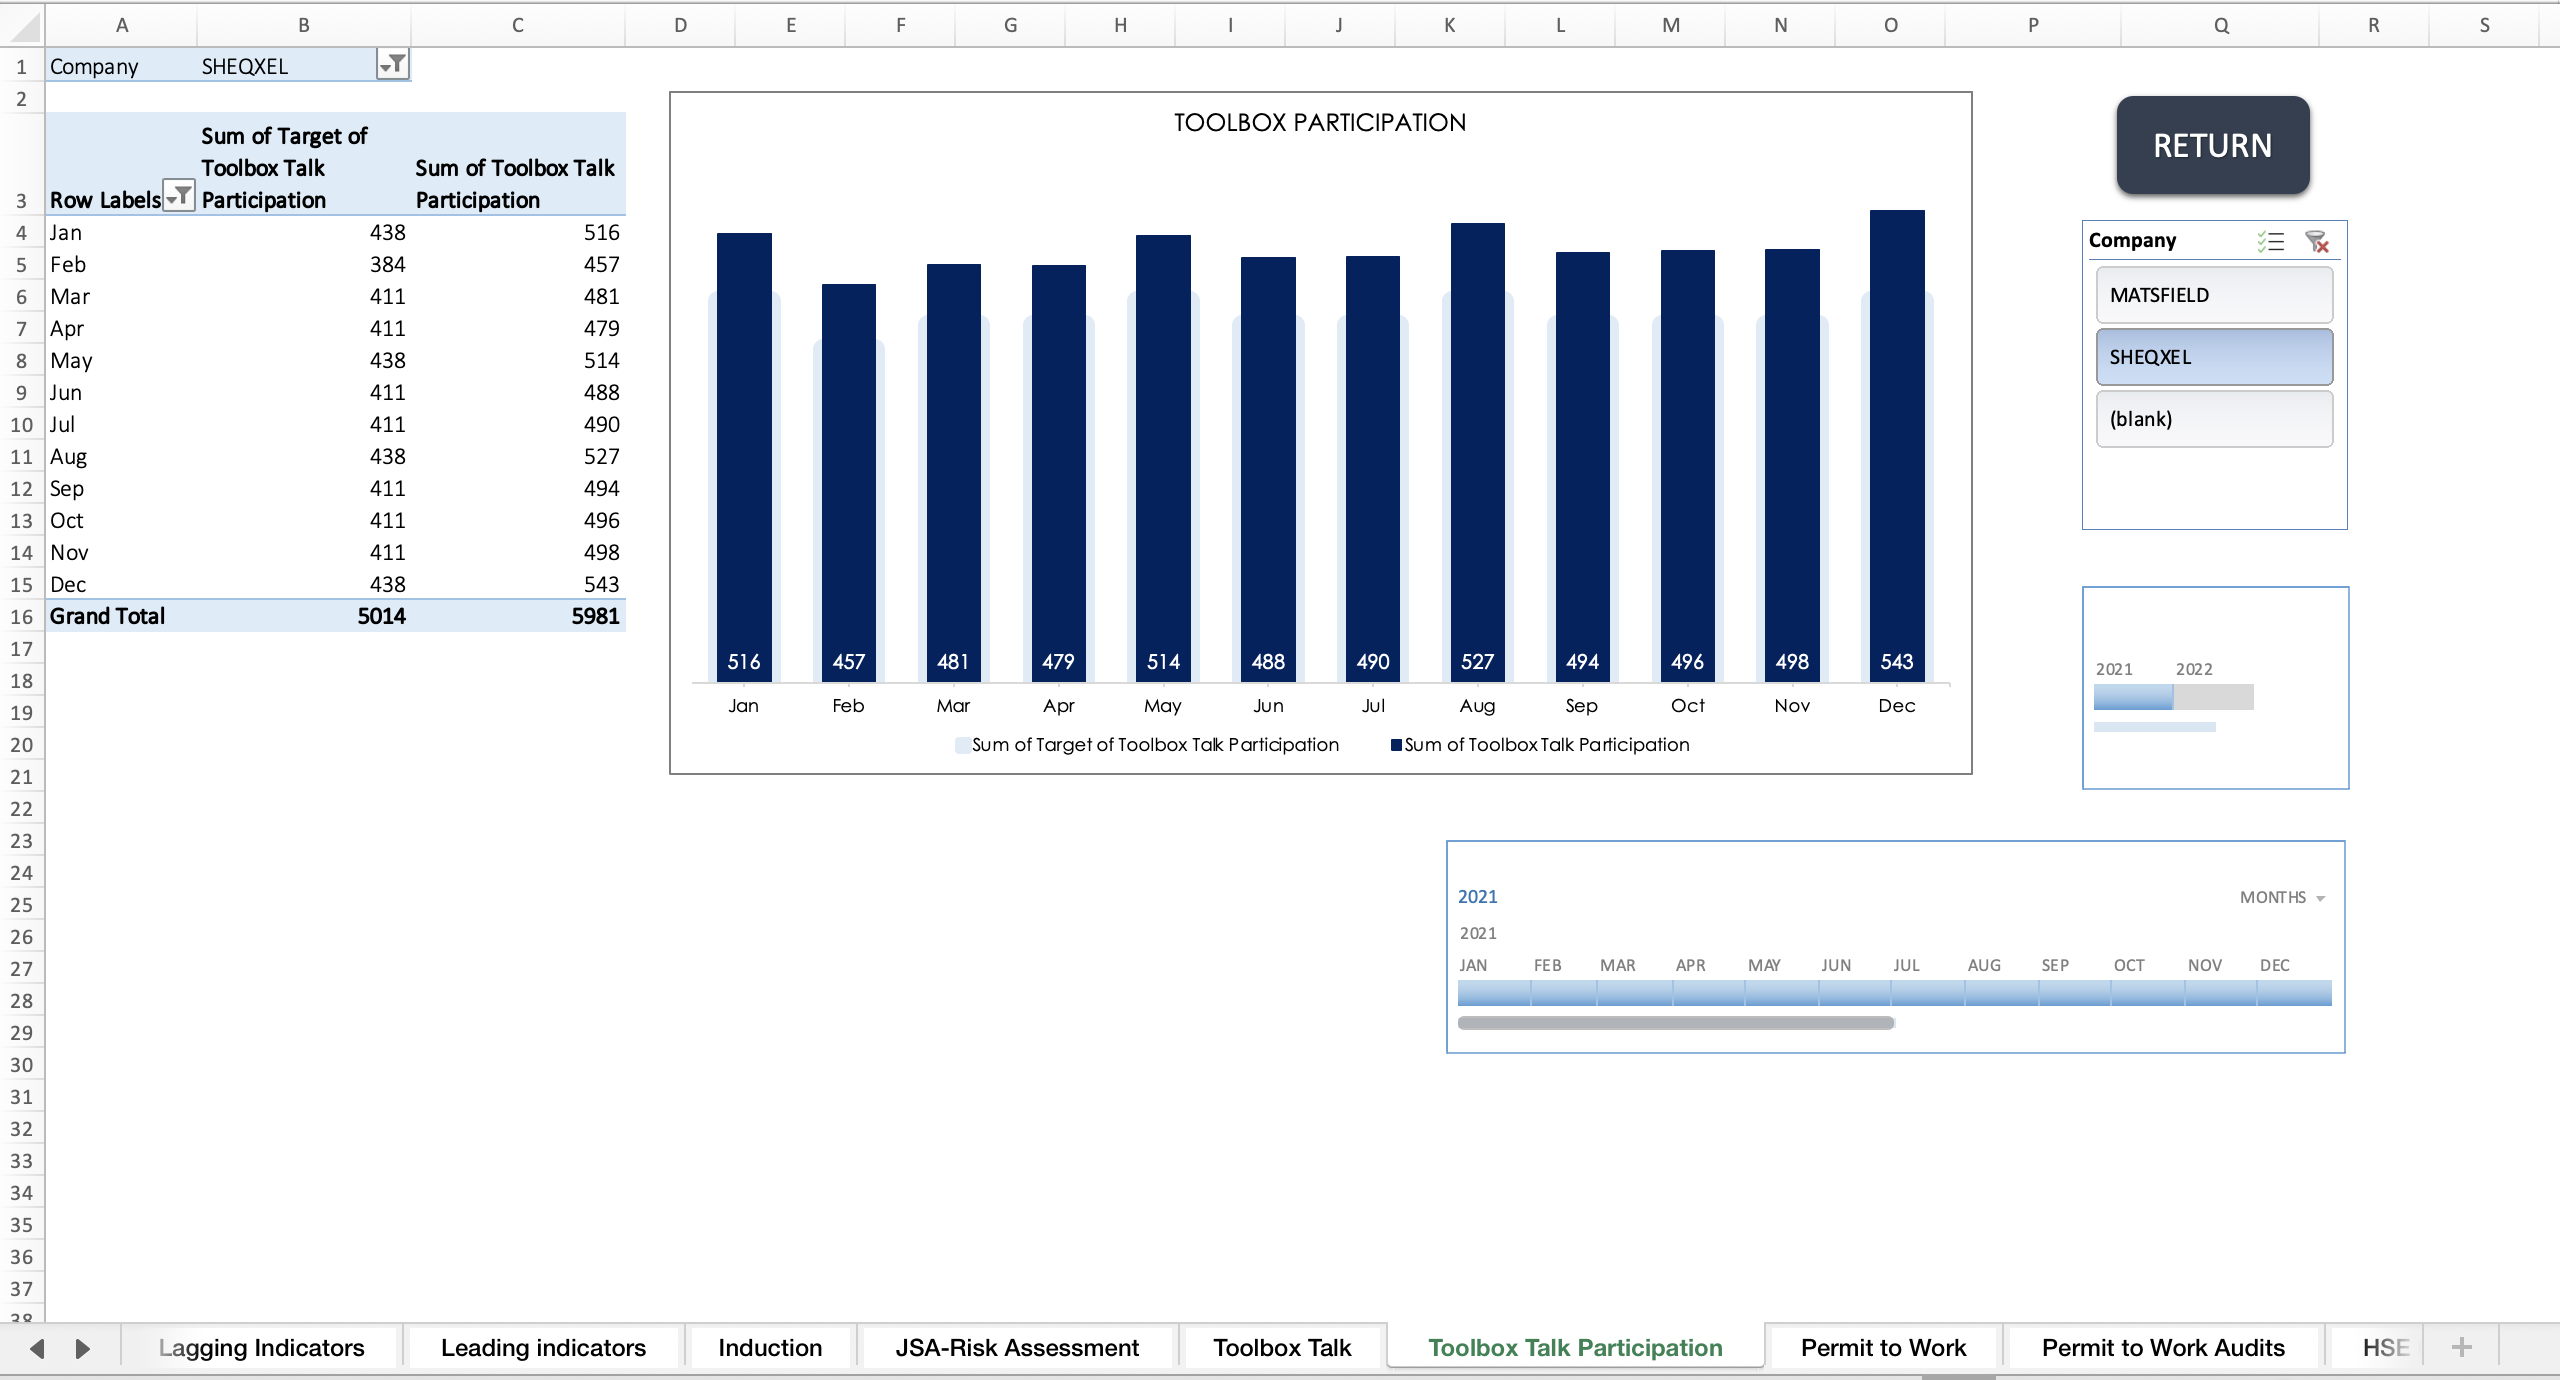
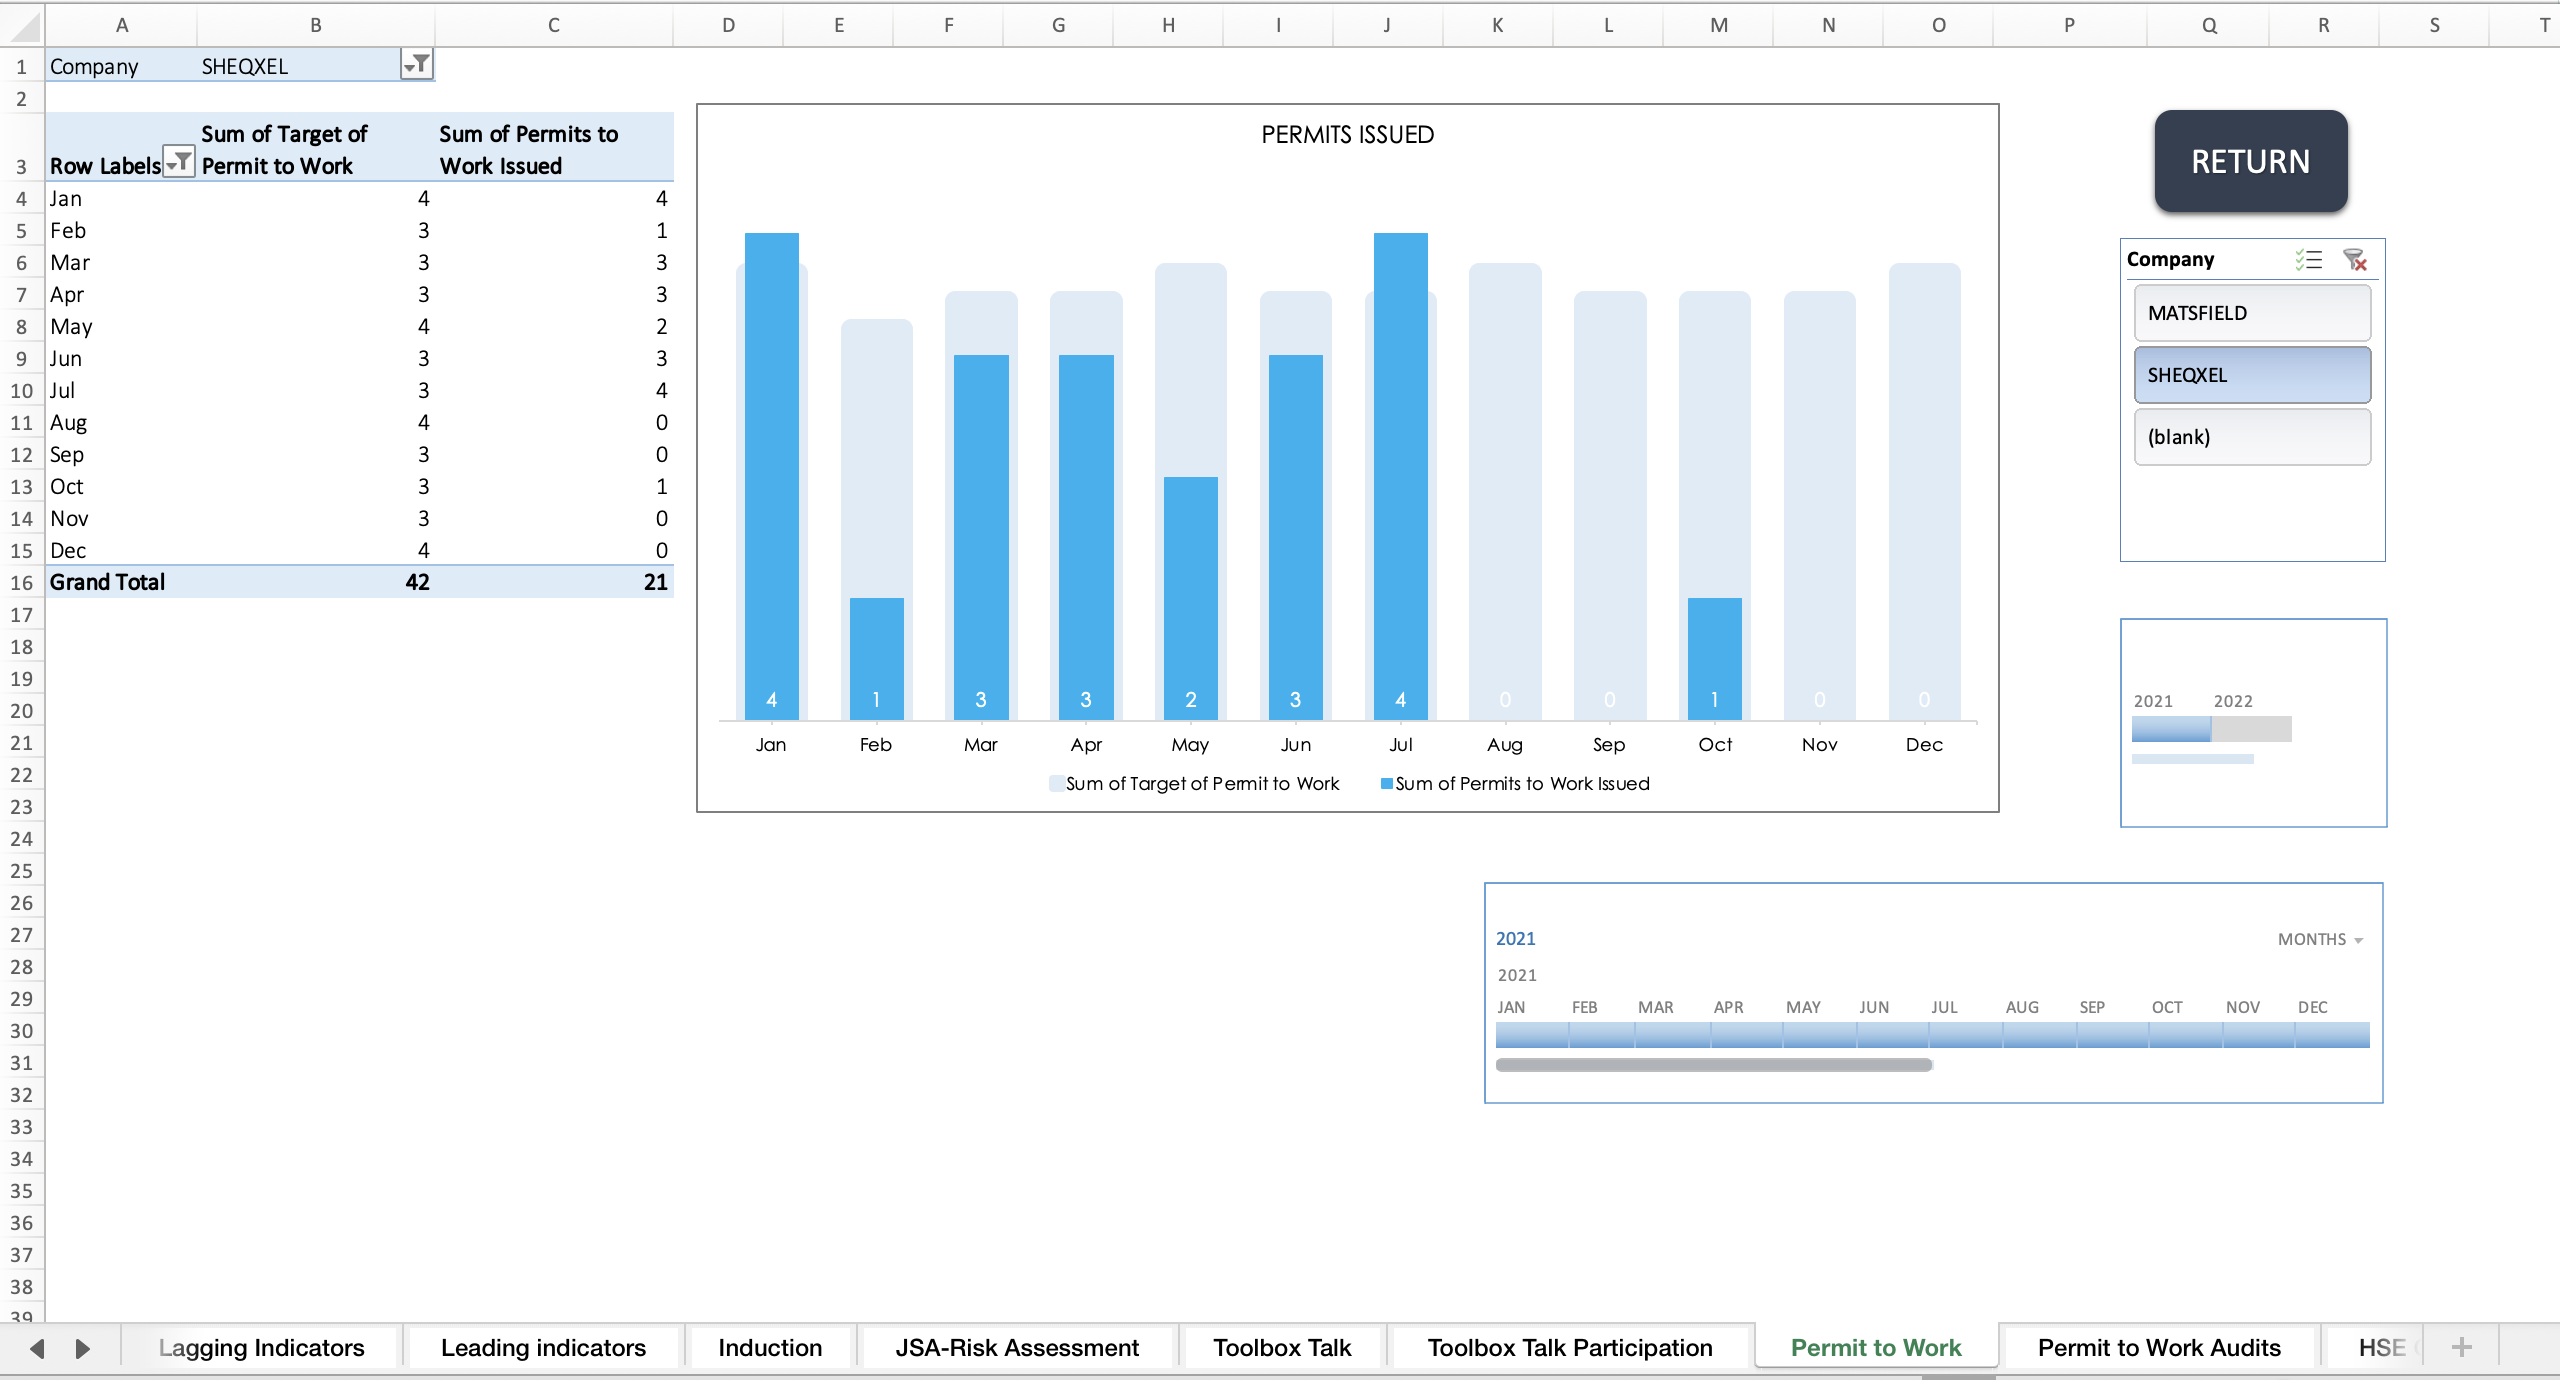
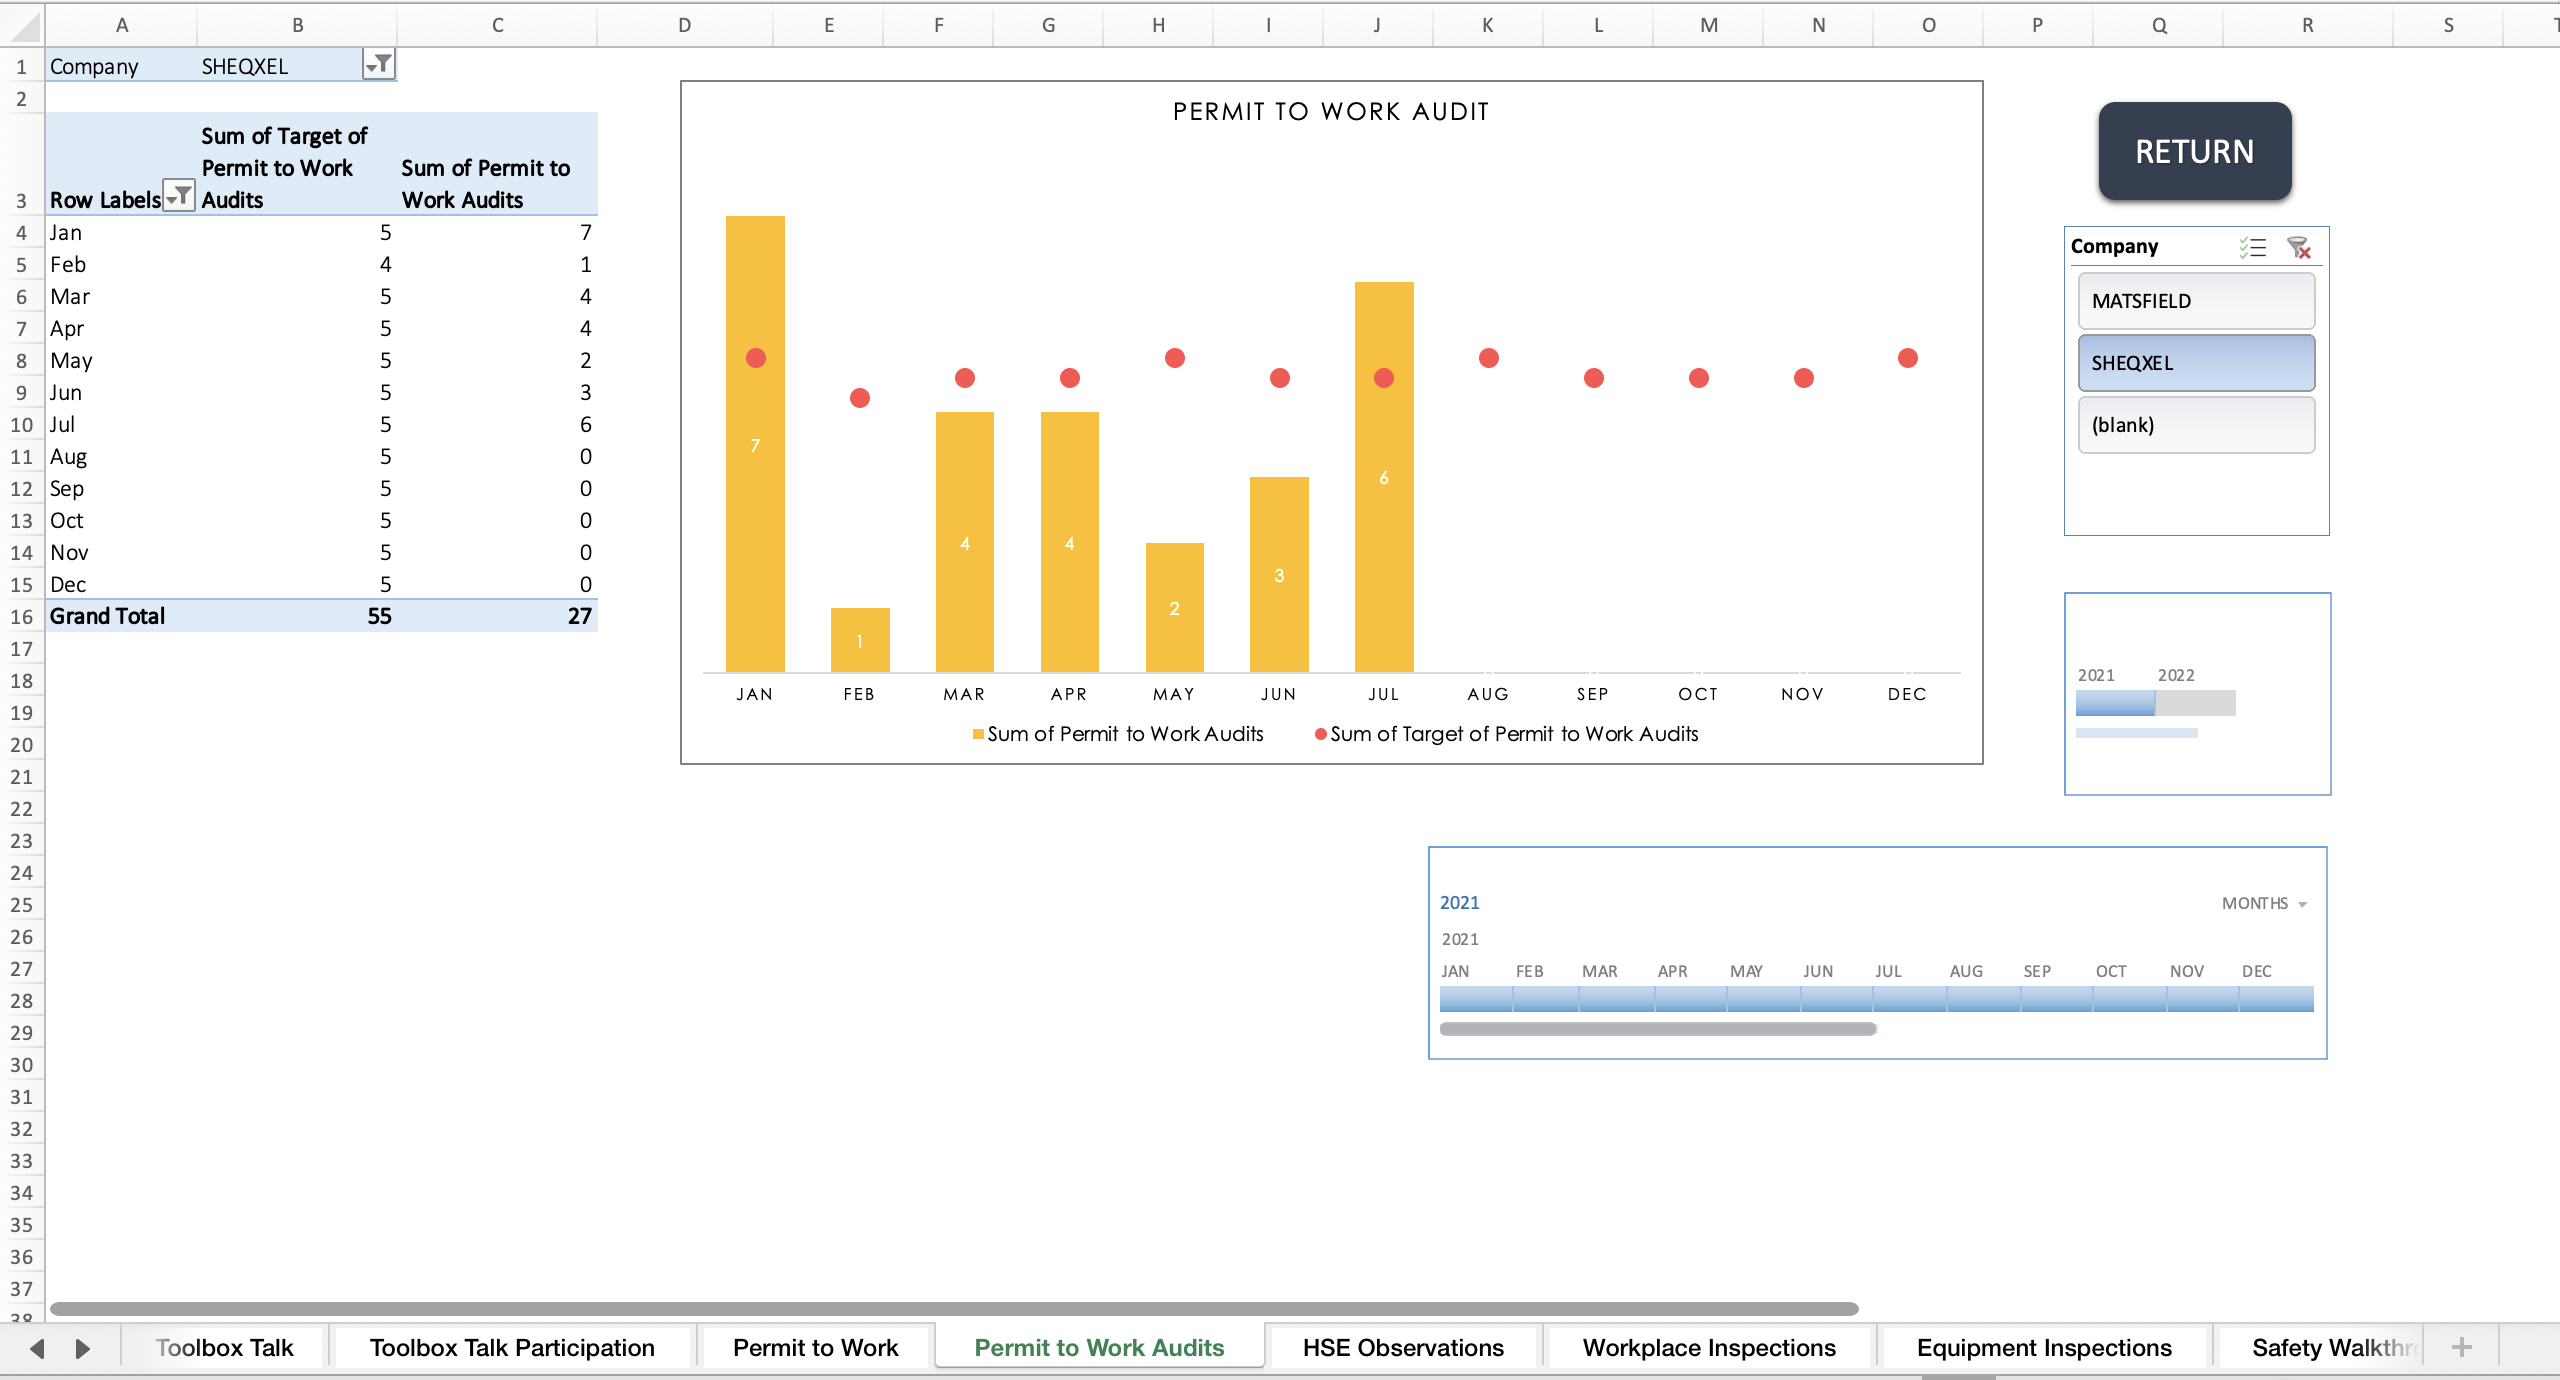
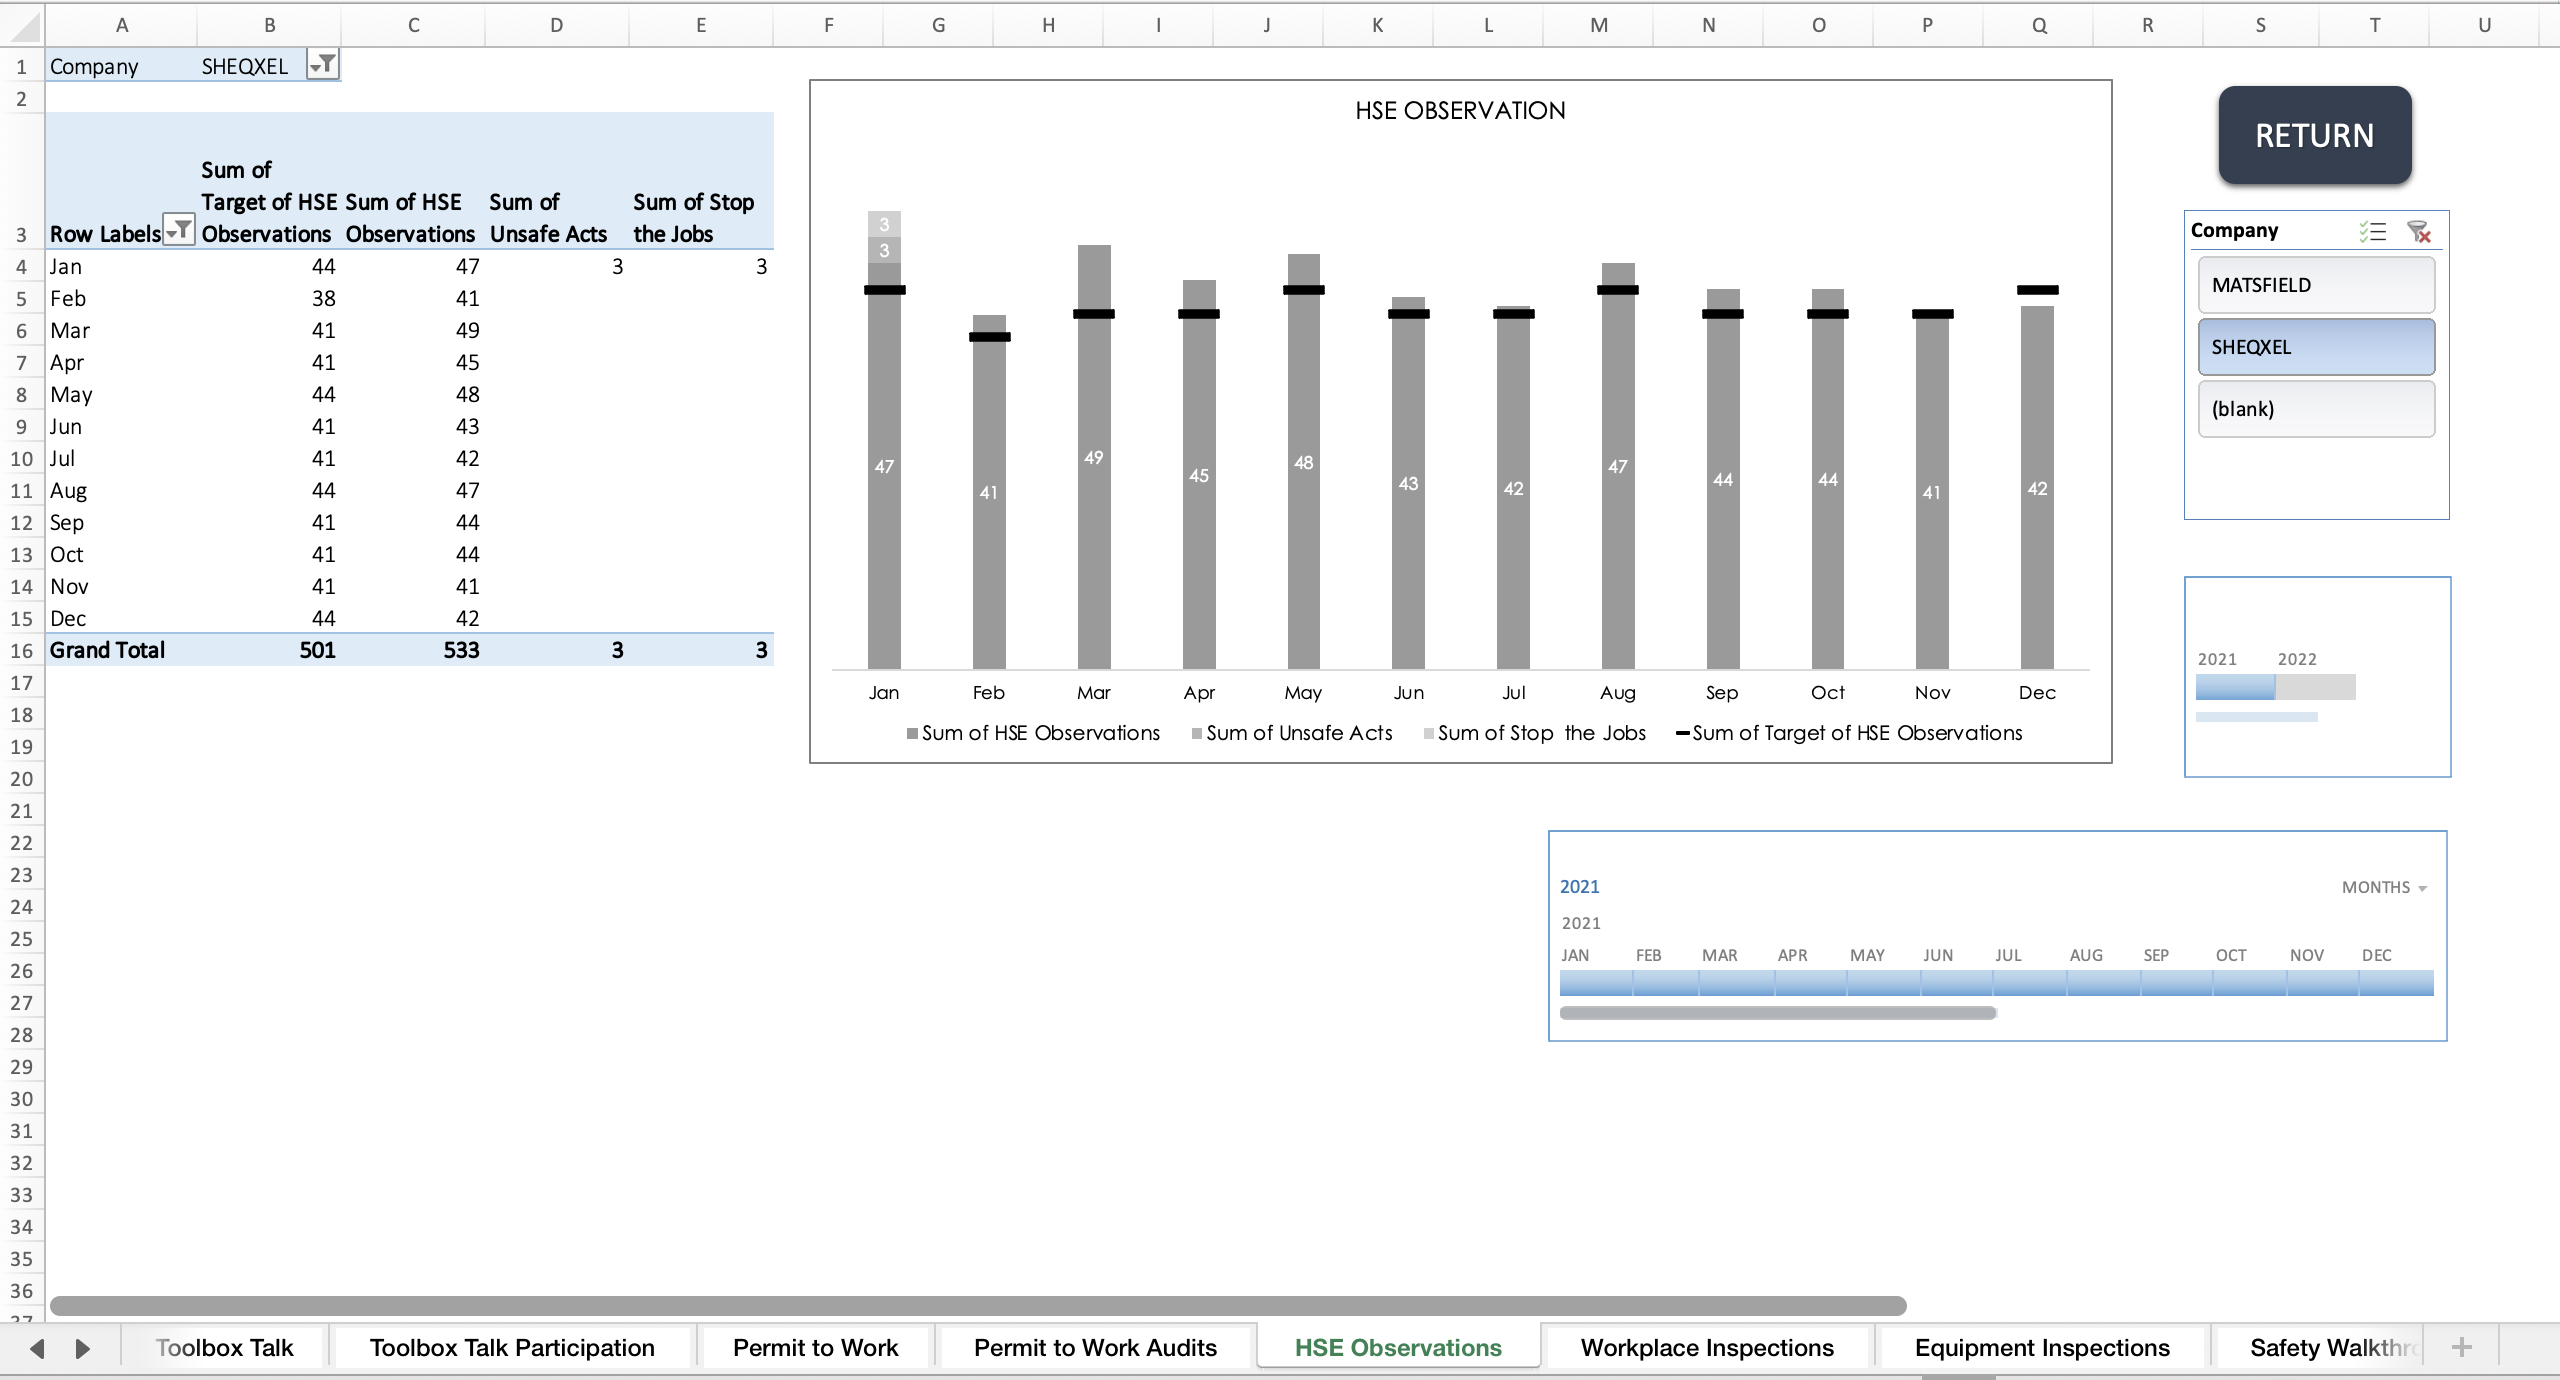
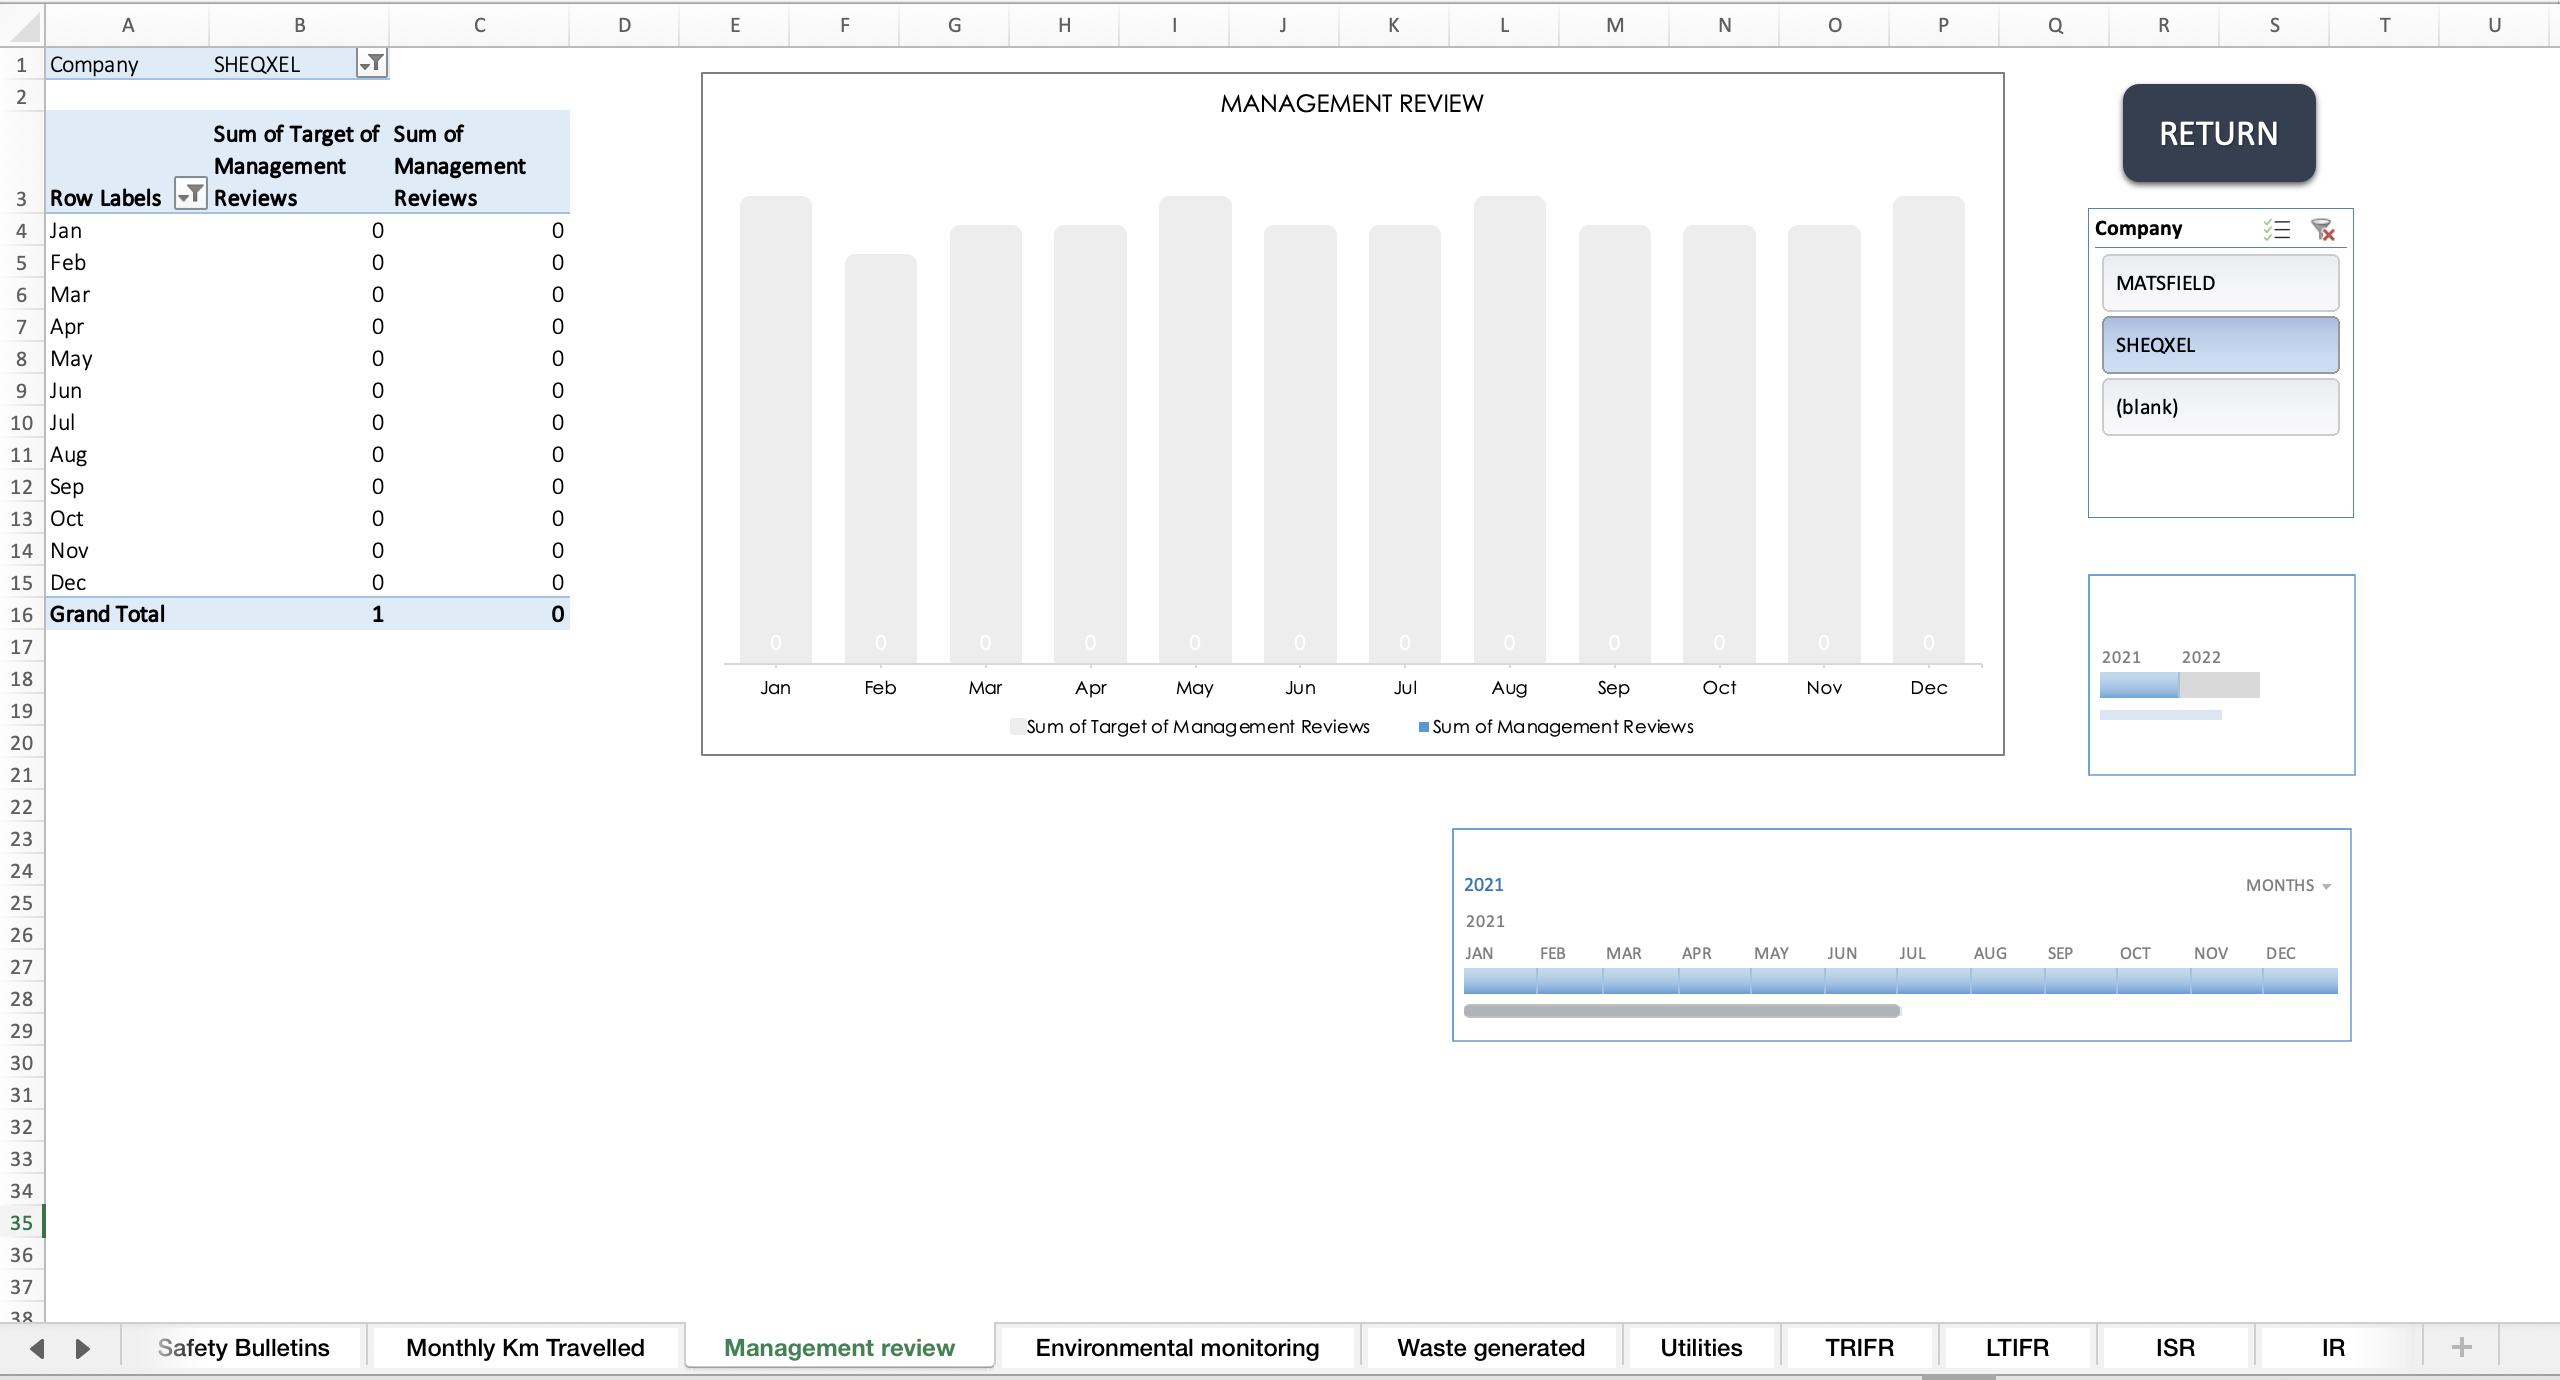
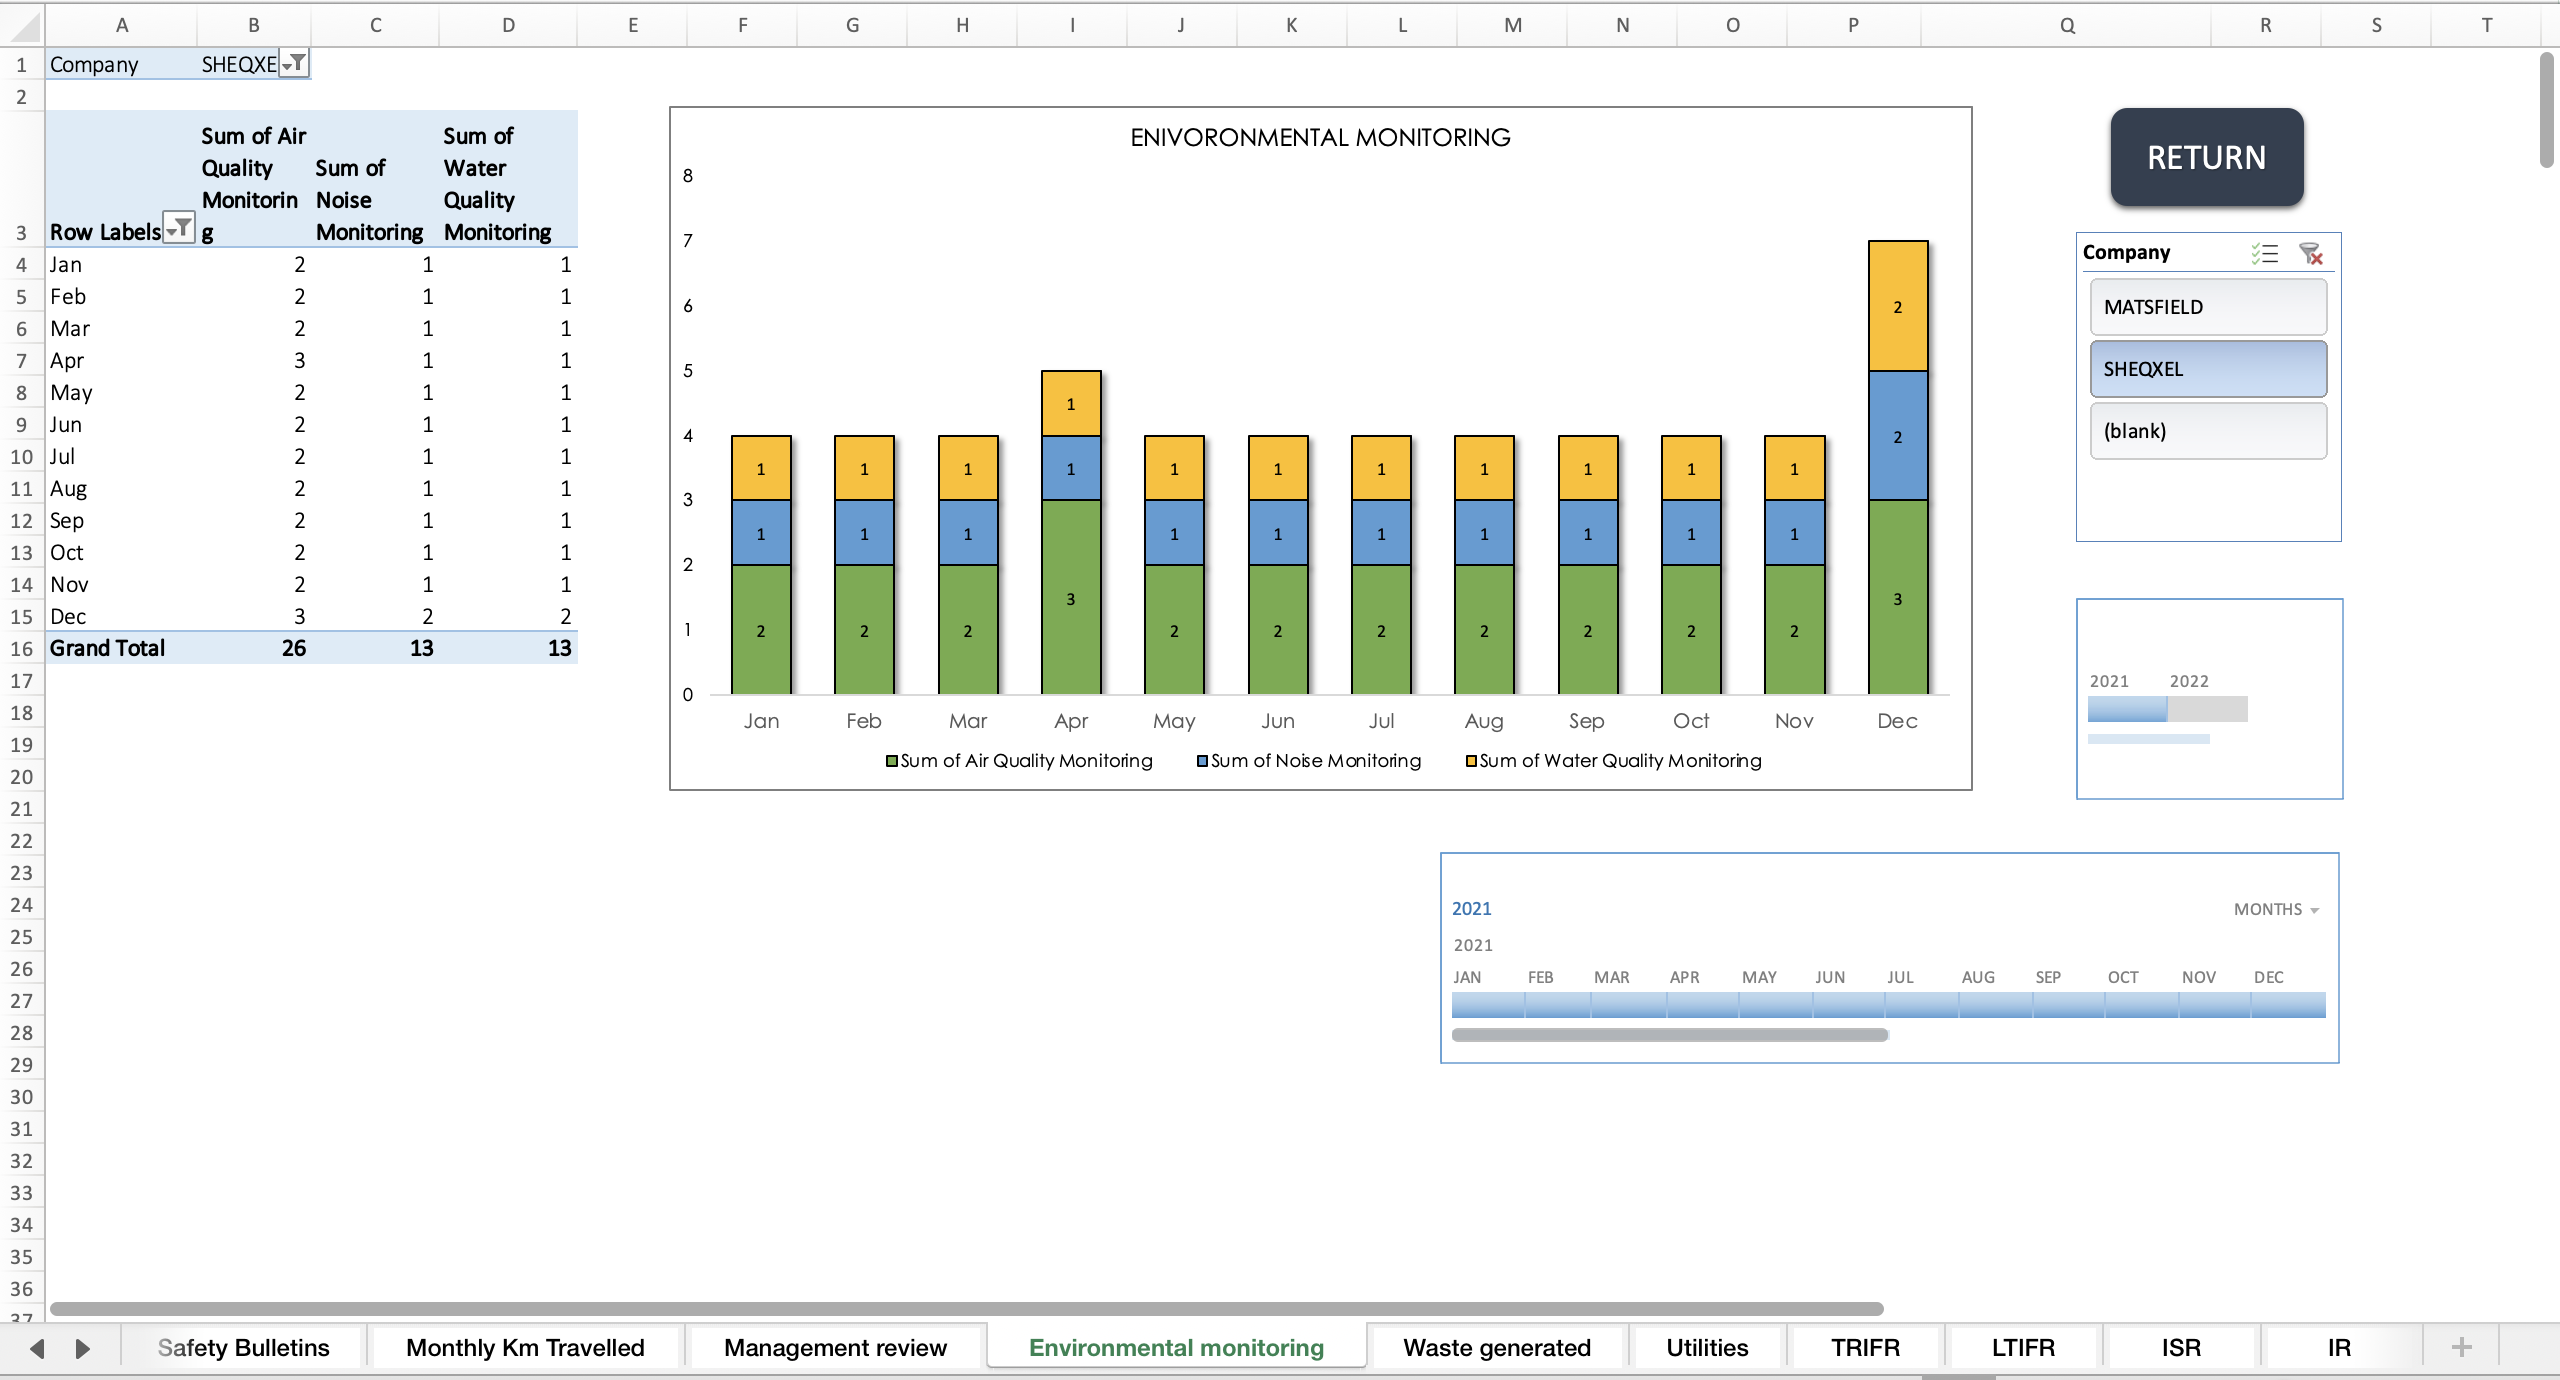
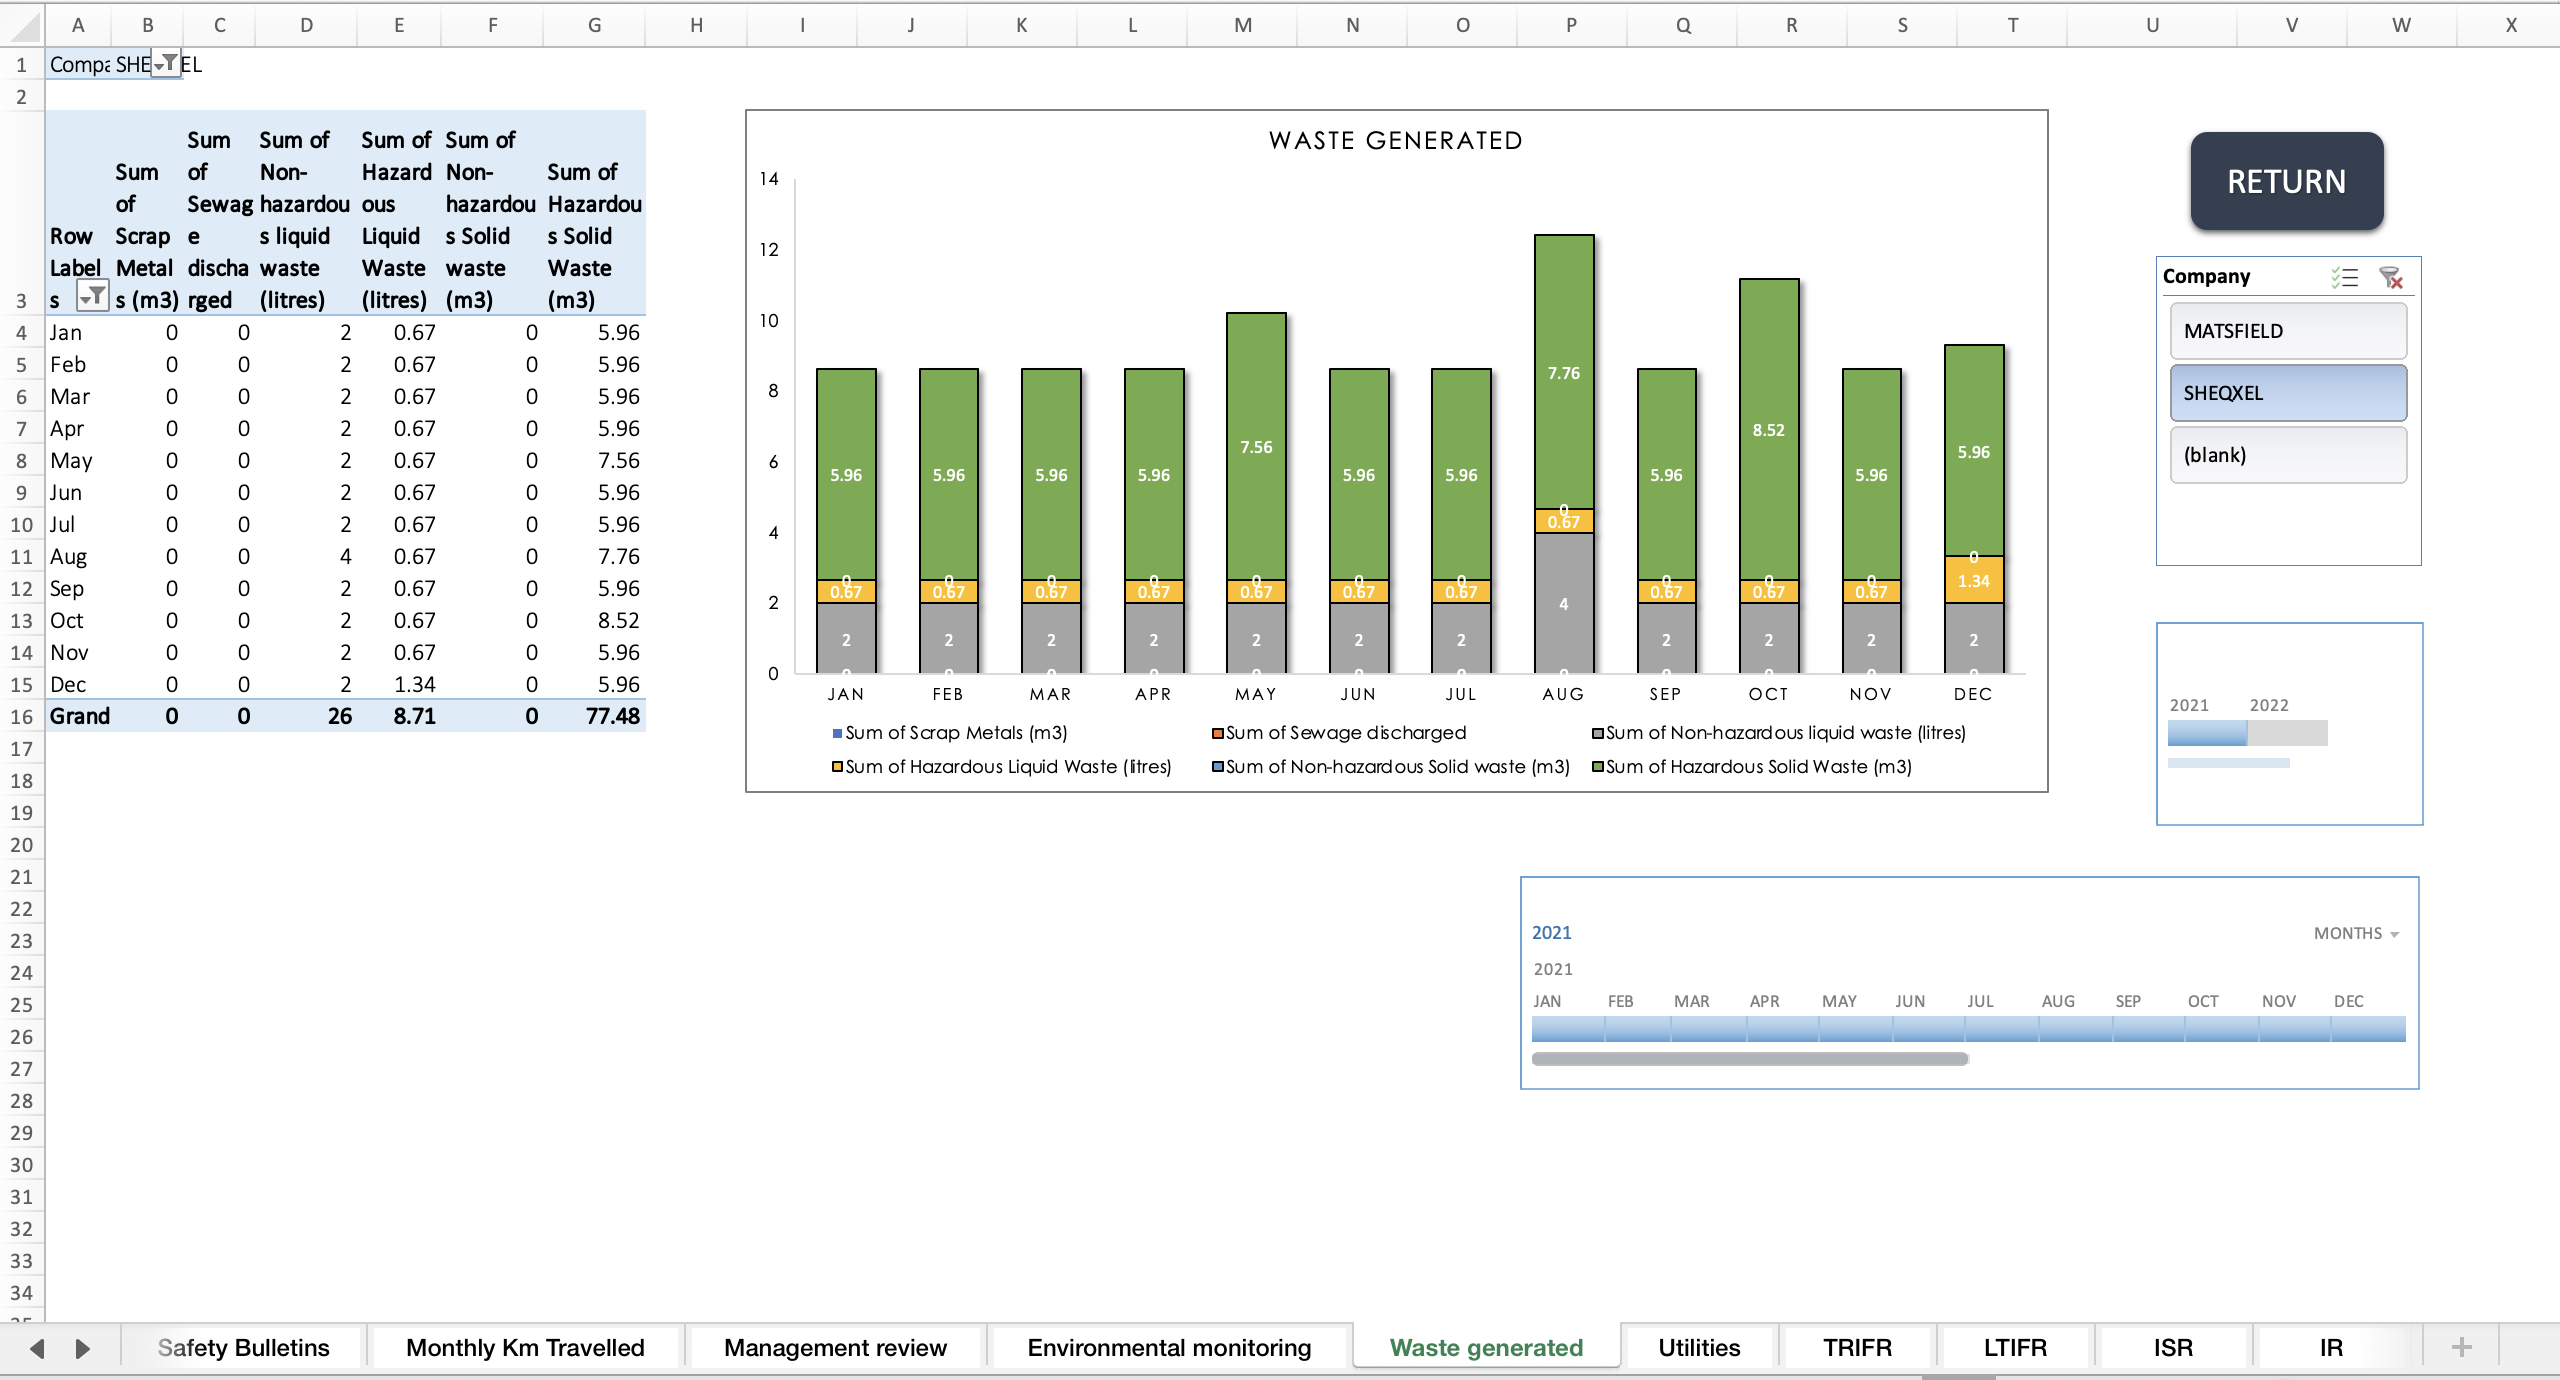
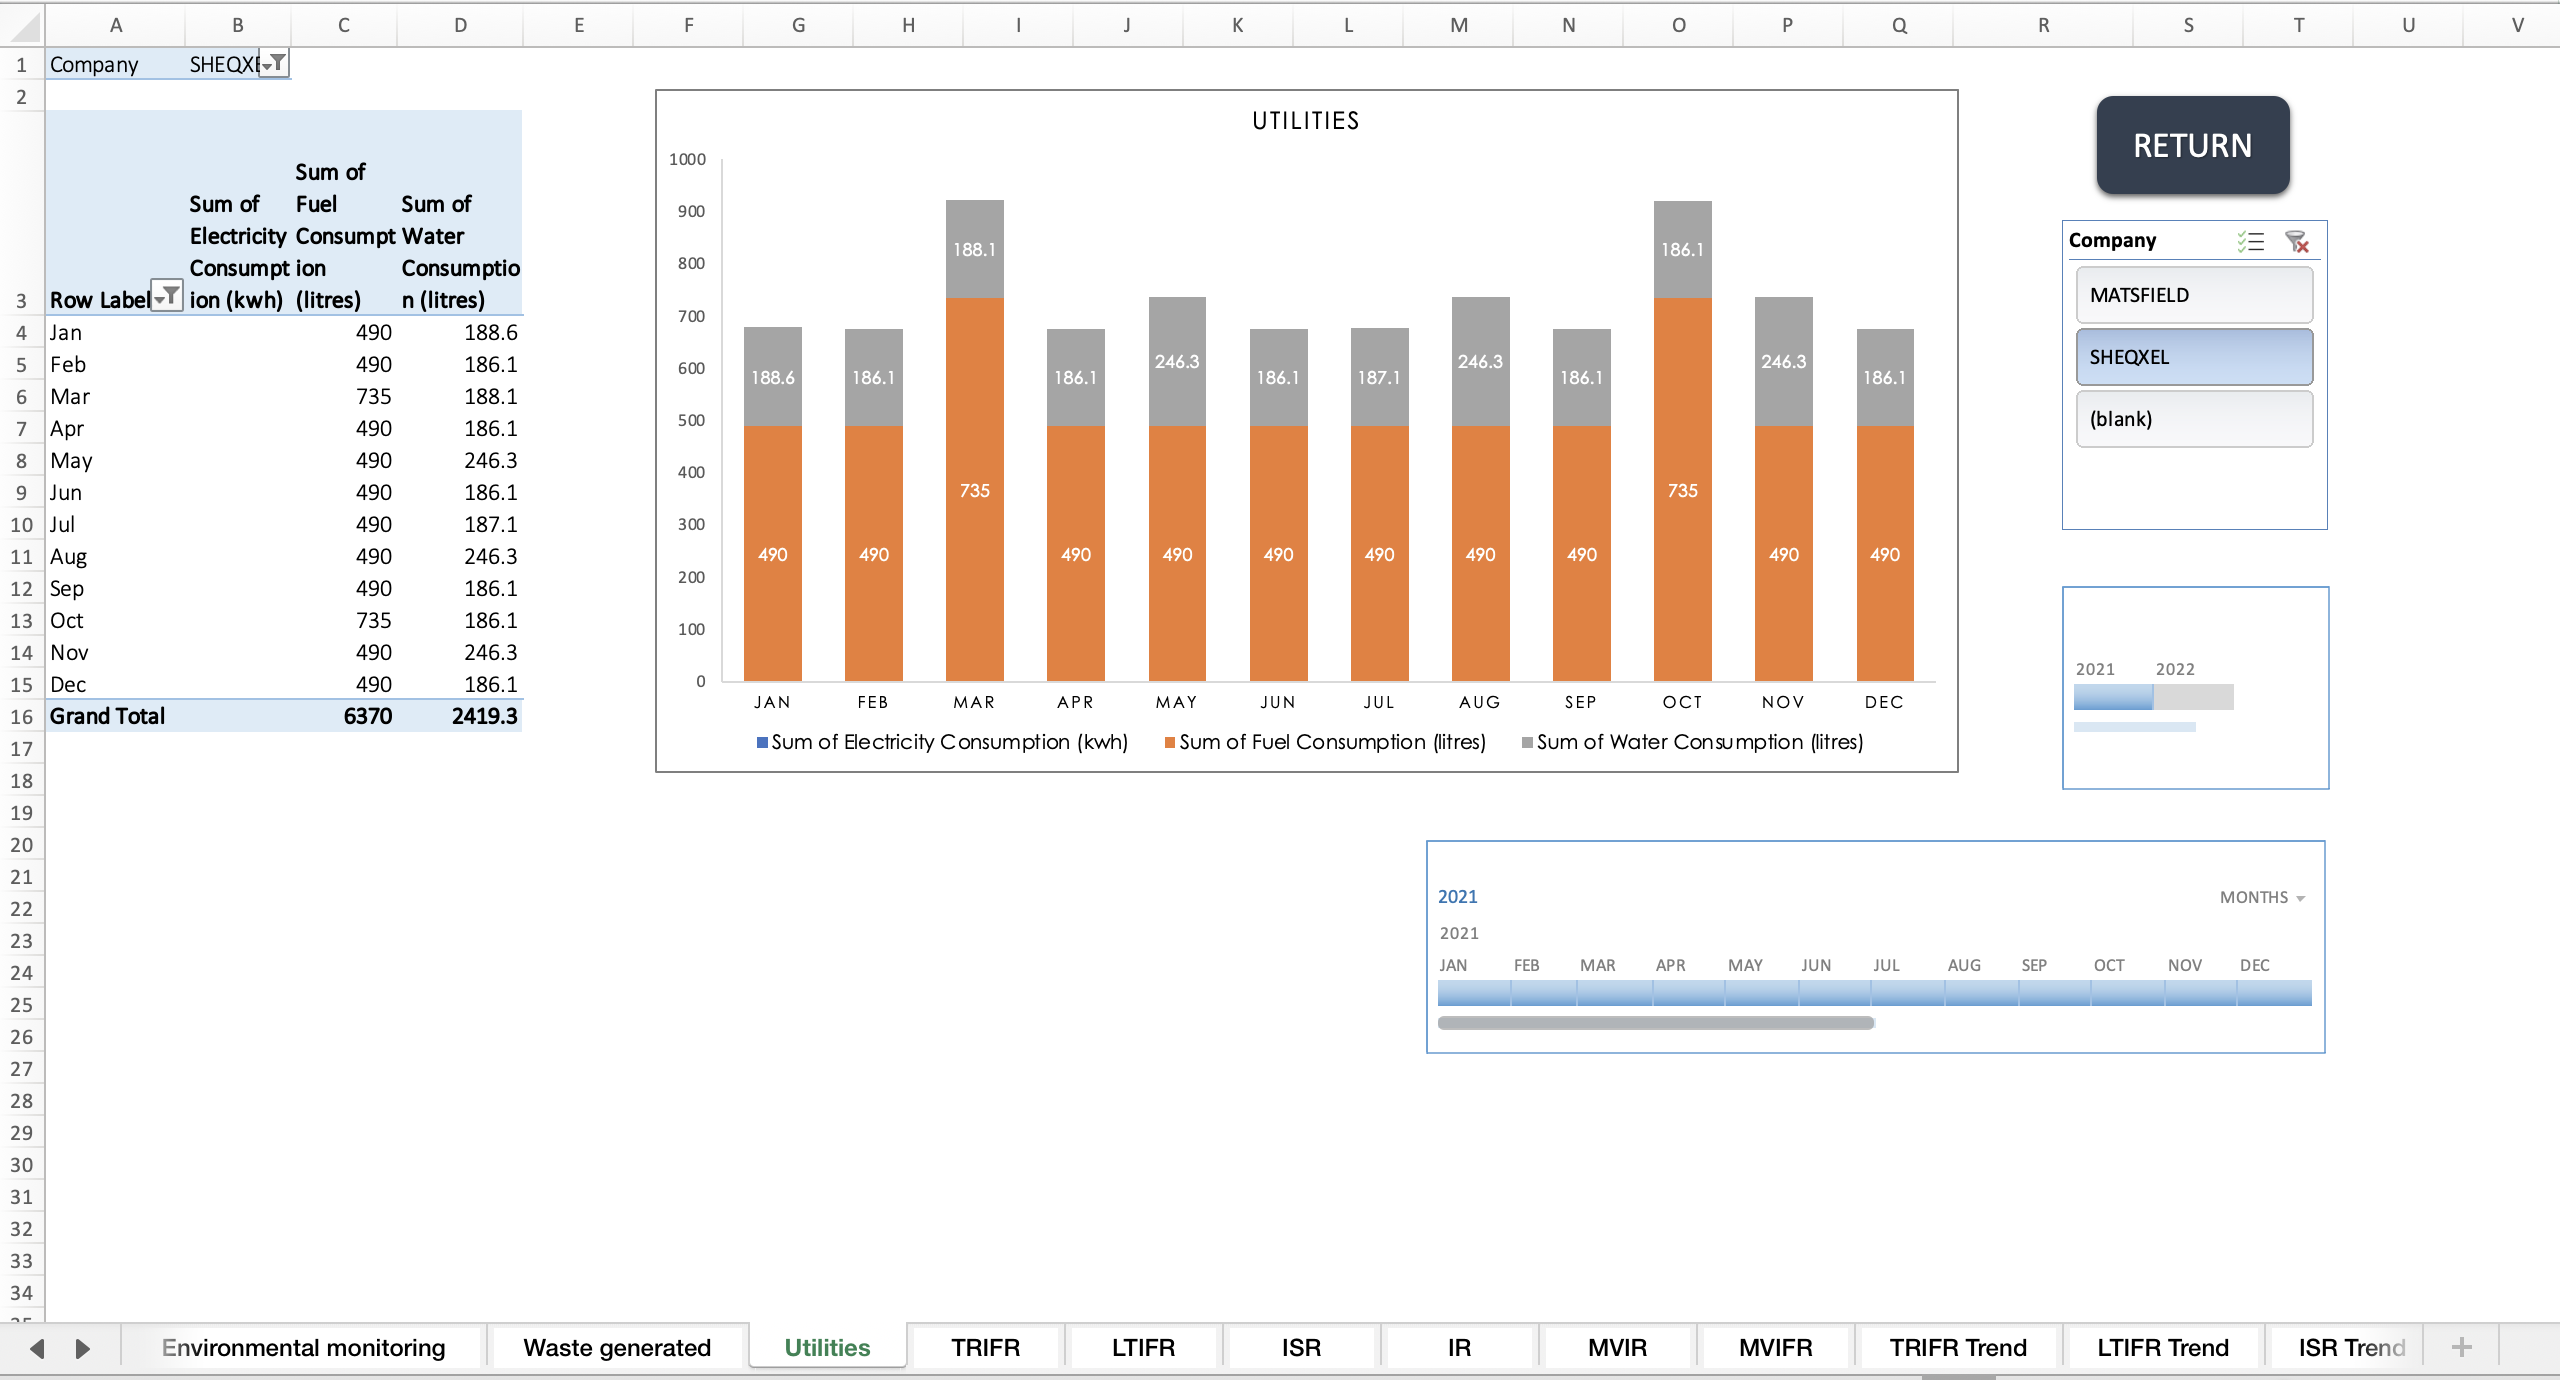
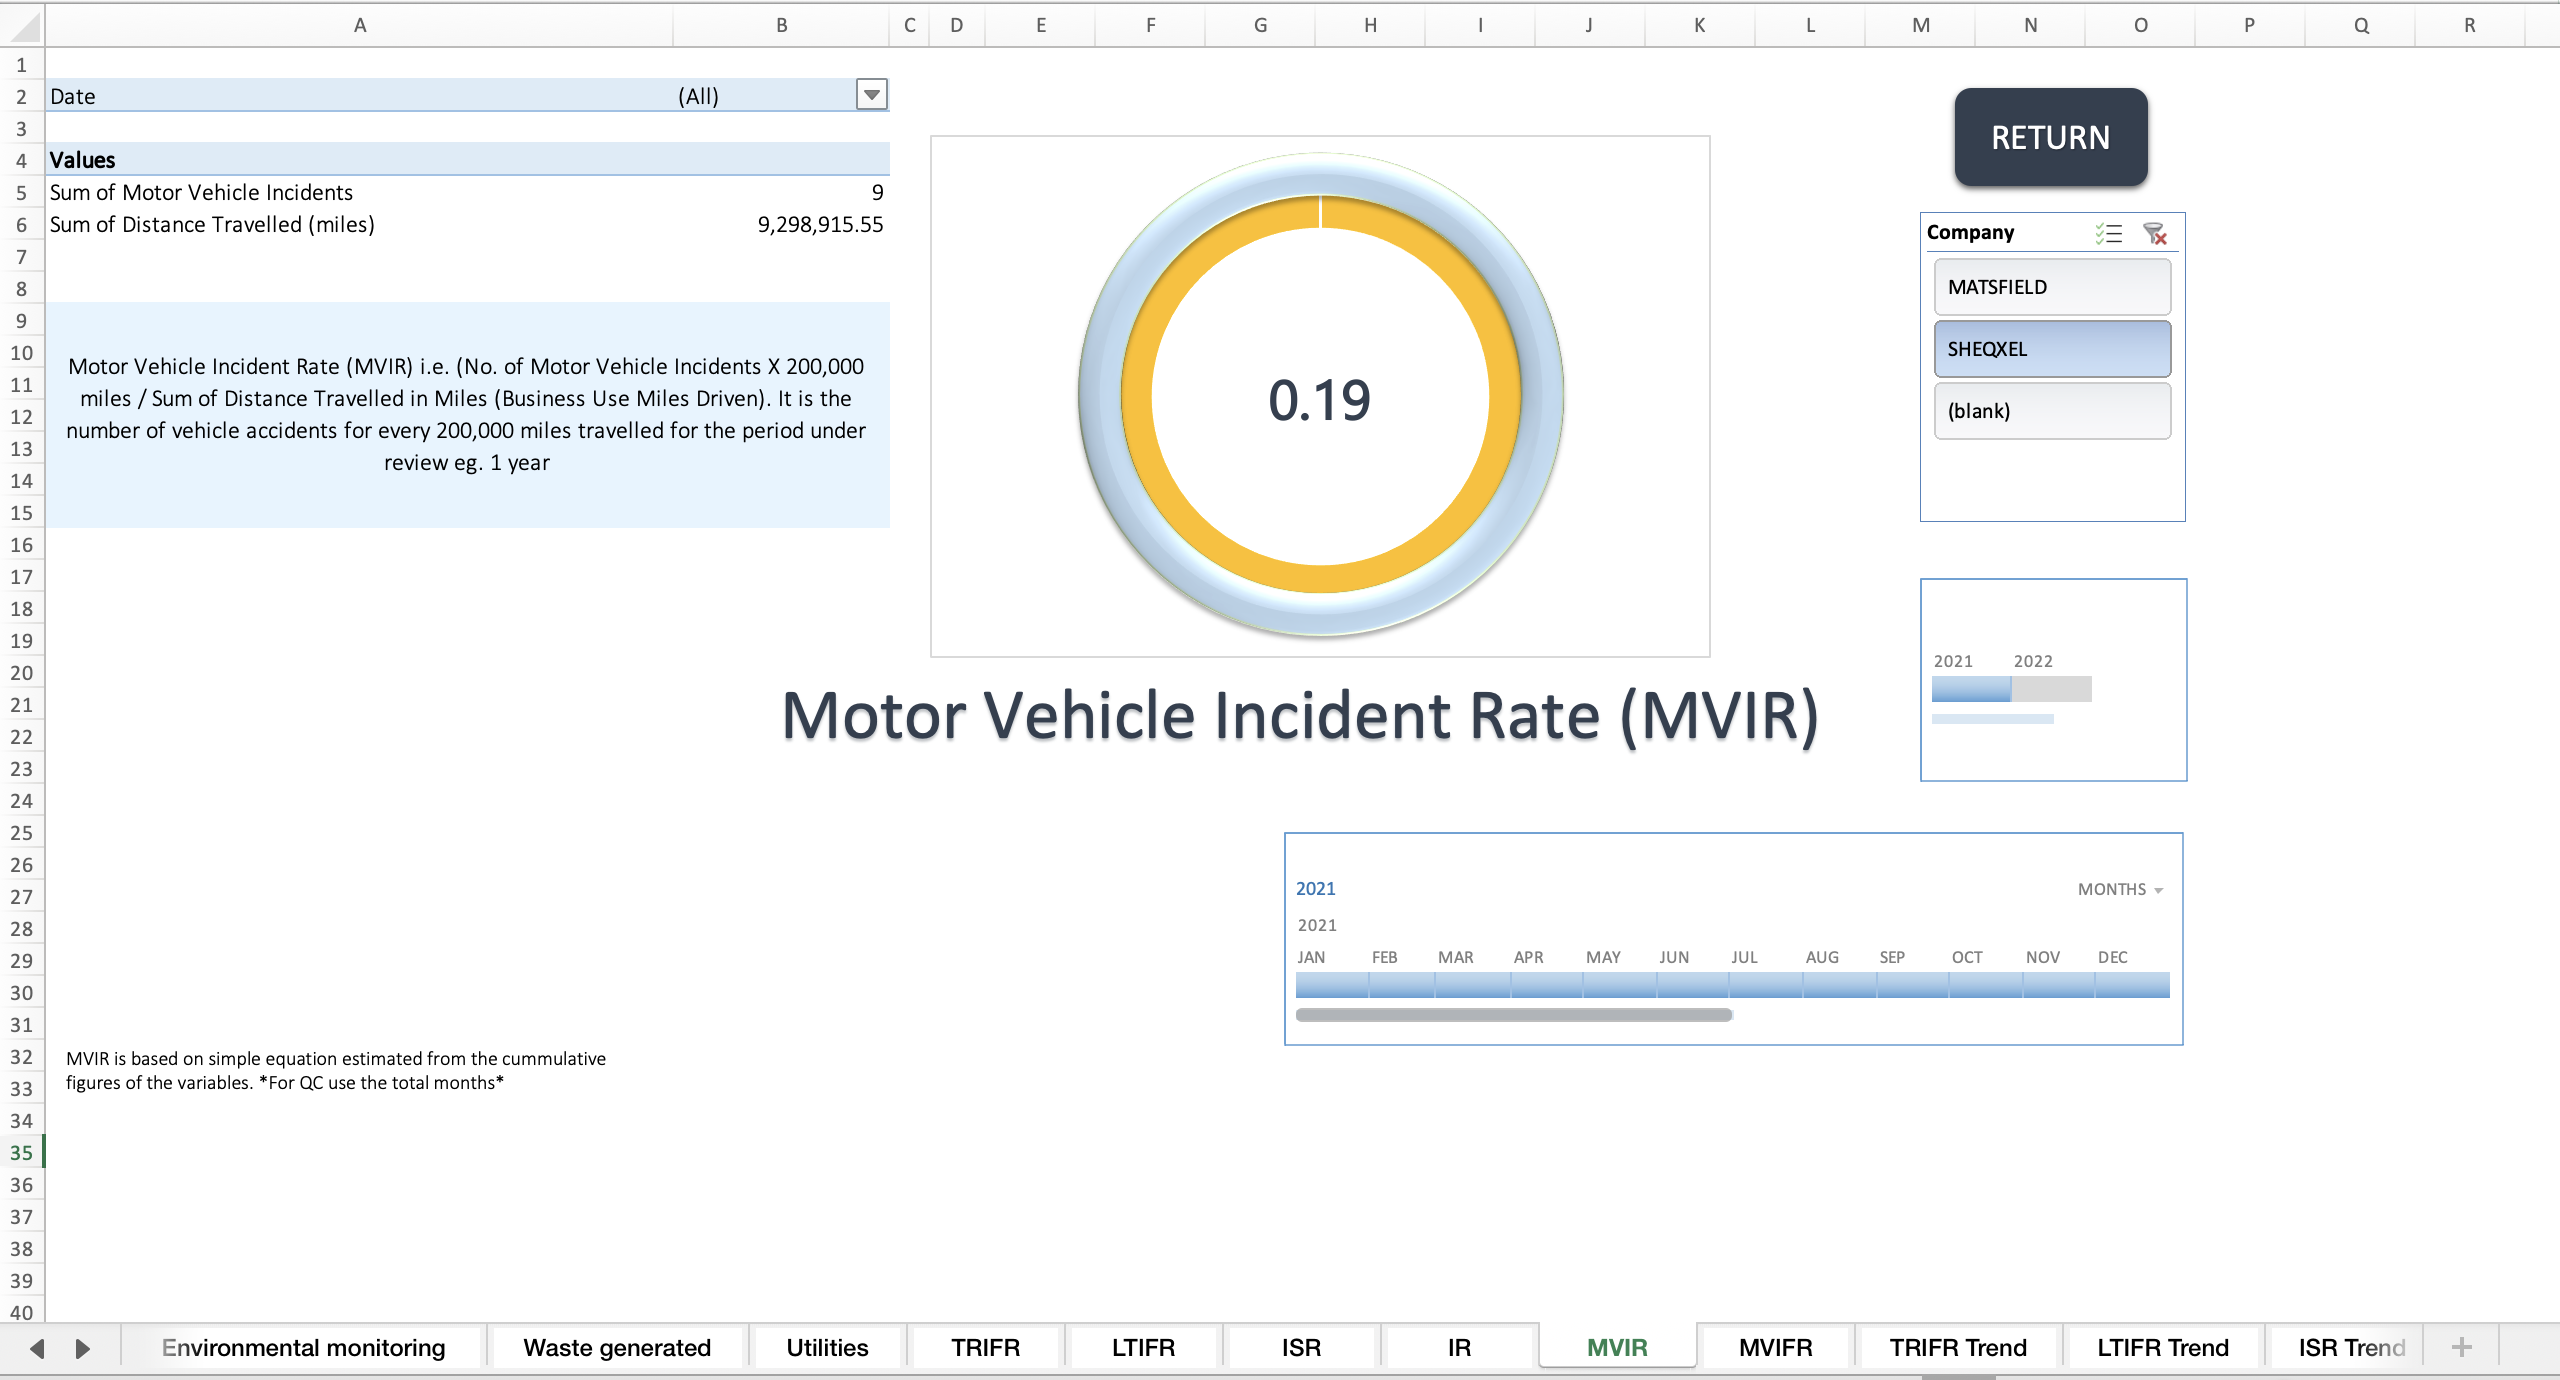
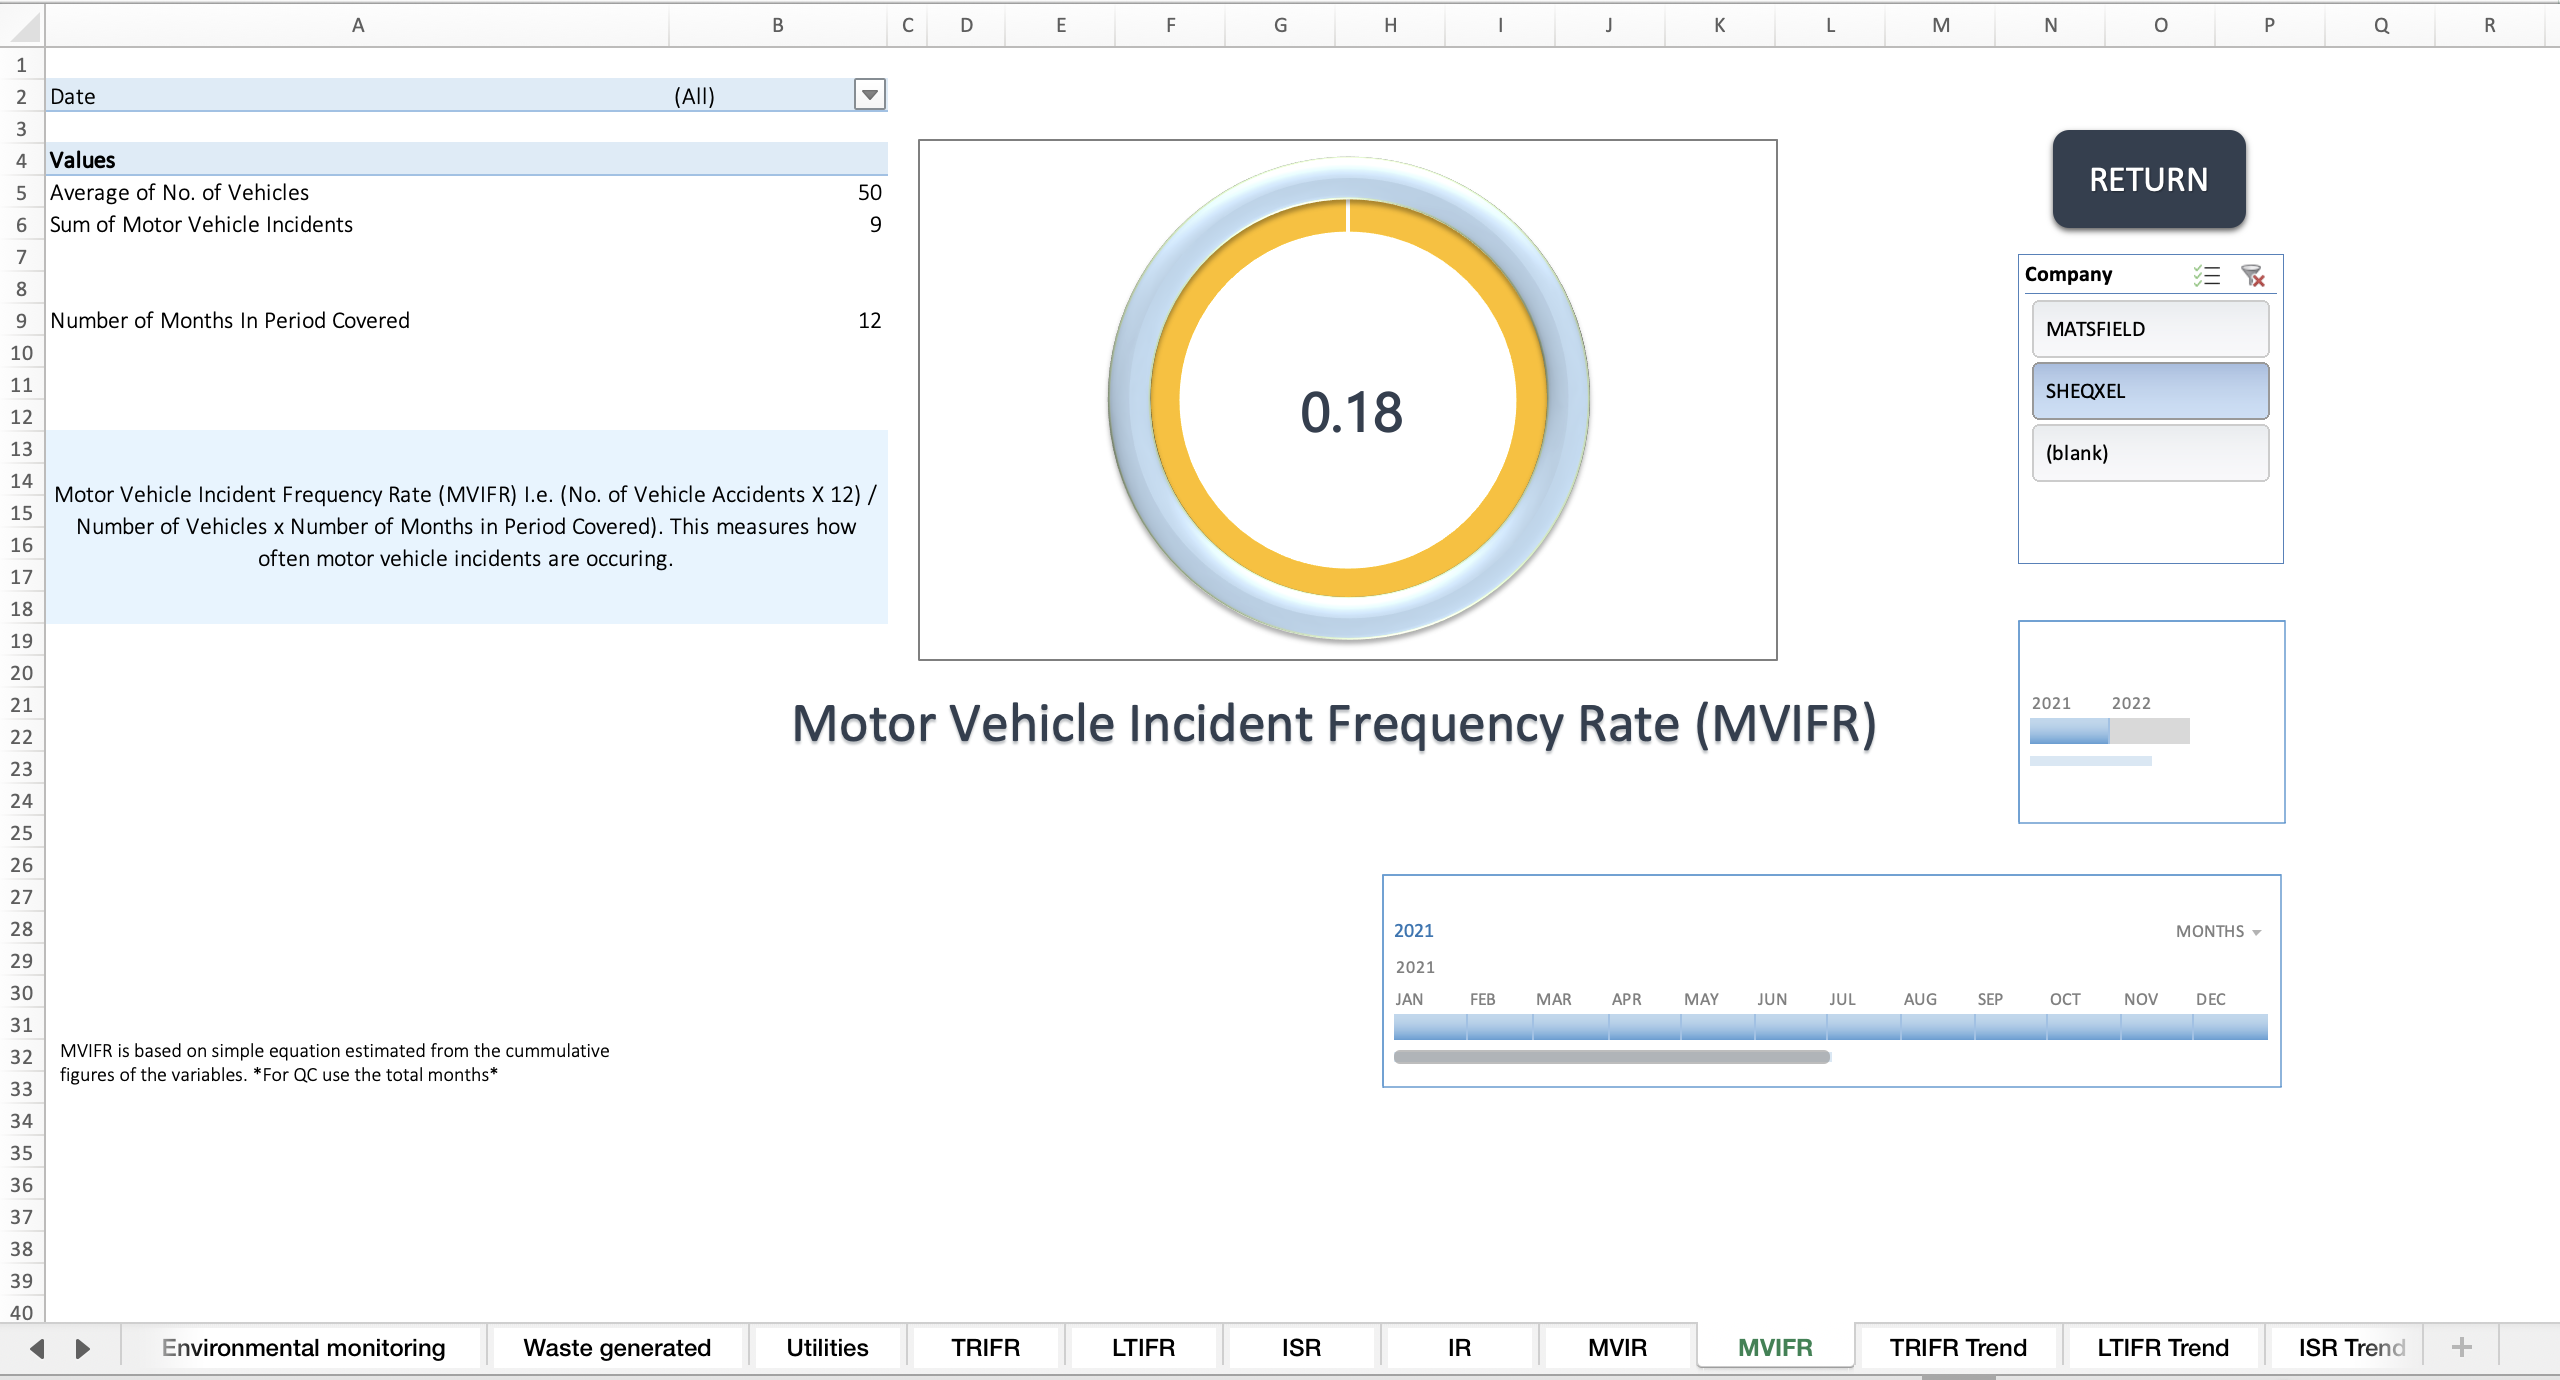
Dashboards
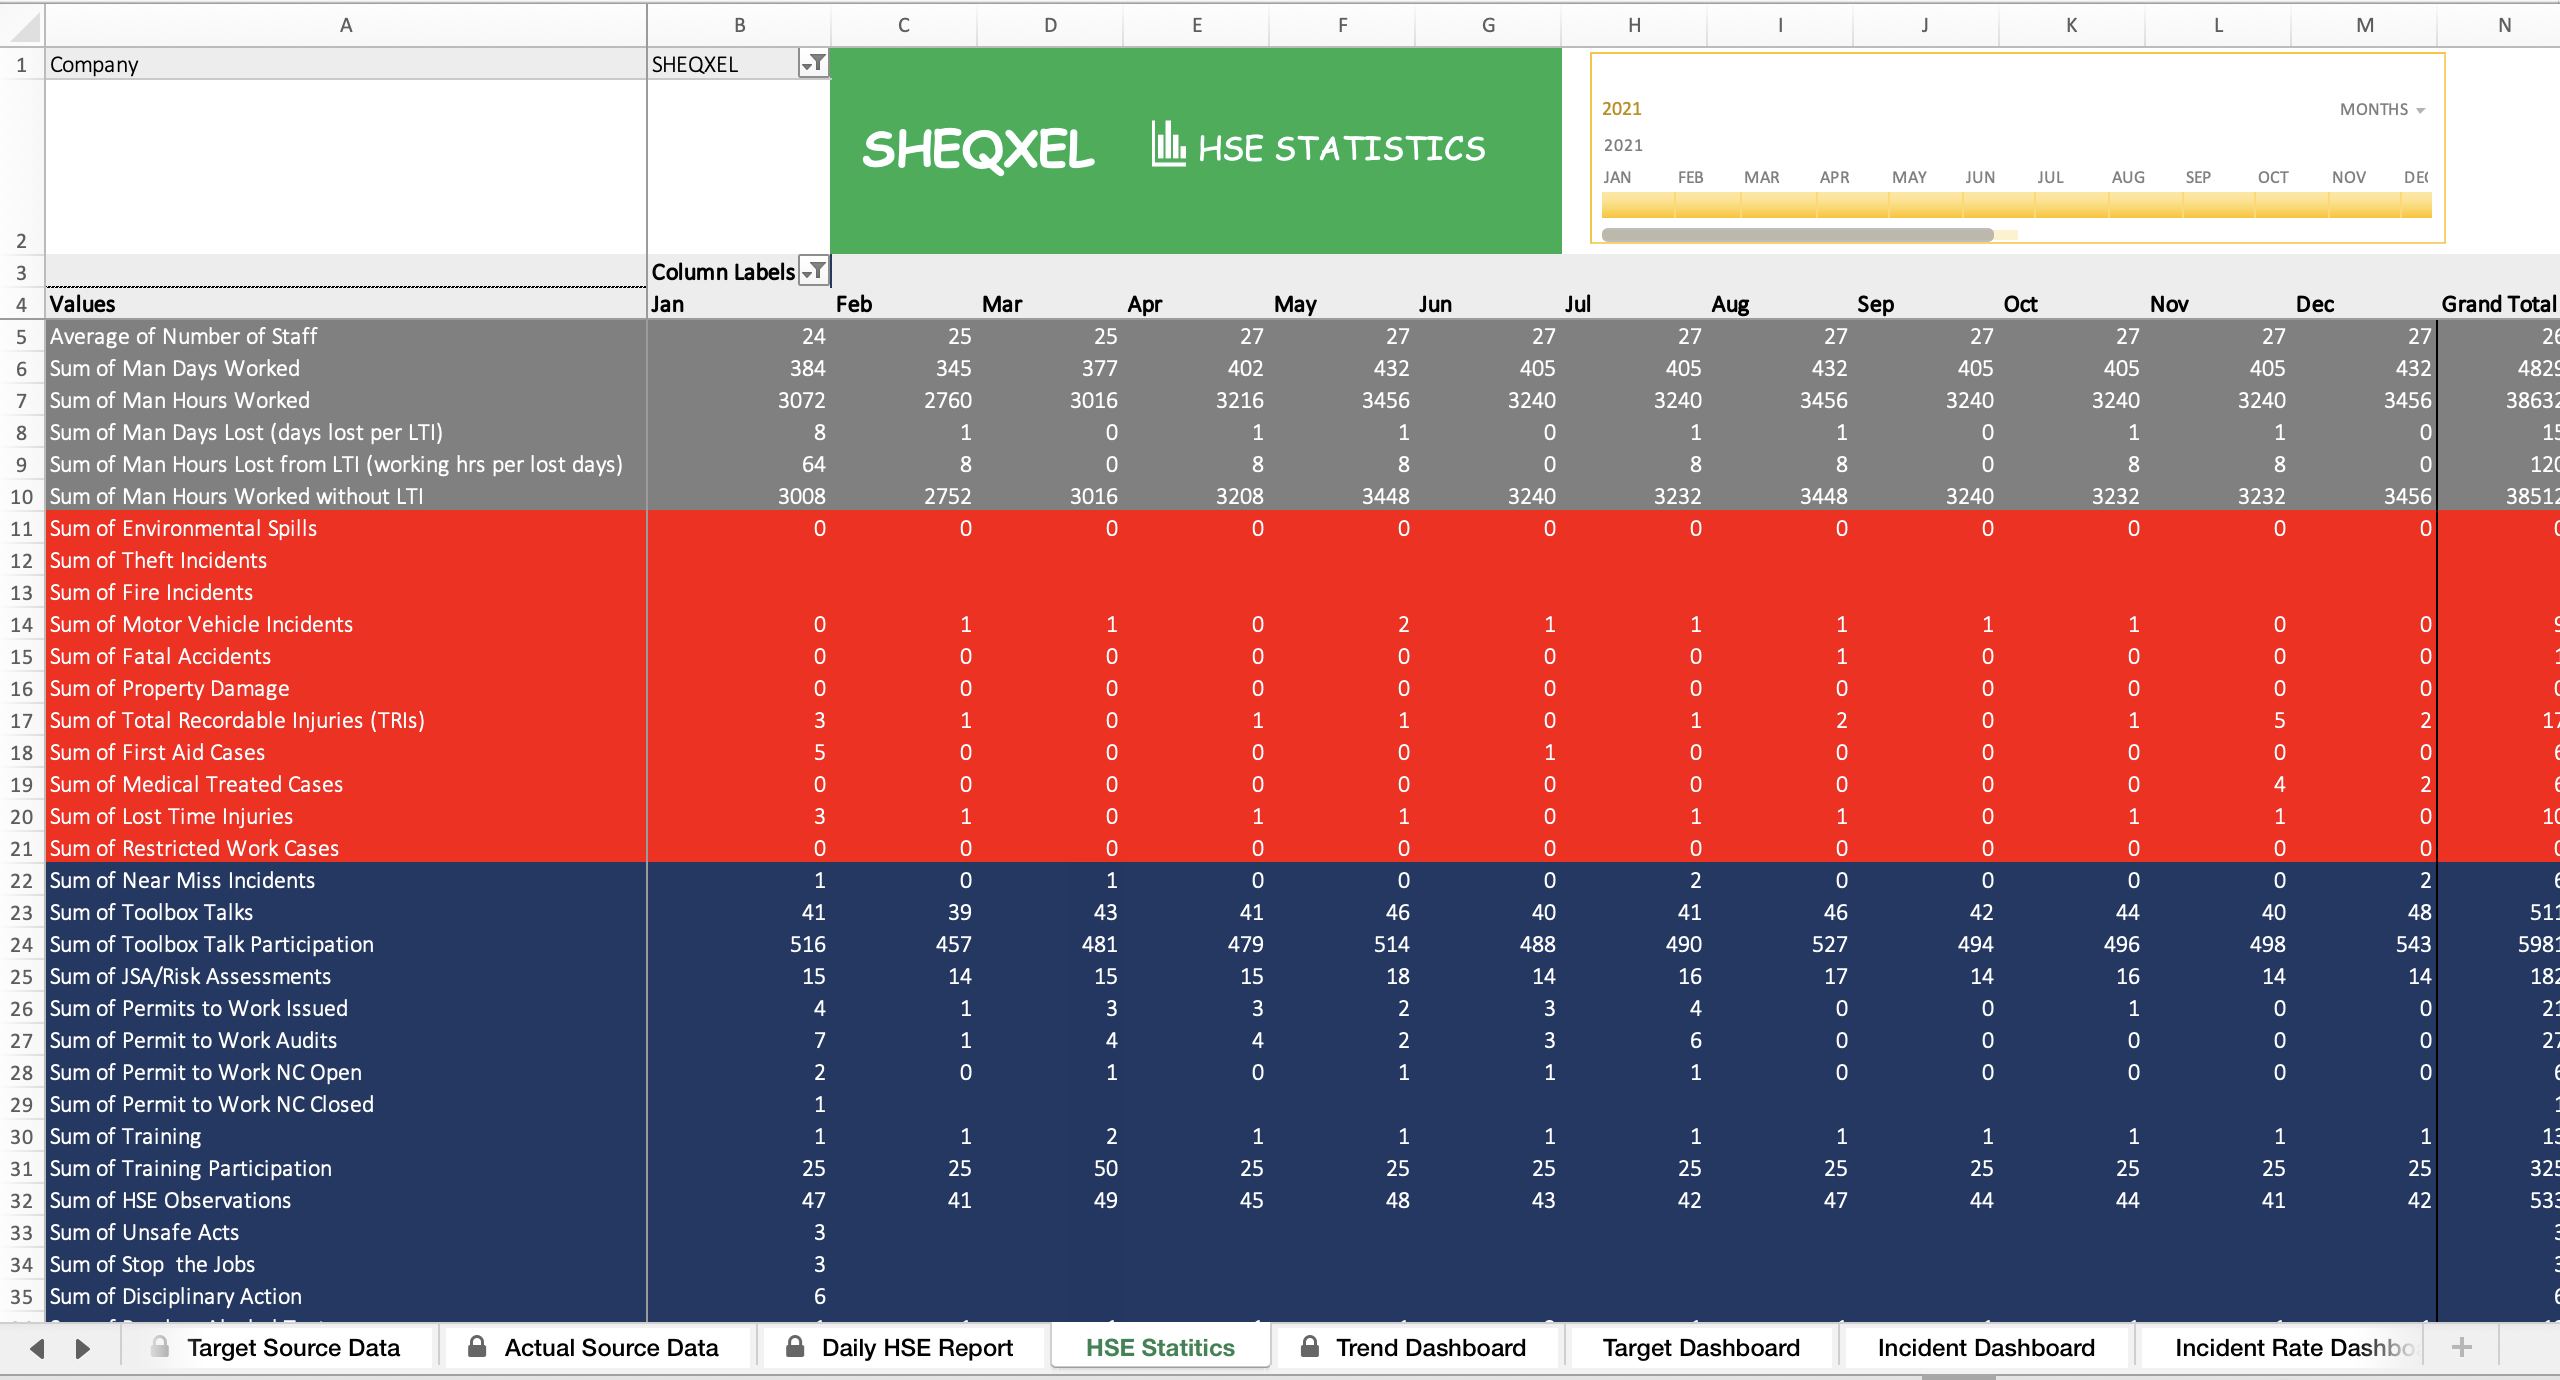
Various Reports (Pivot tables and charts)
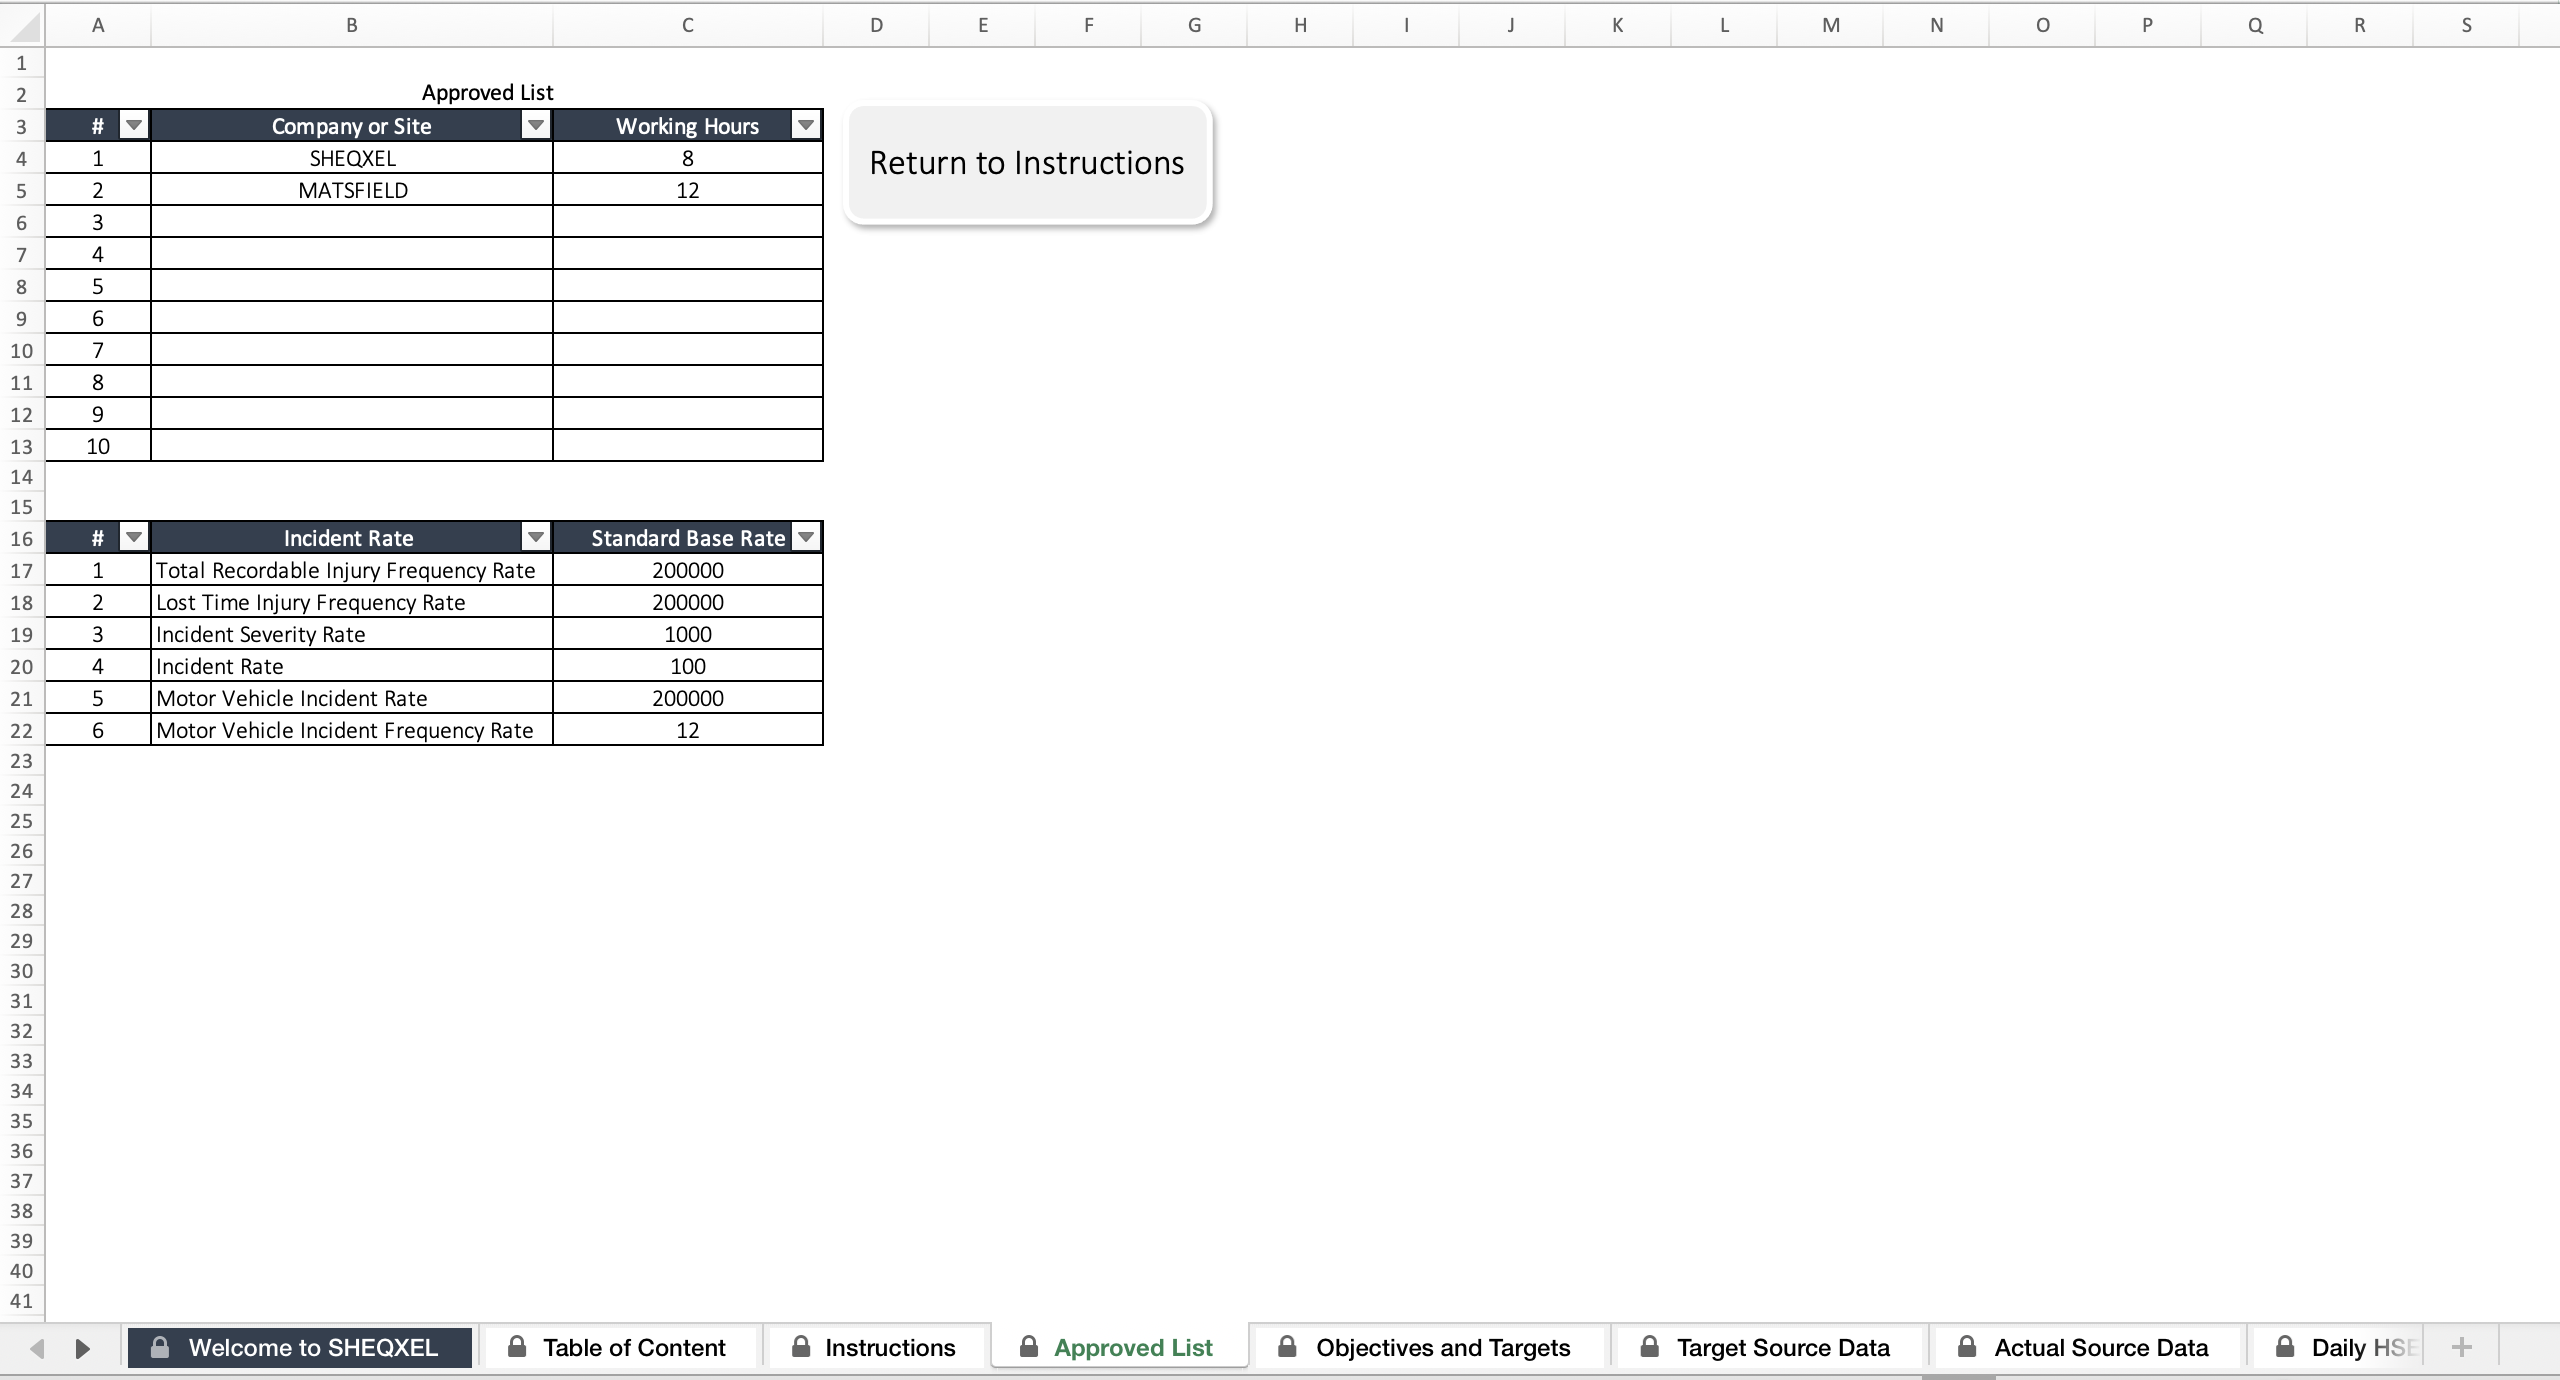
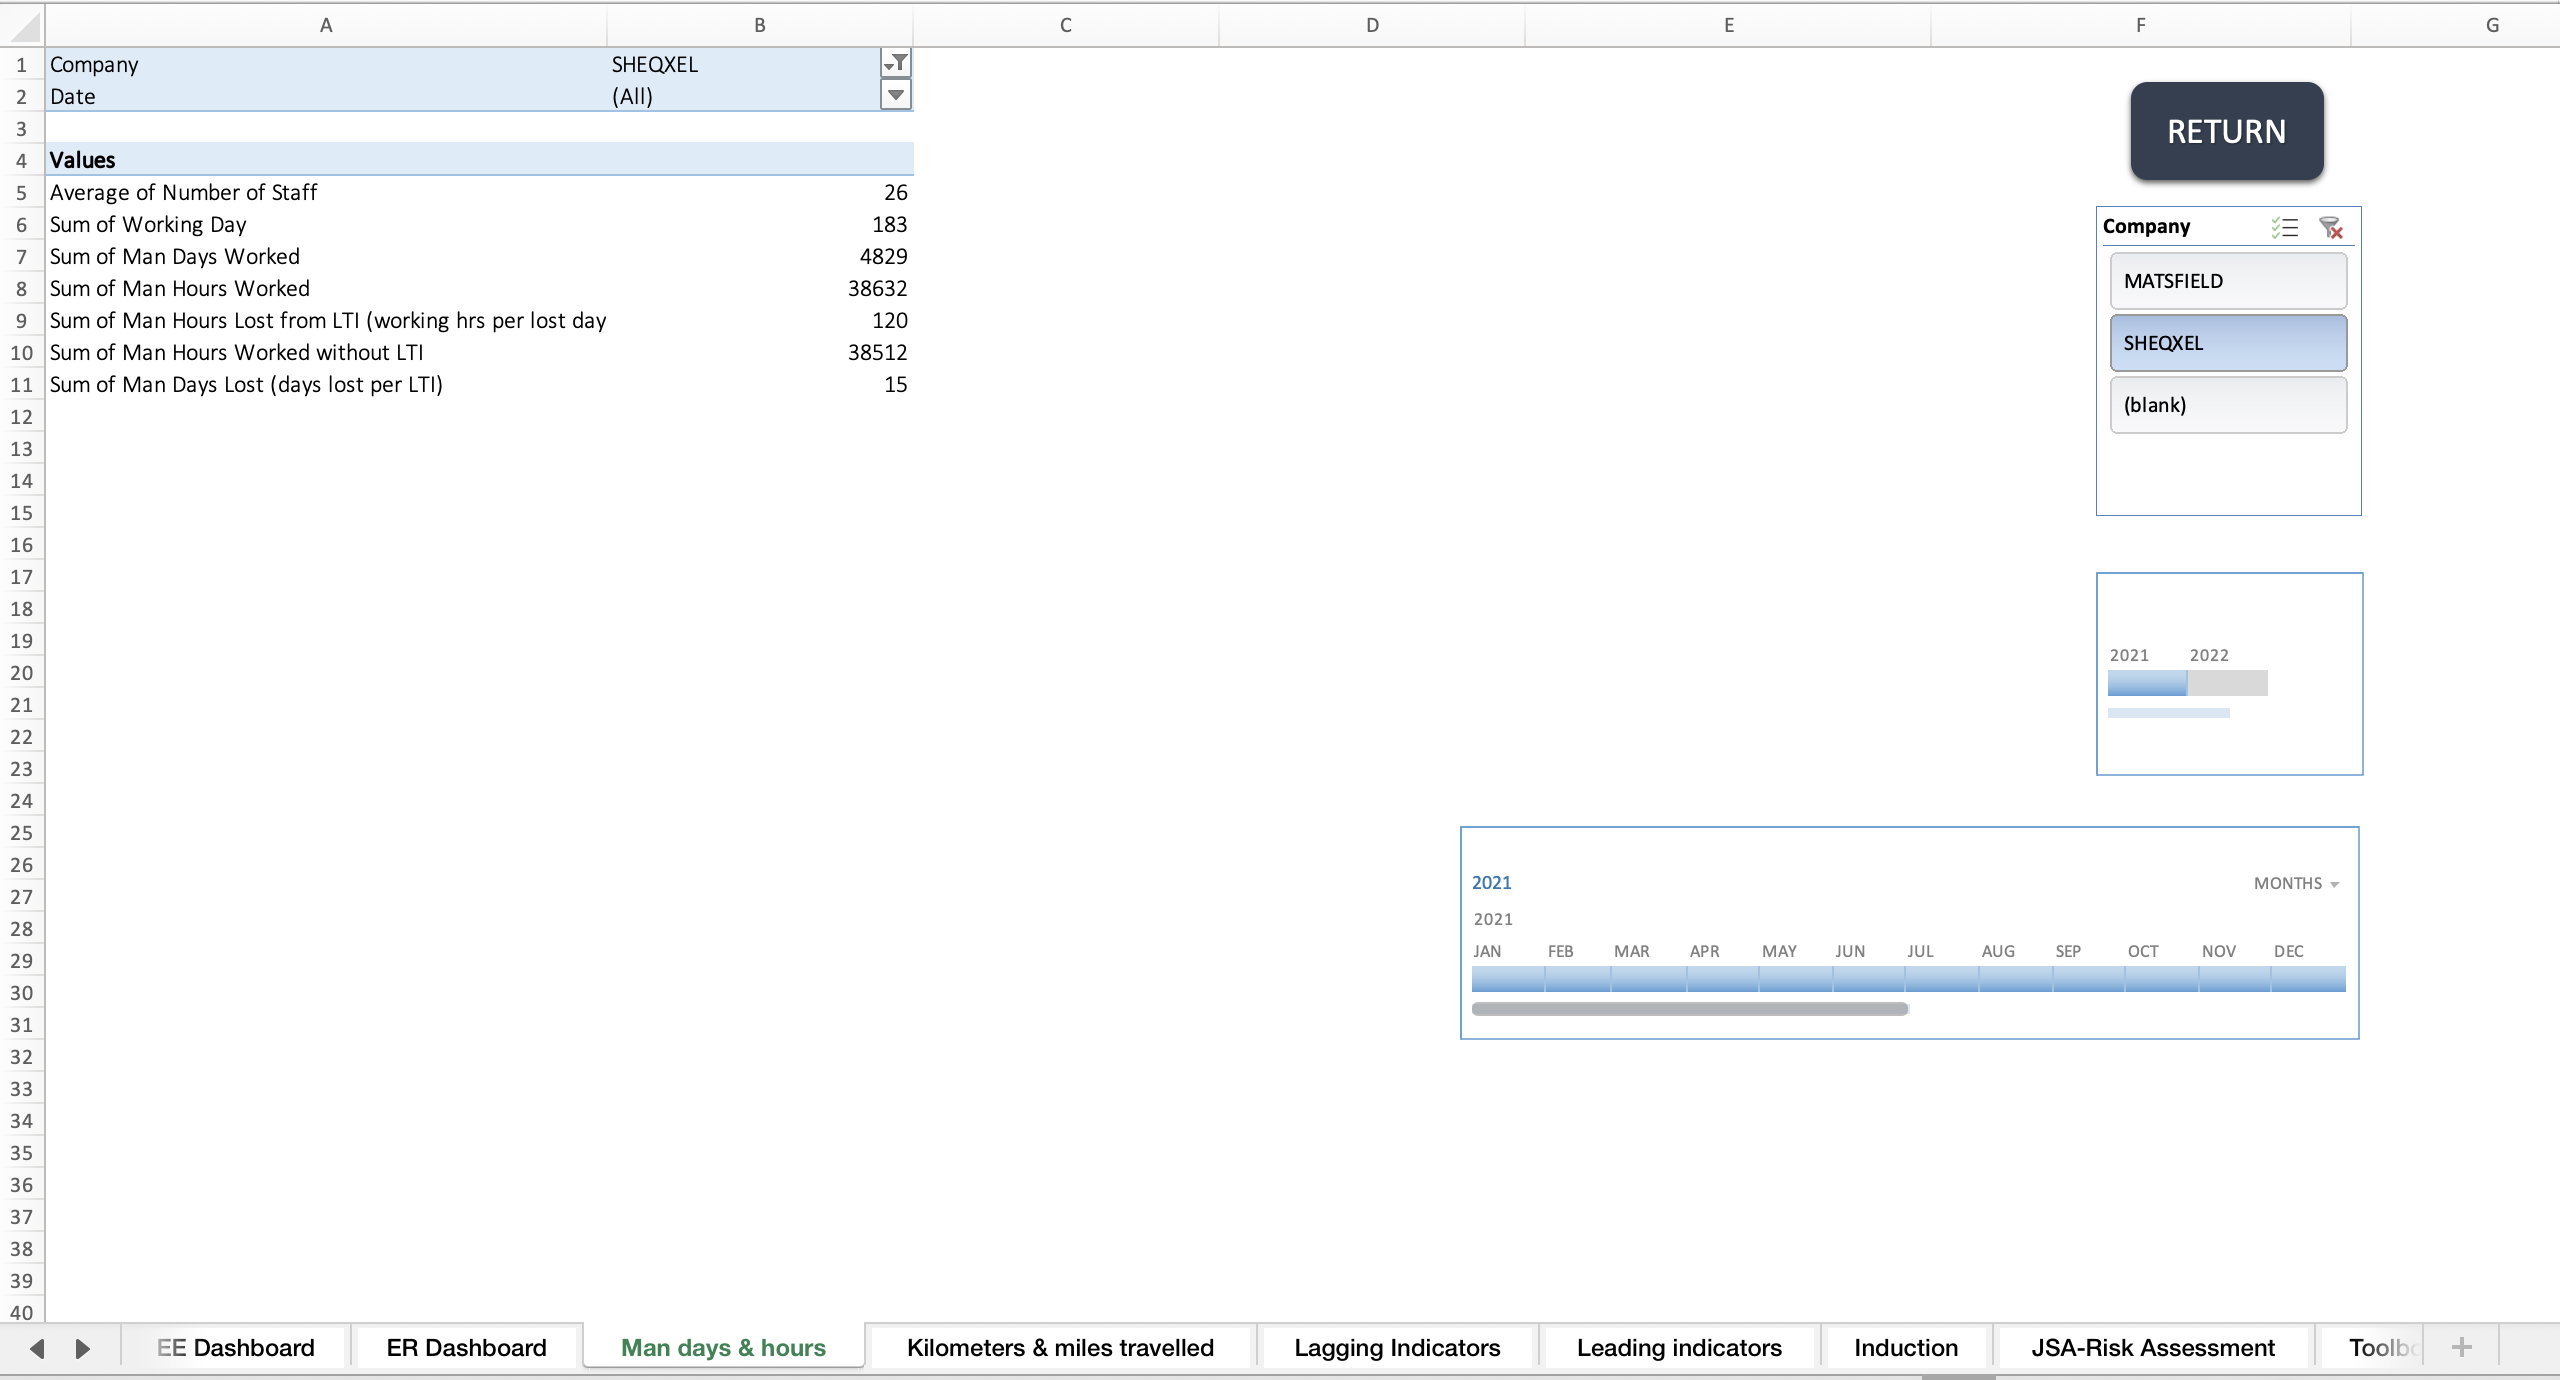
This sheet is where you input key data such as:
Number of Employees
Man Days
Man Hours Worked
Other relevant indicators
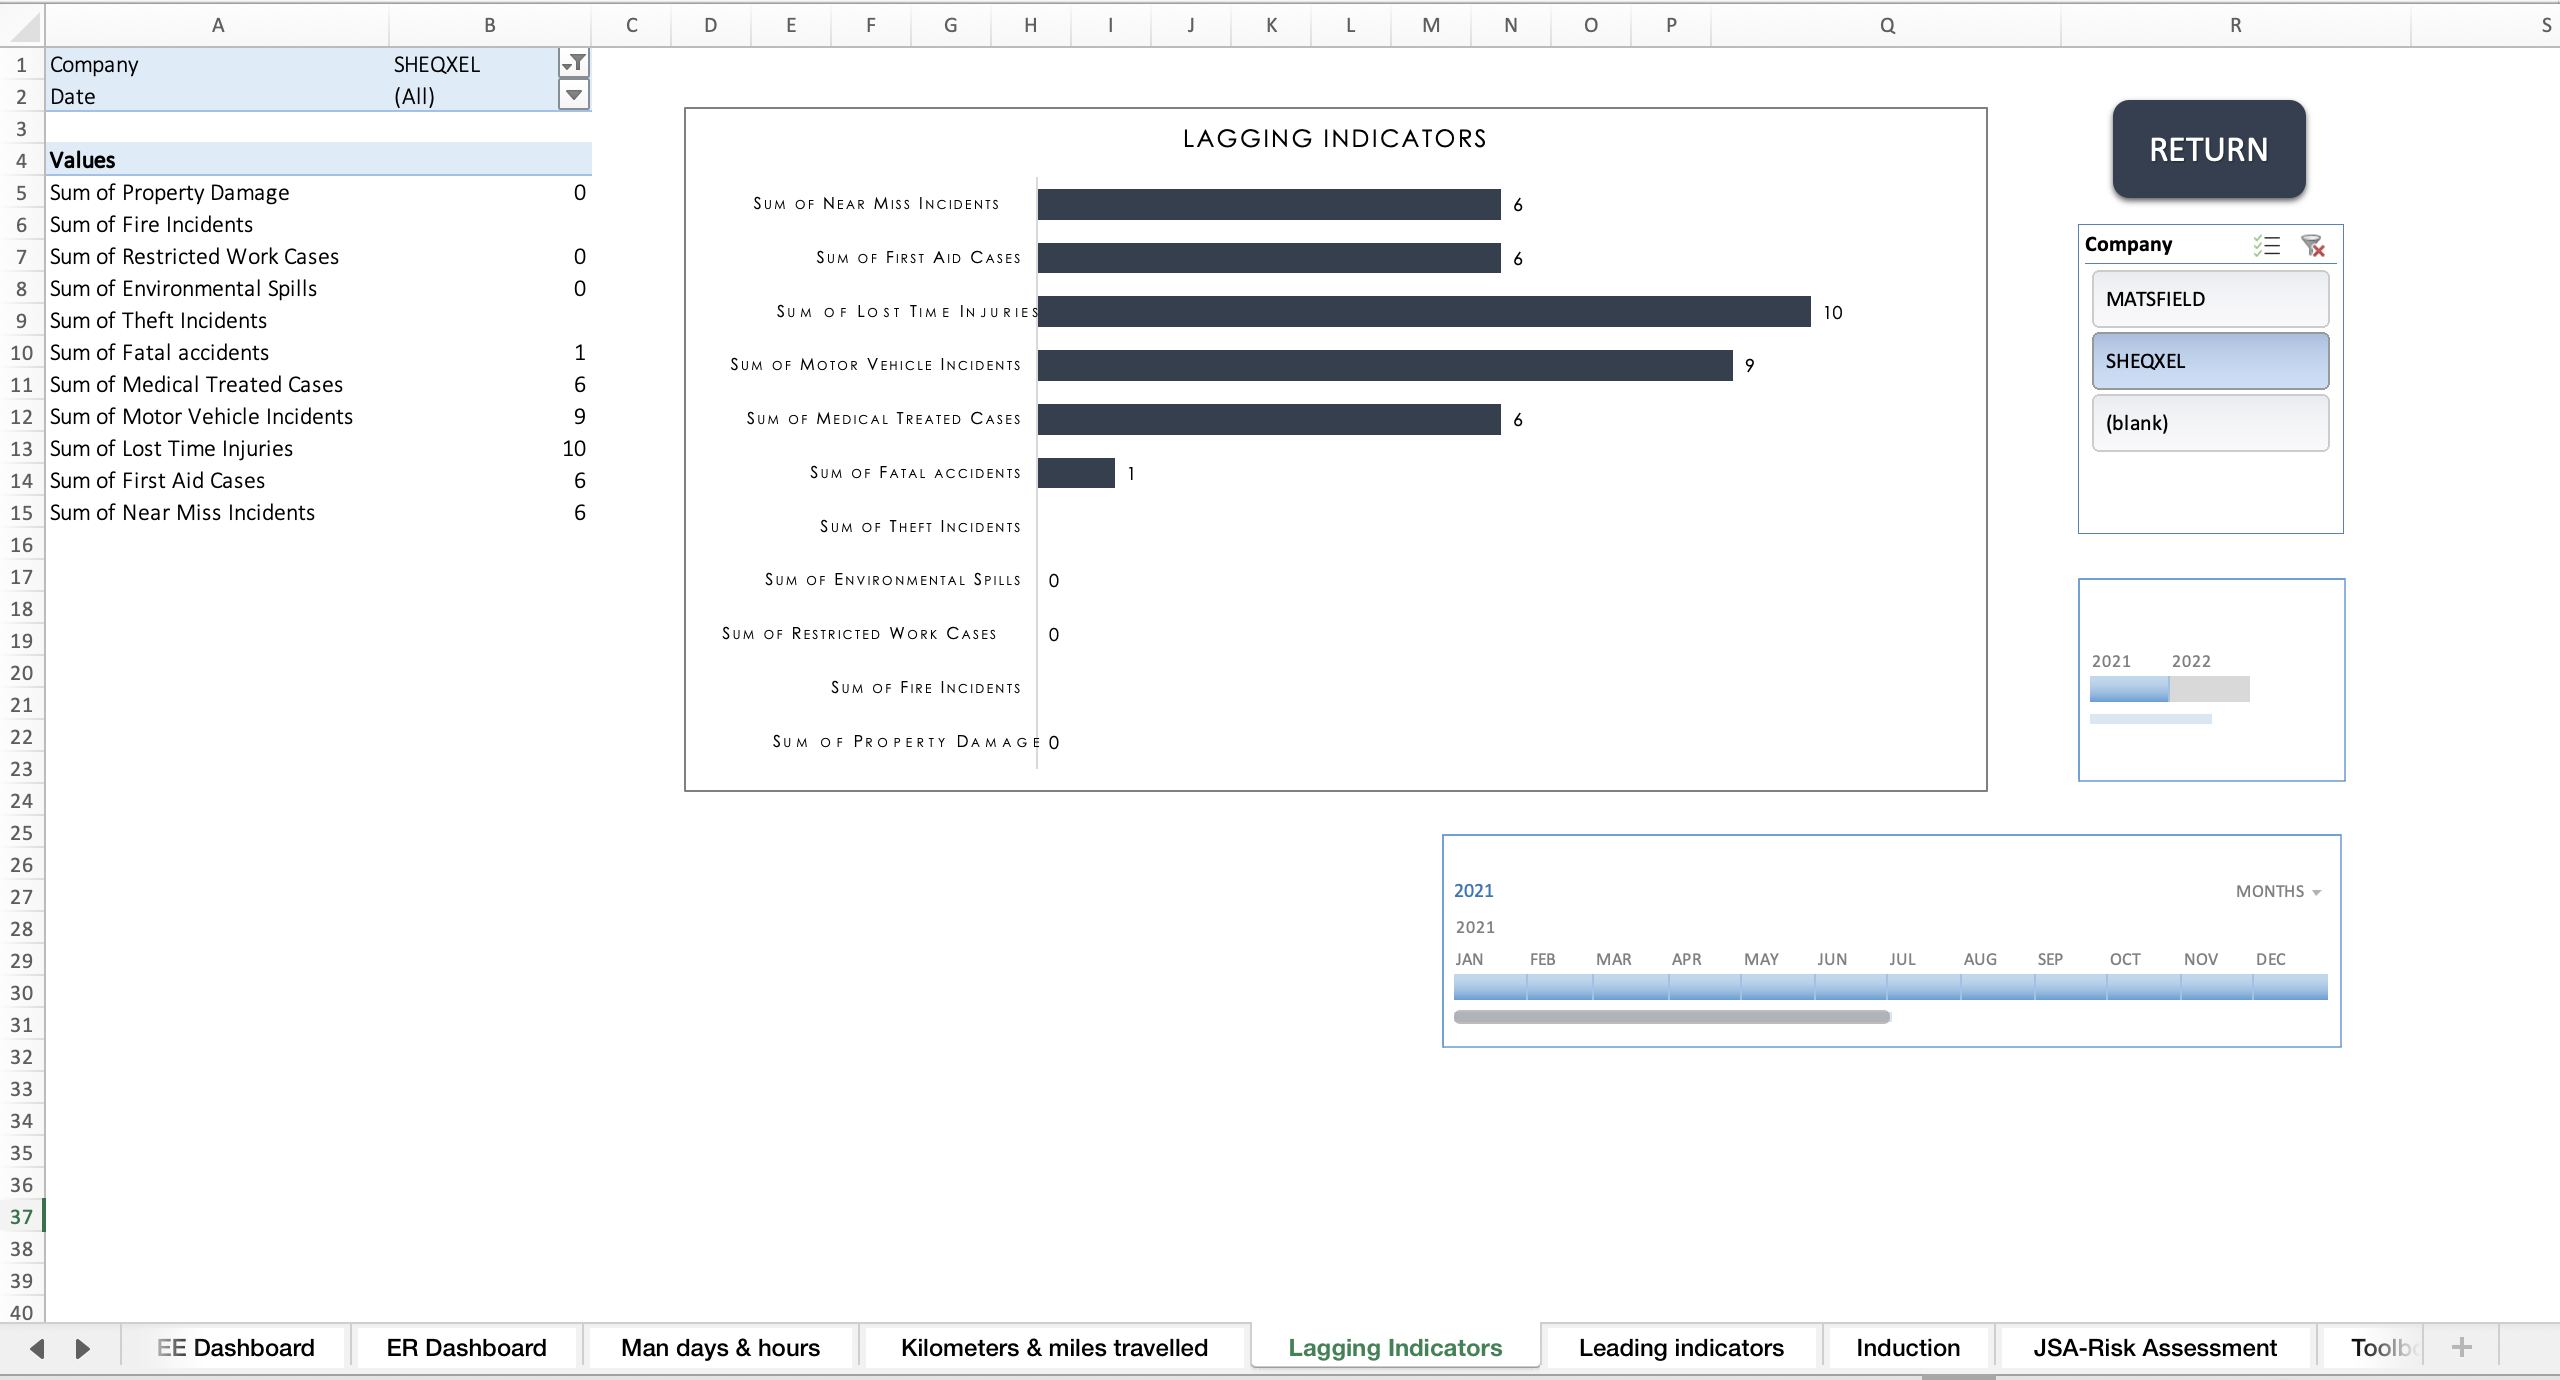
Lagging Indicators:
Reactively measure failures (e.g., incidents)
Separate Total Recordable Cases (TRC) from other incidents
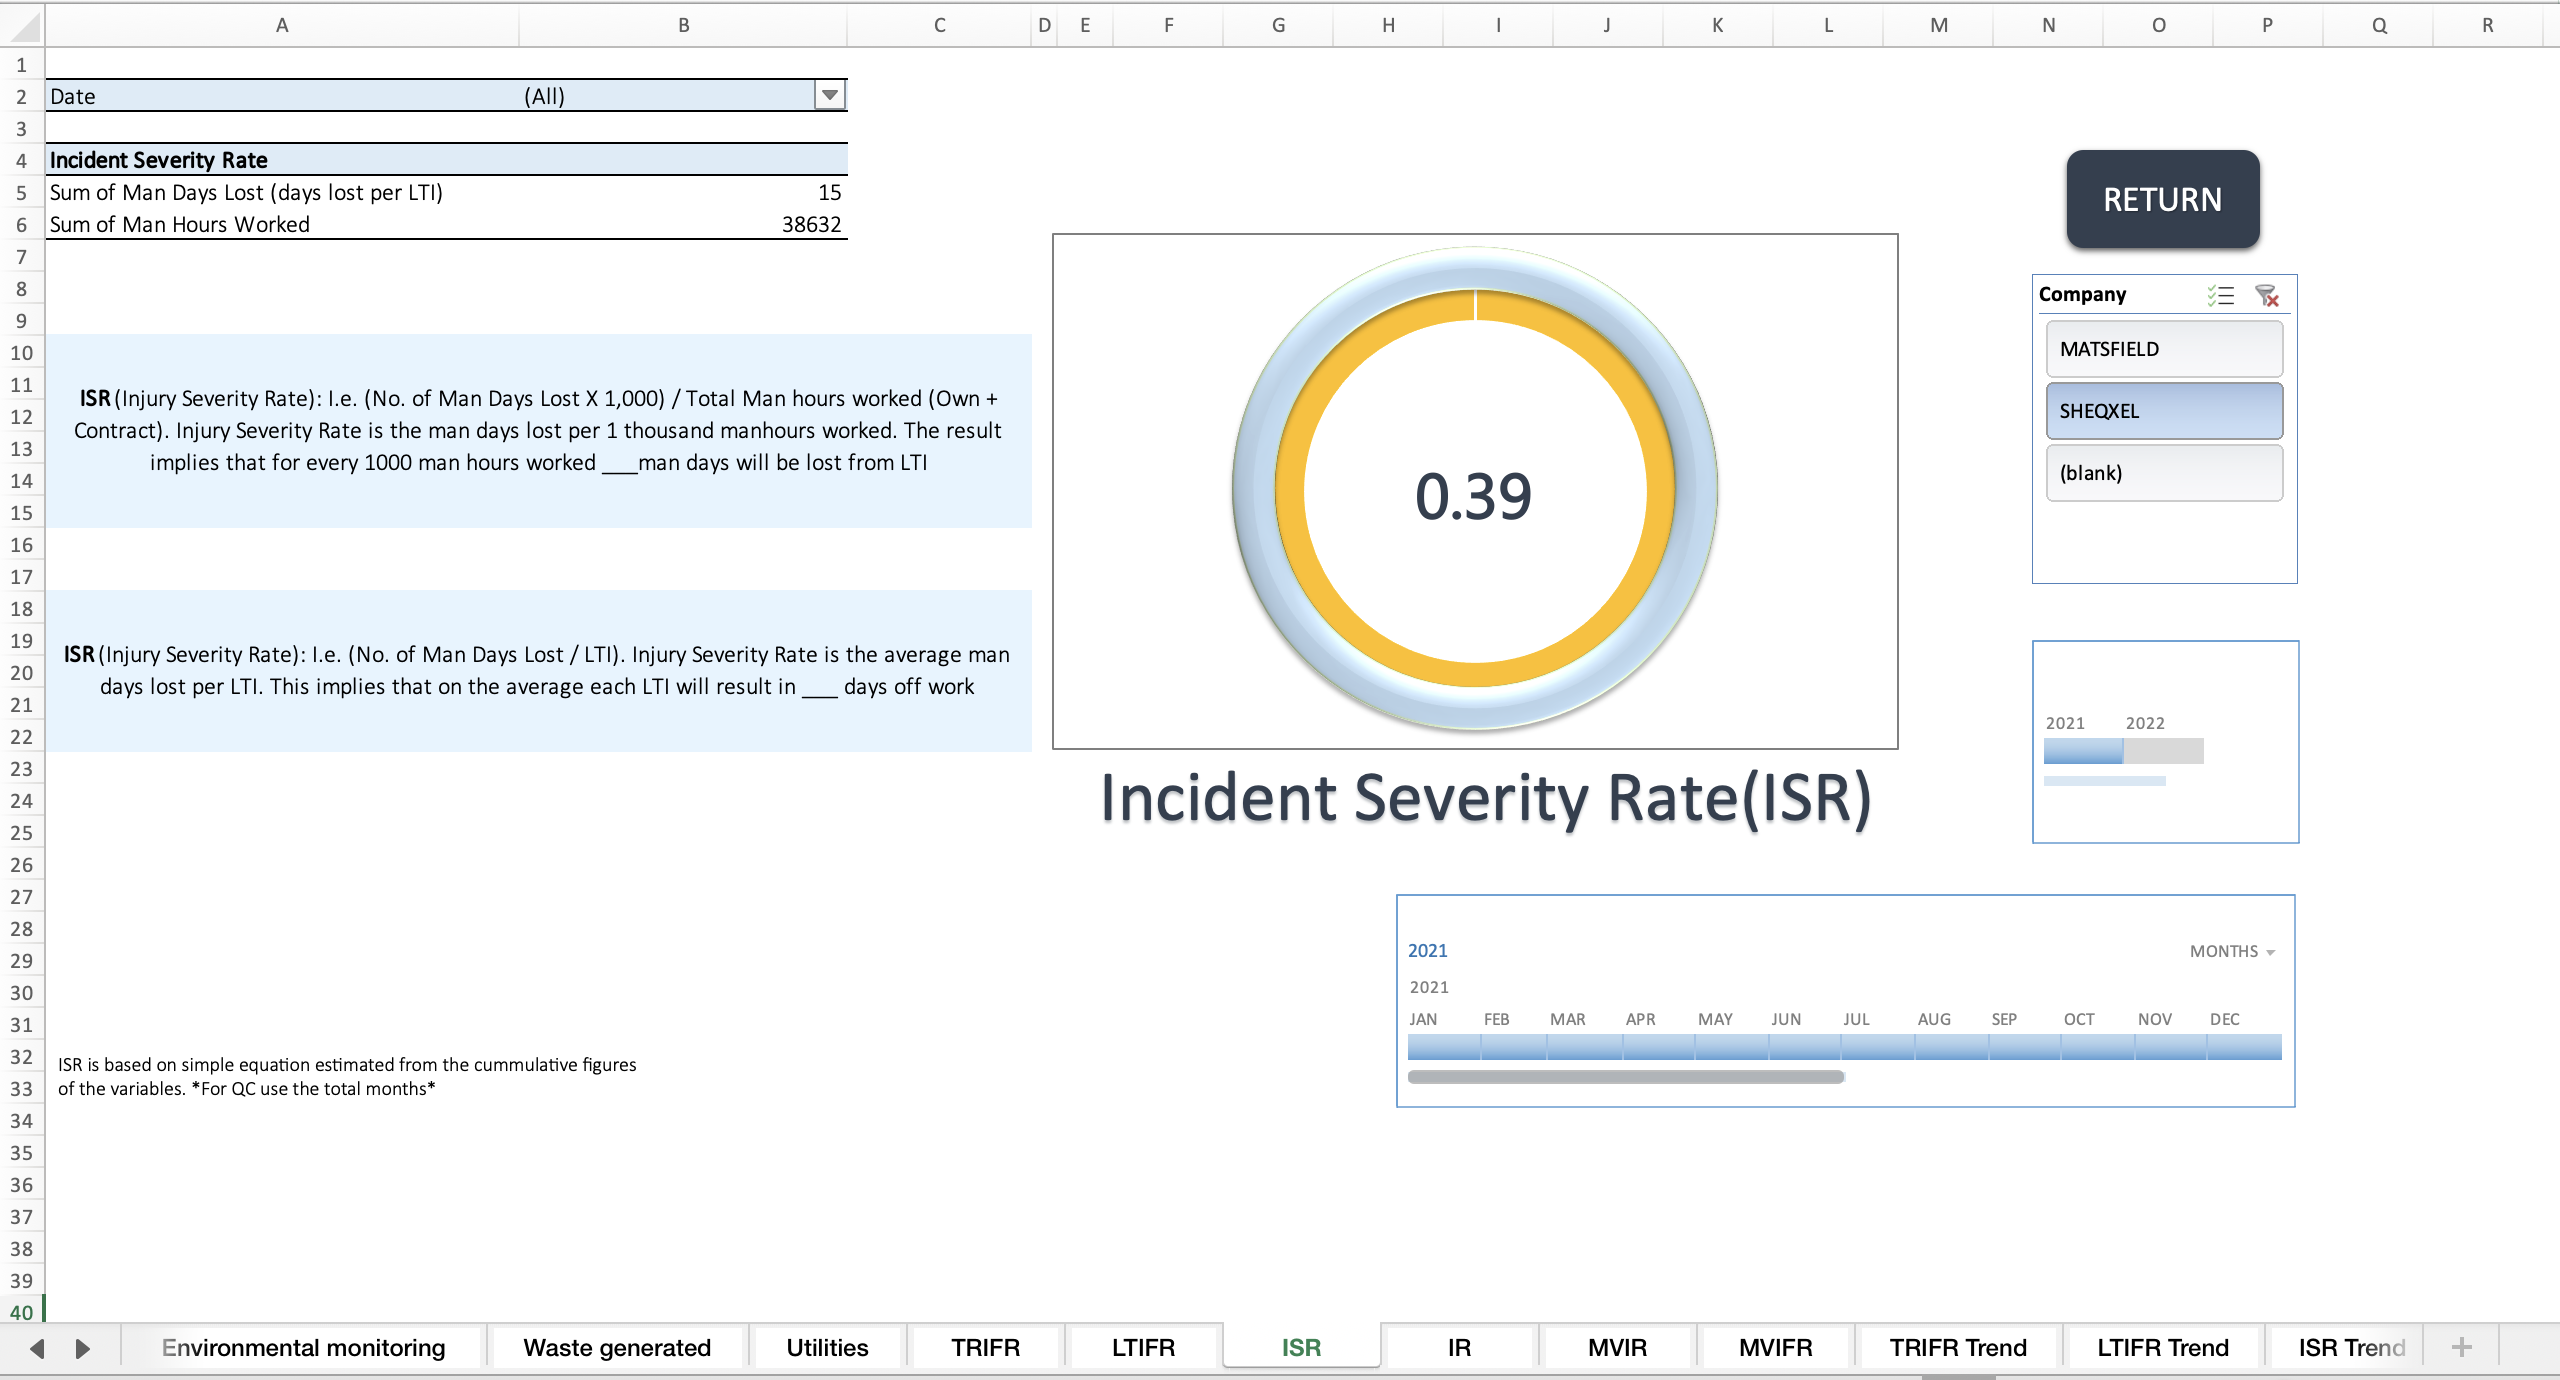
Calculate rates such as:
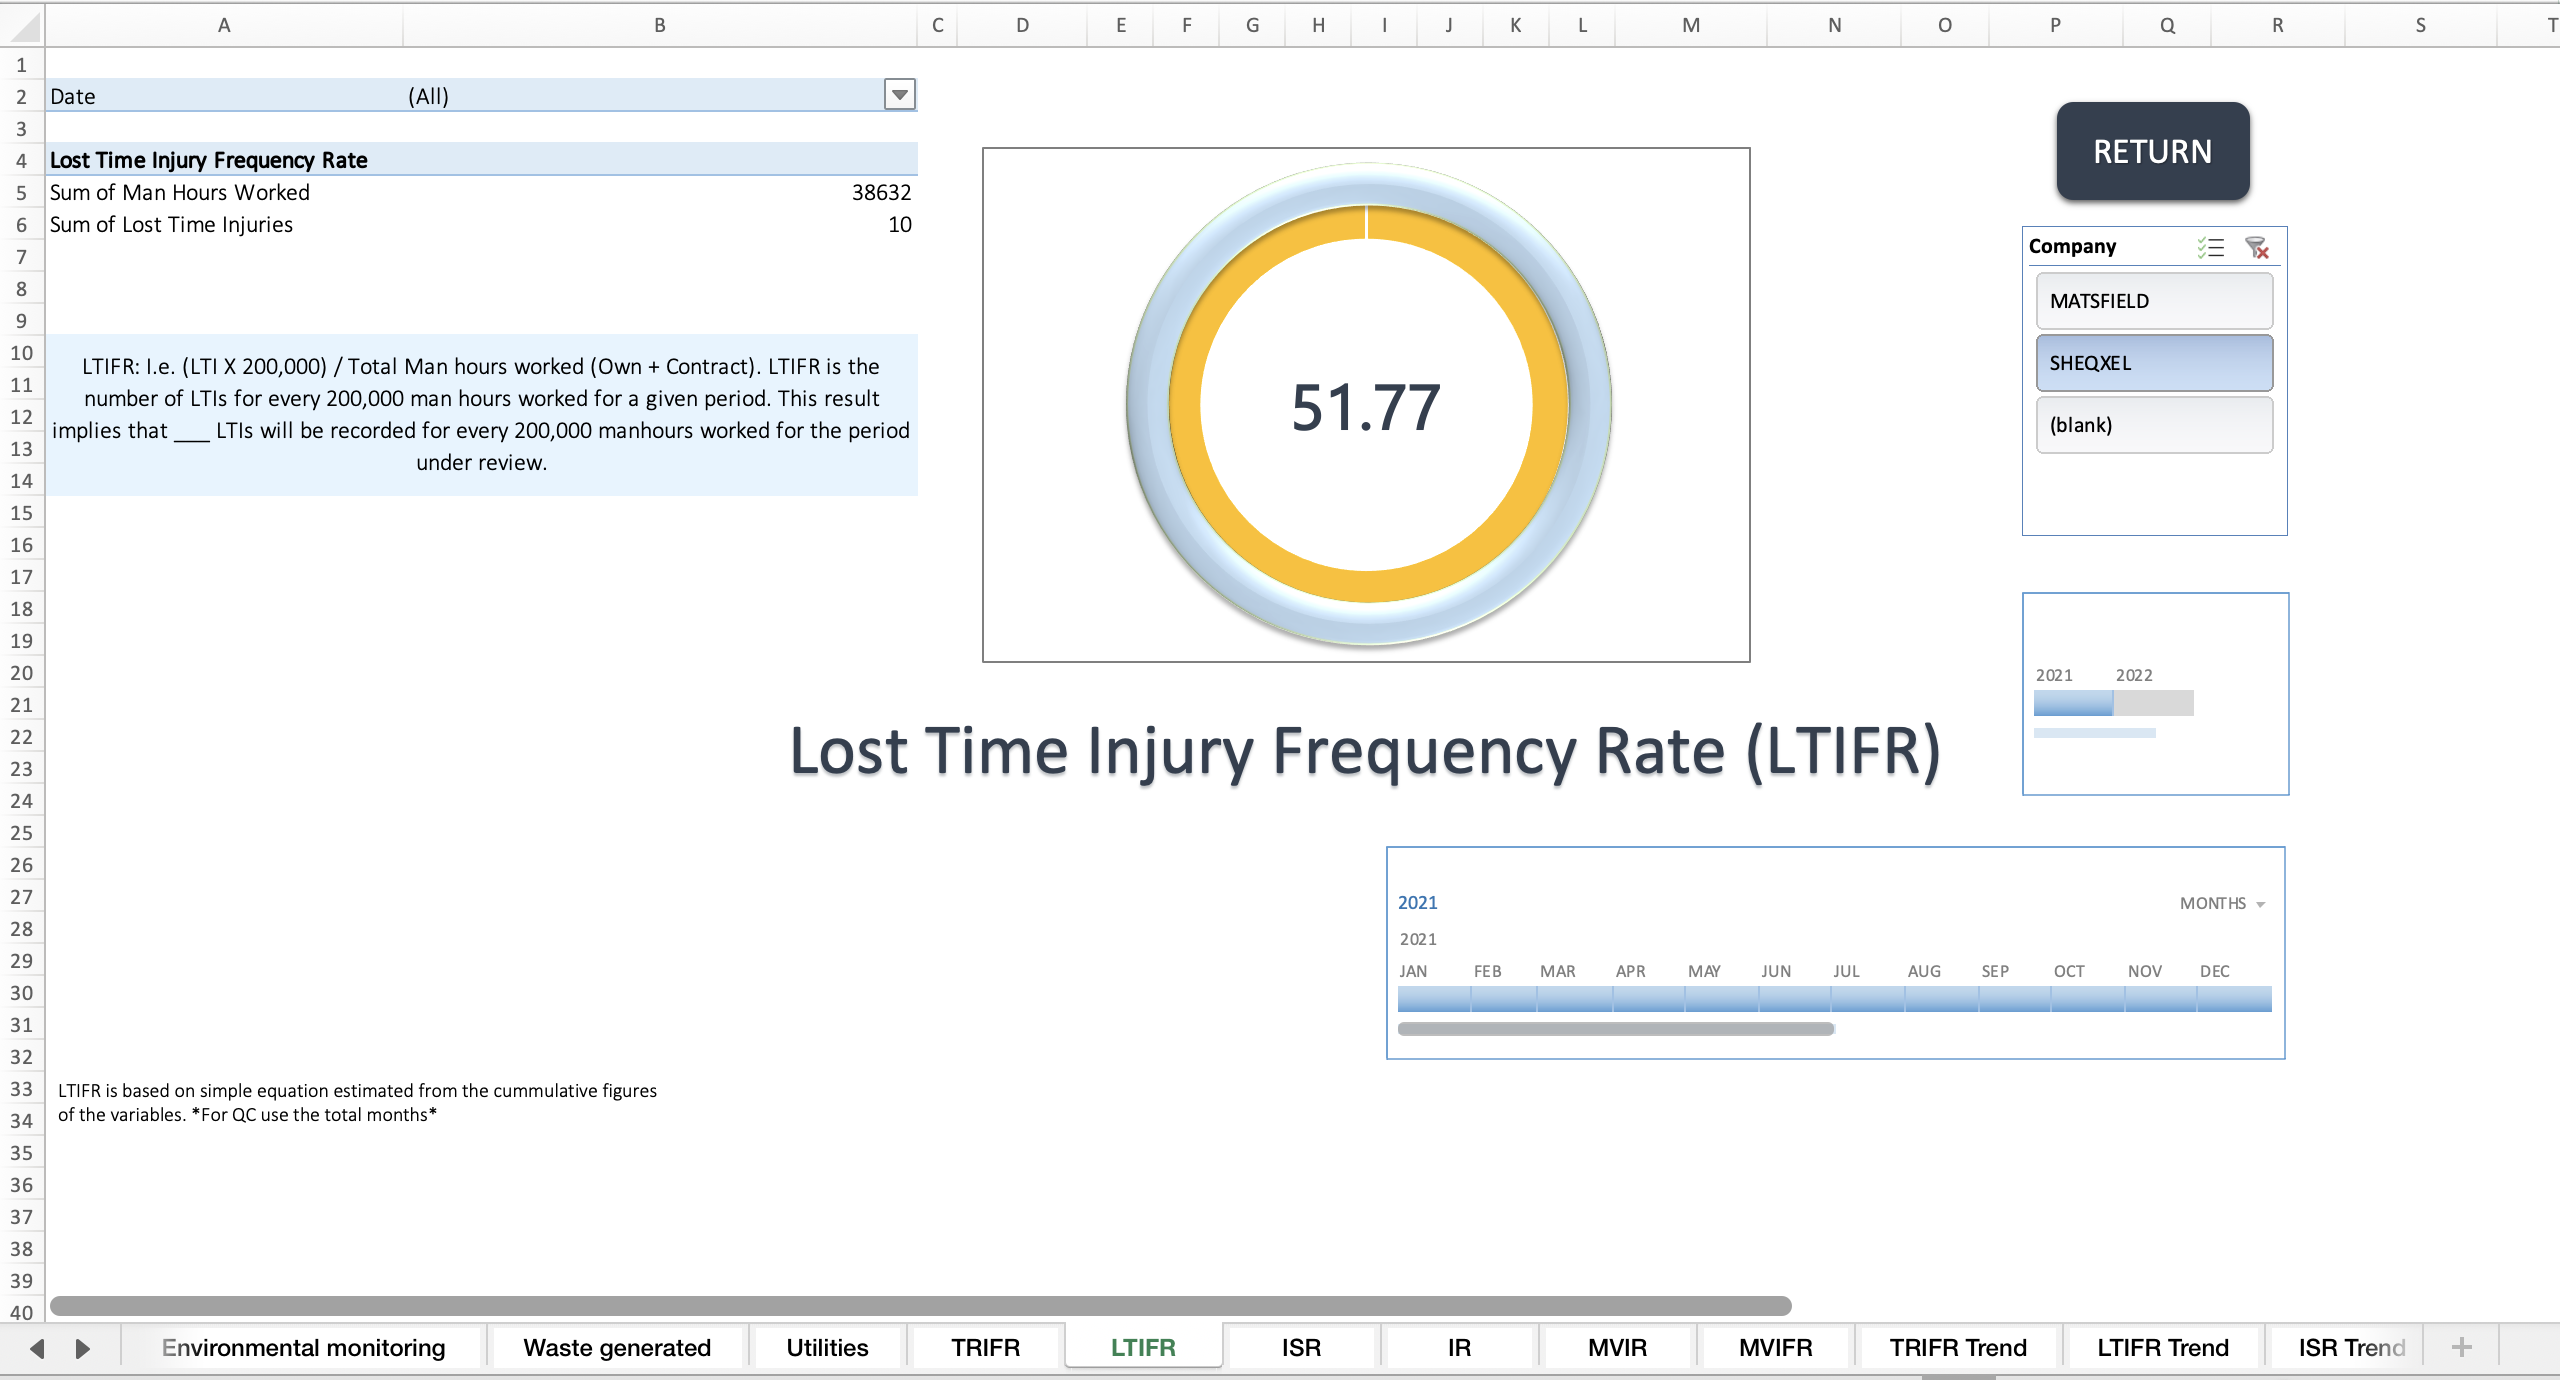
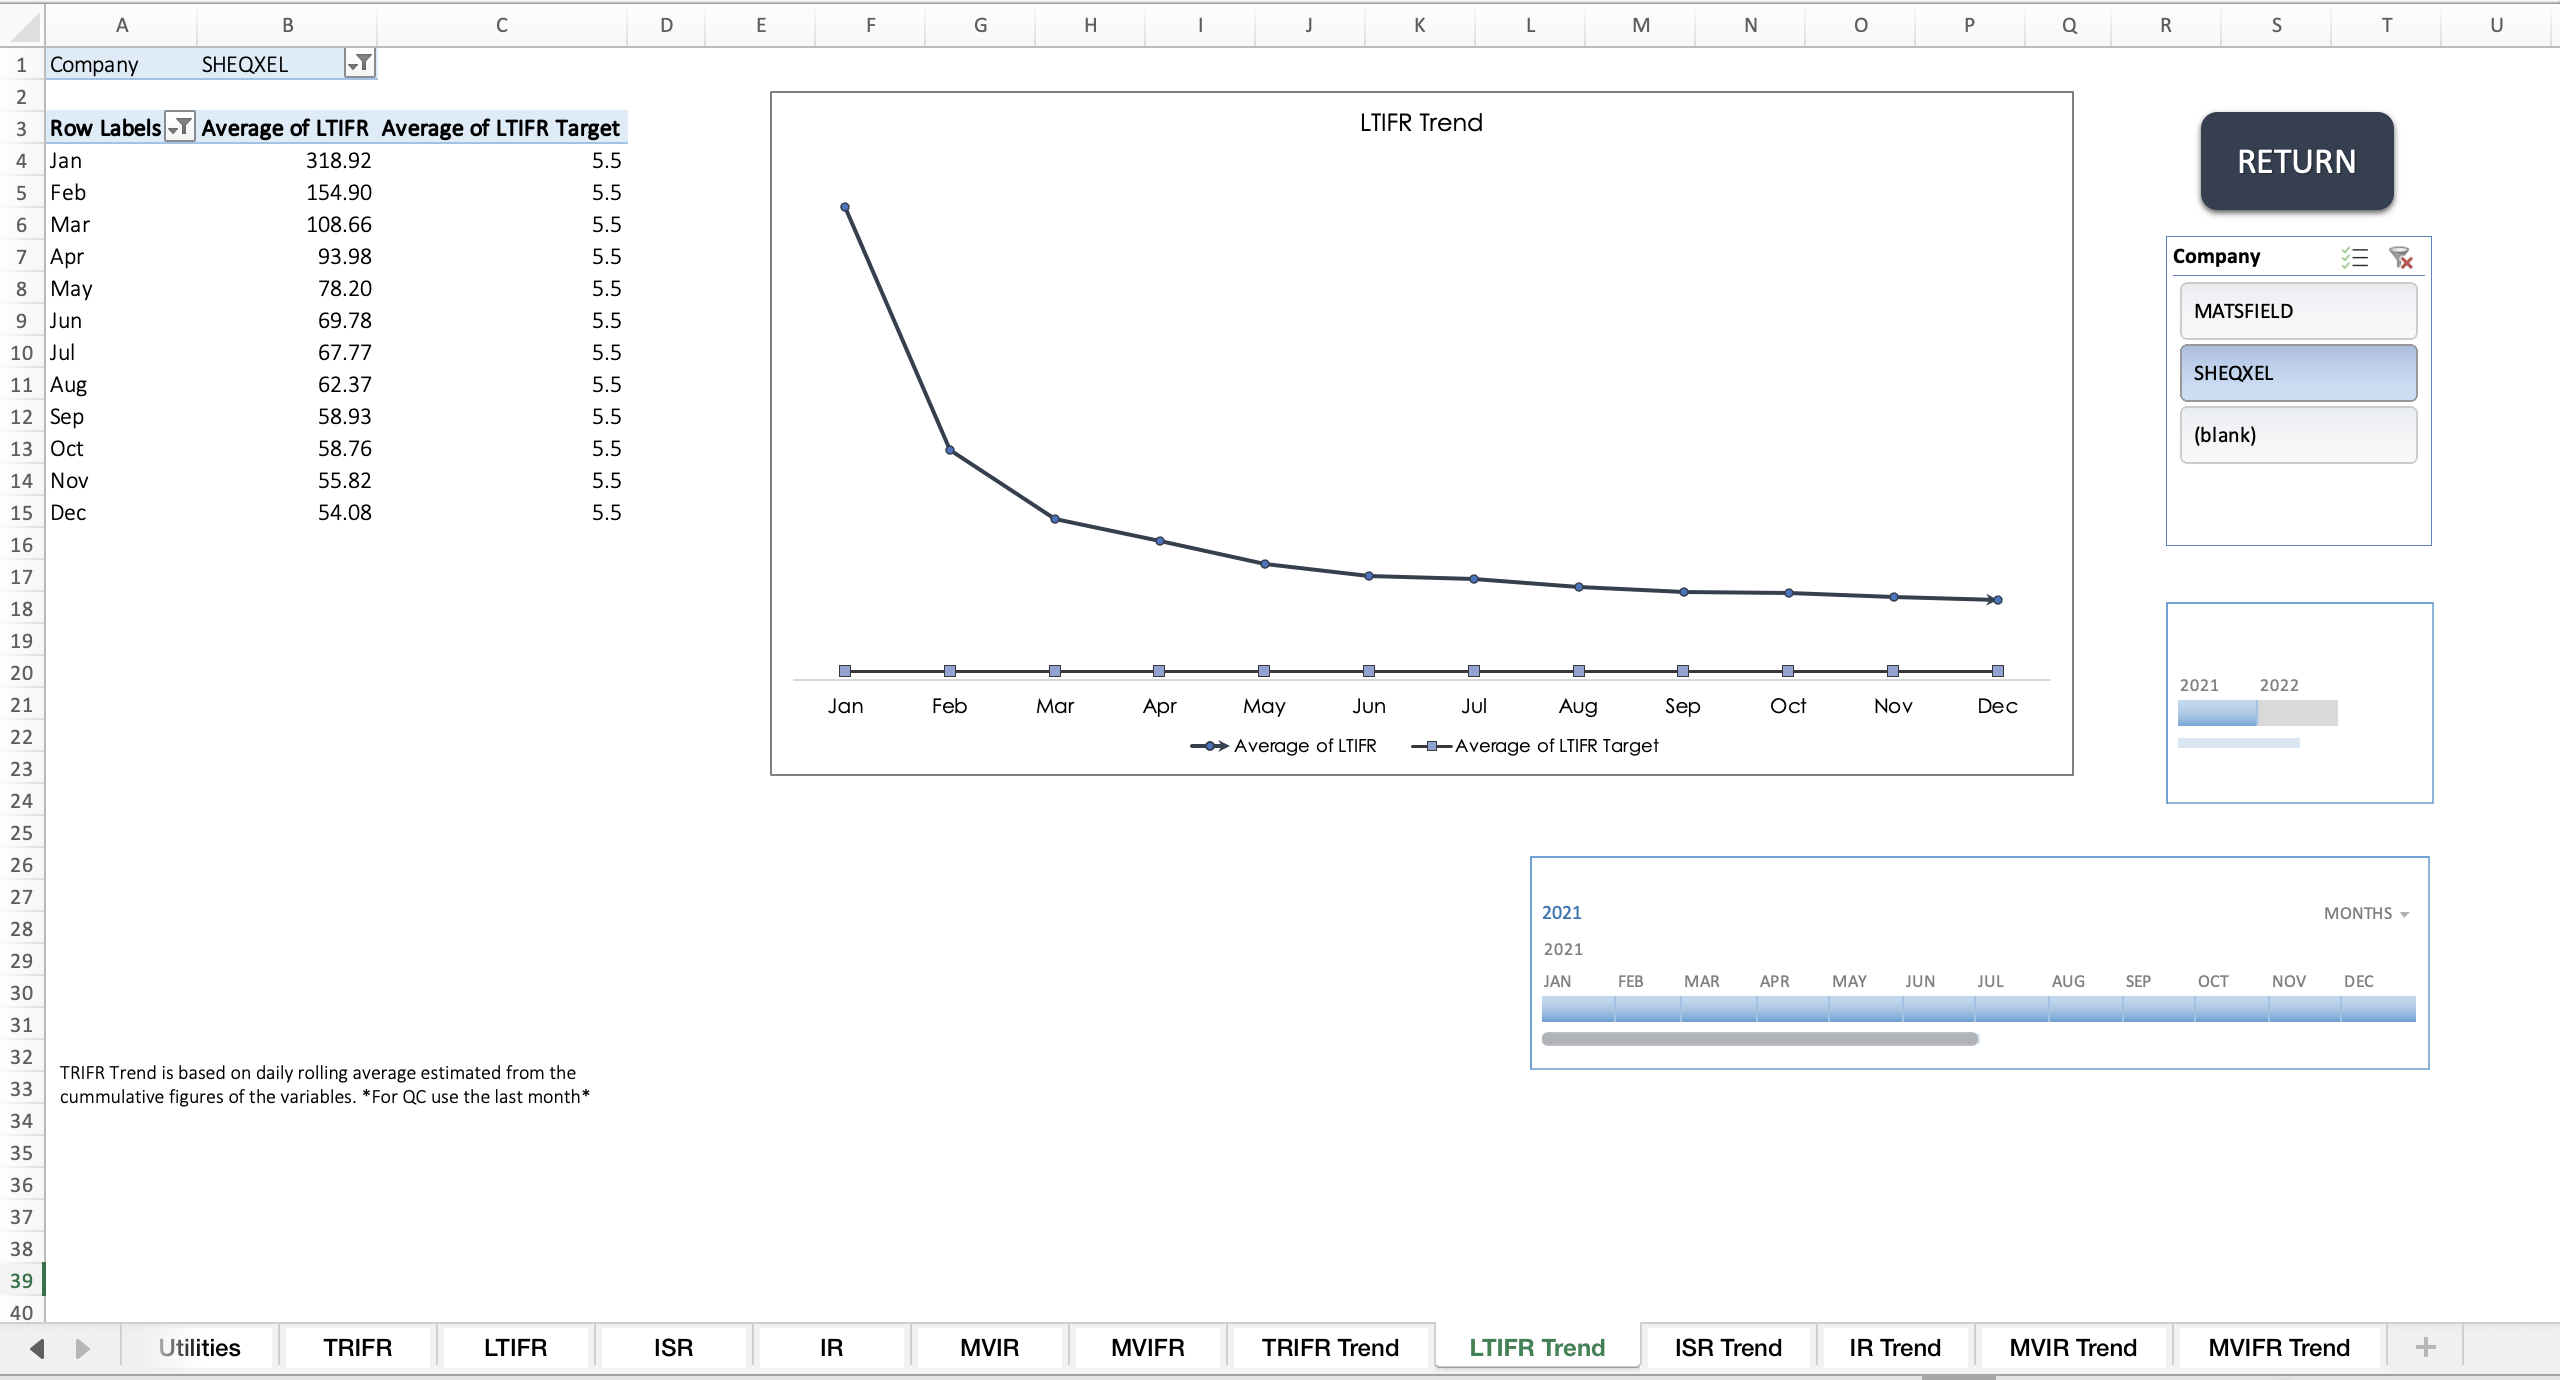
Lost Time Injury Frequency Rate (LTIFR)
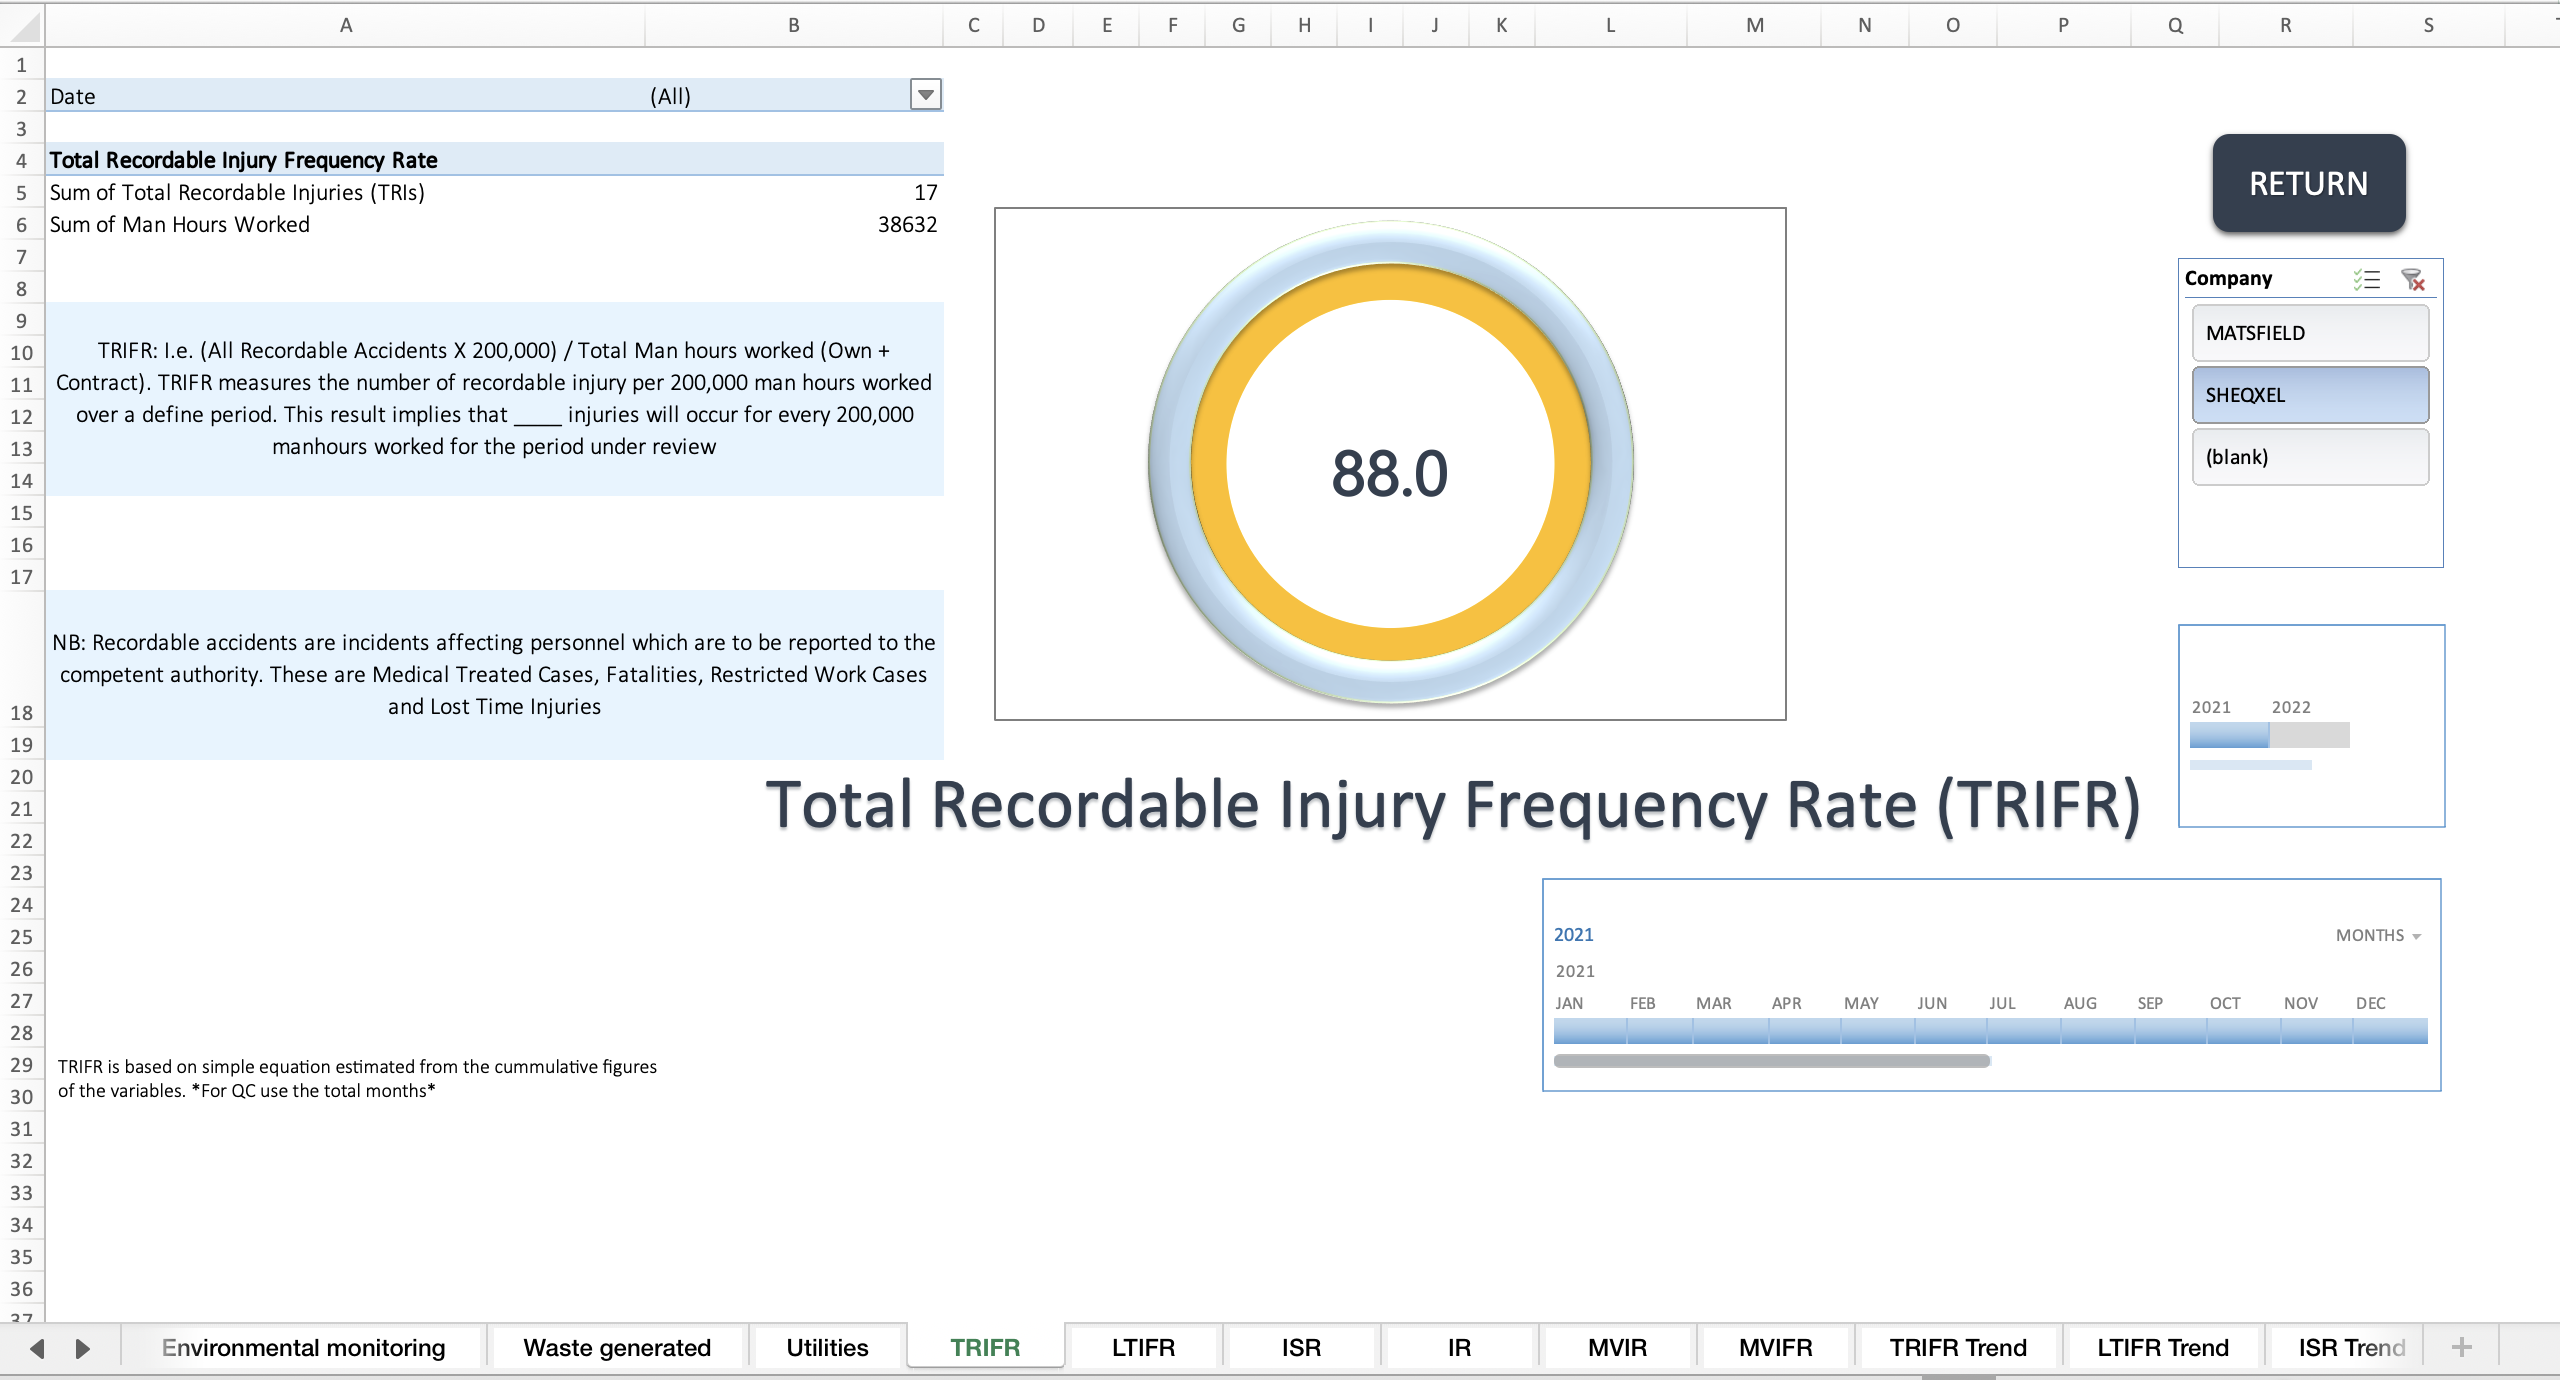
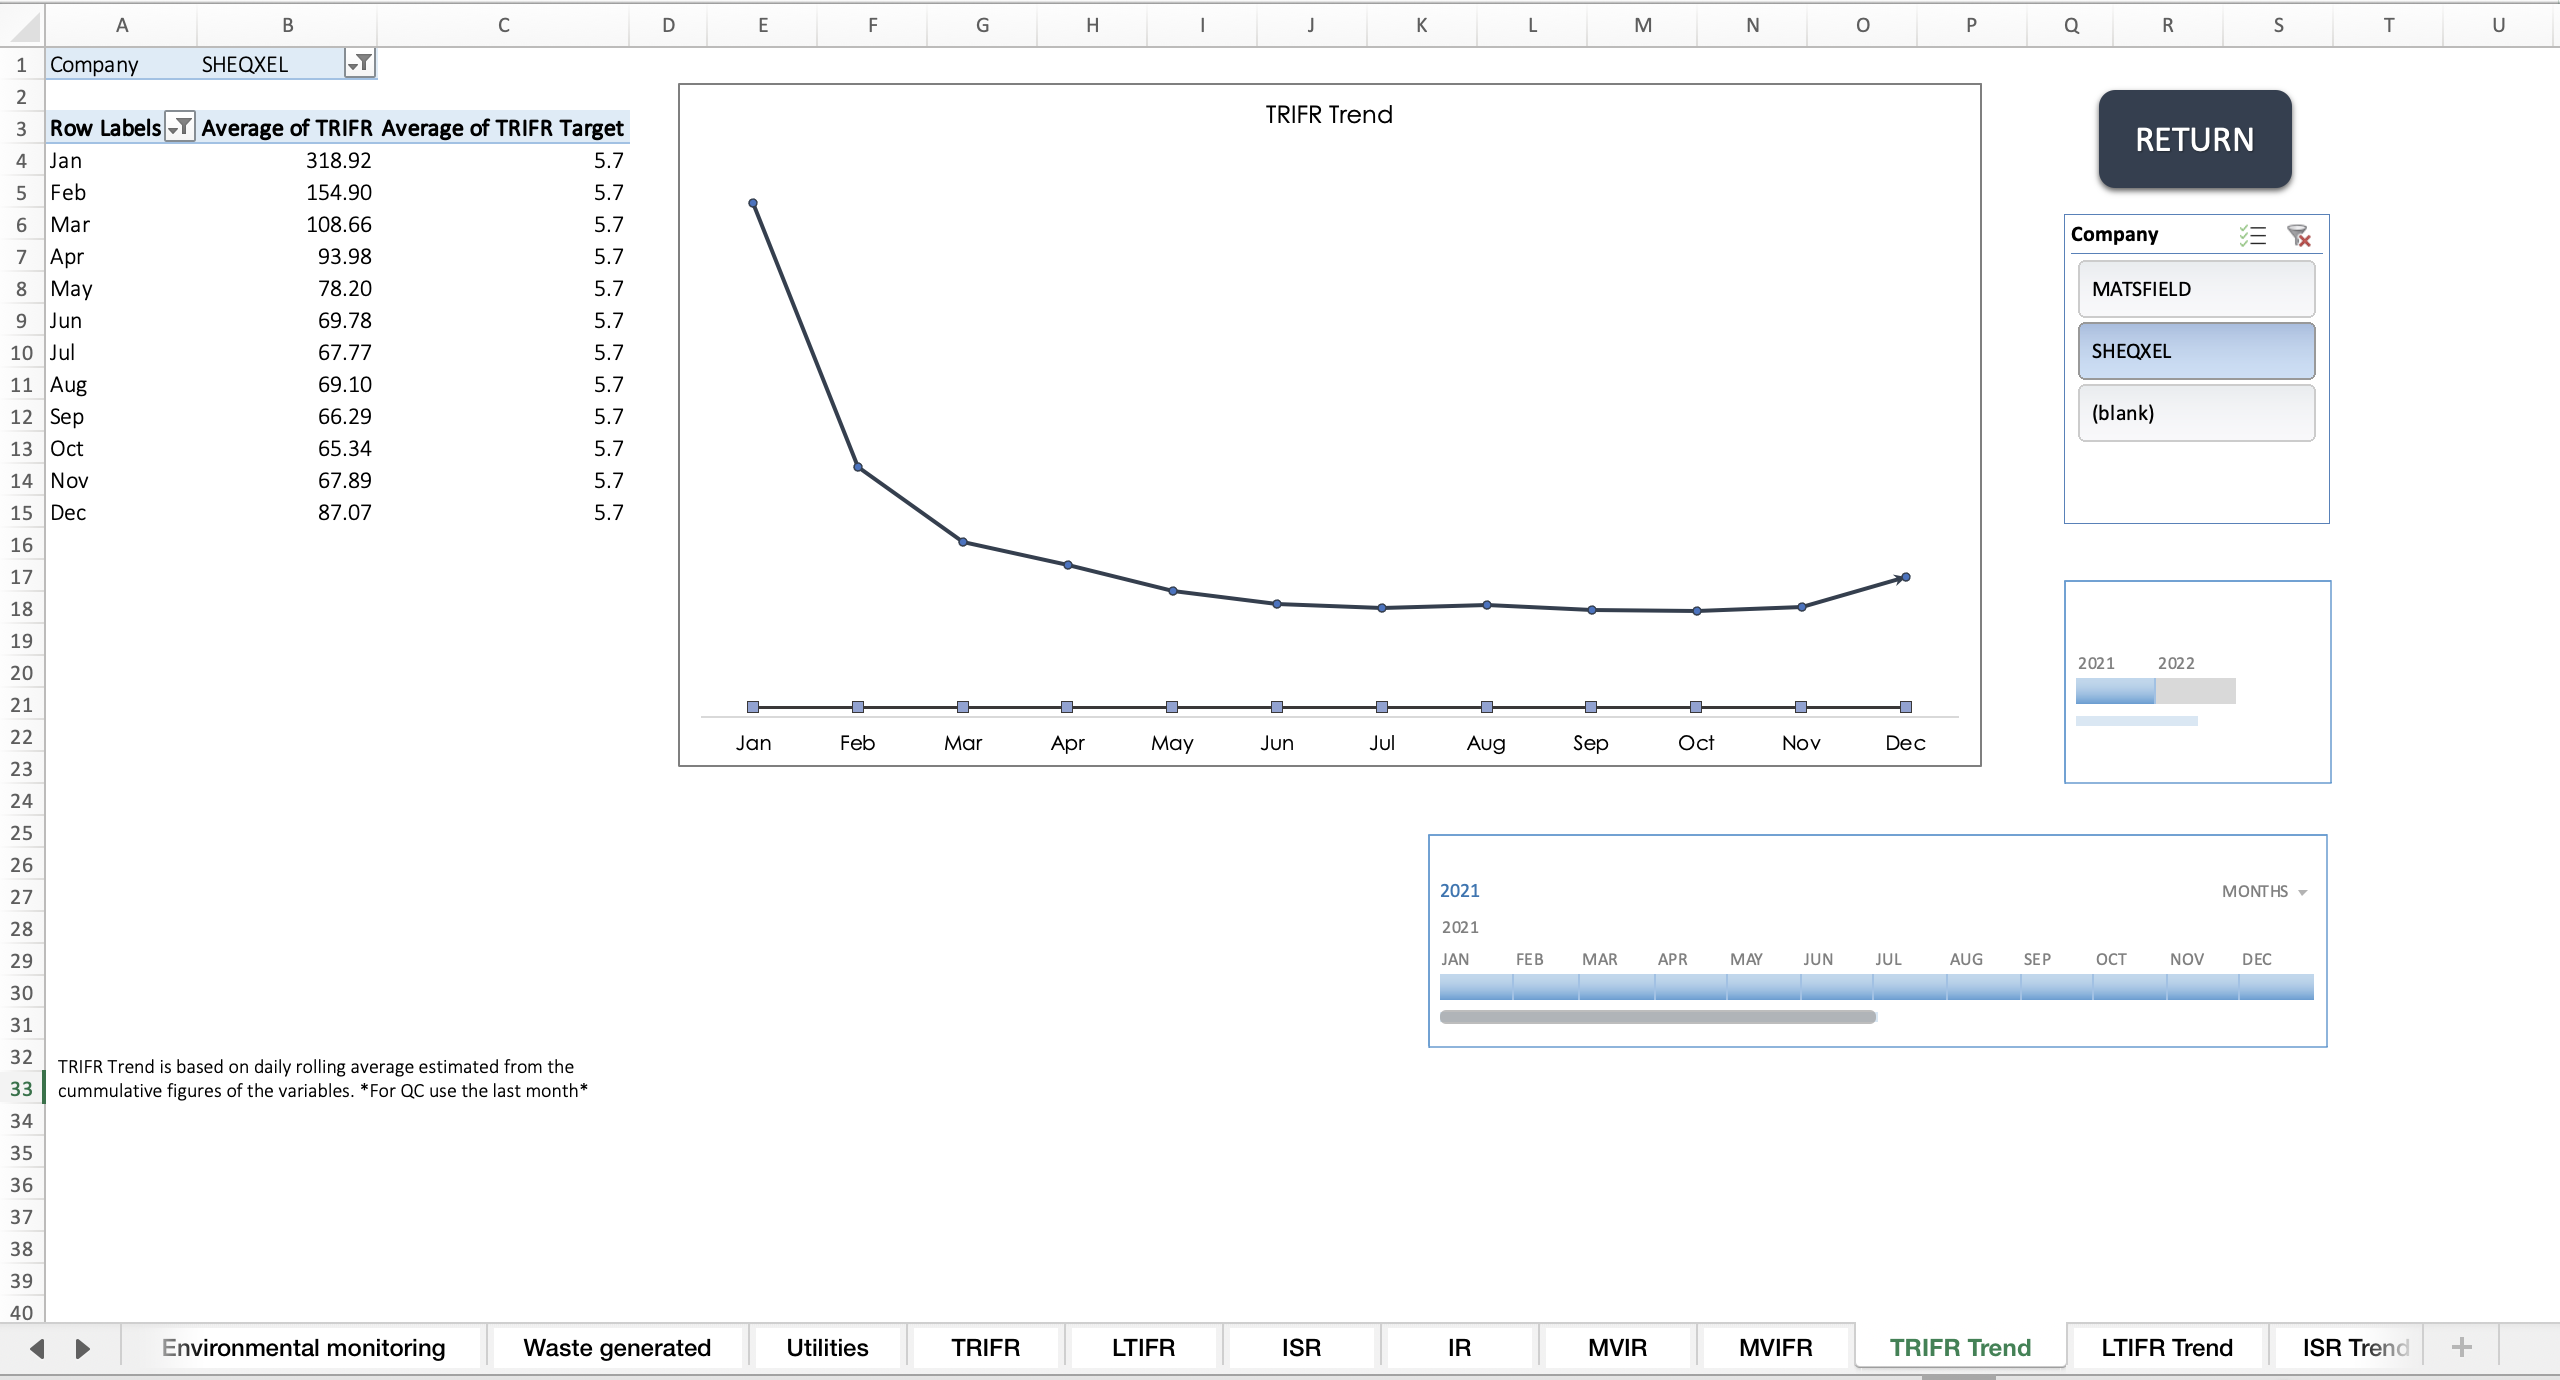
Total Recordable Injury Frequency Rate (TRIFR)
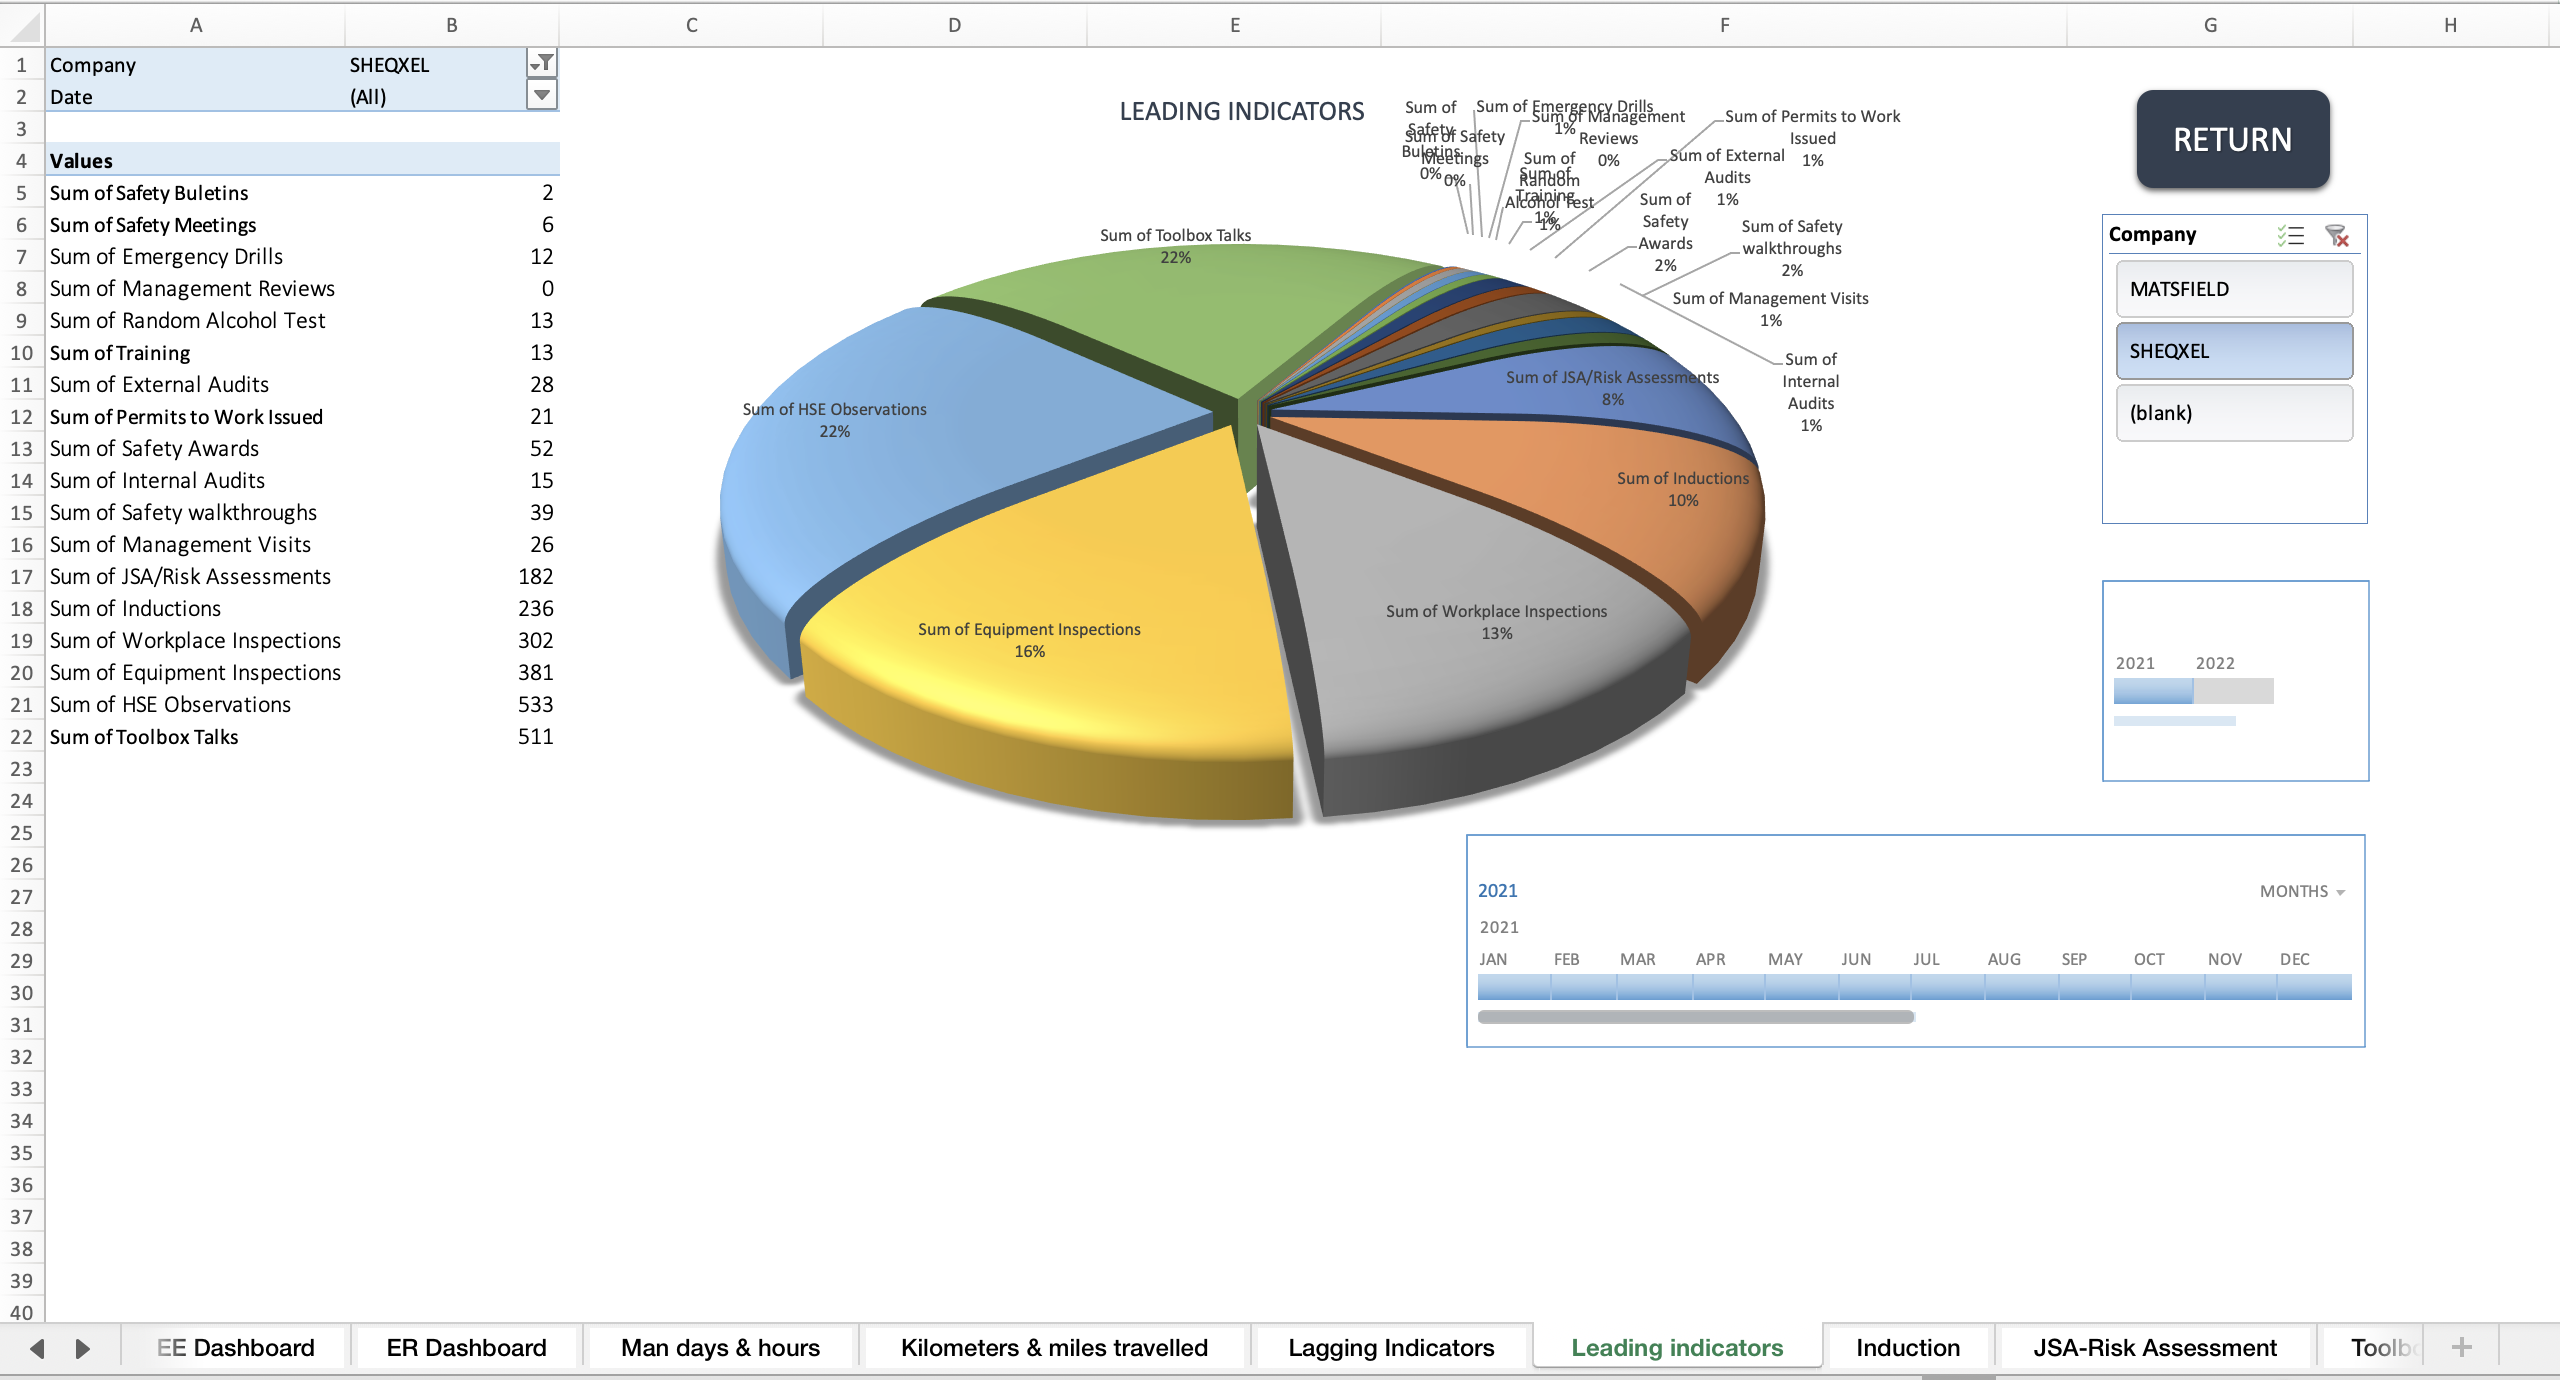
Leading Indicators:
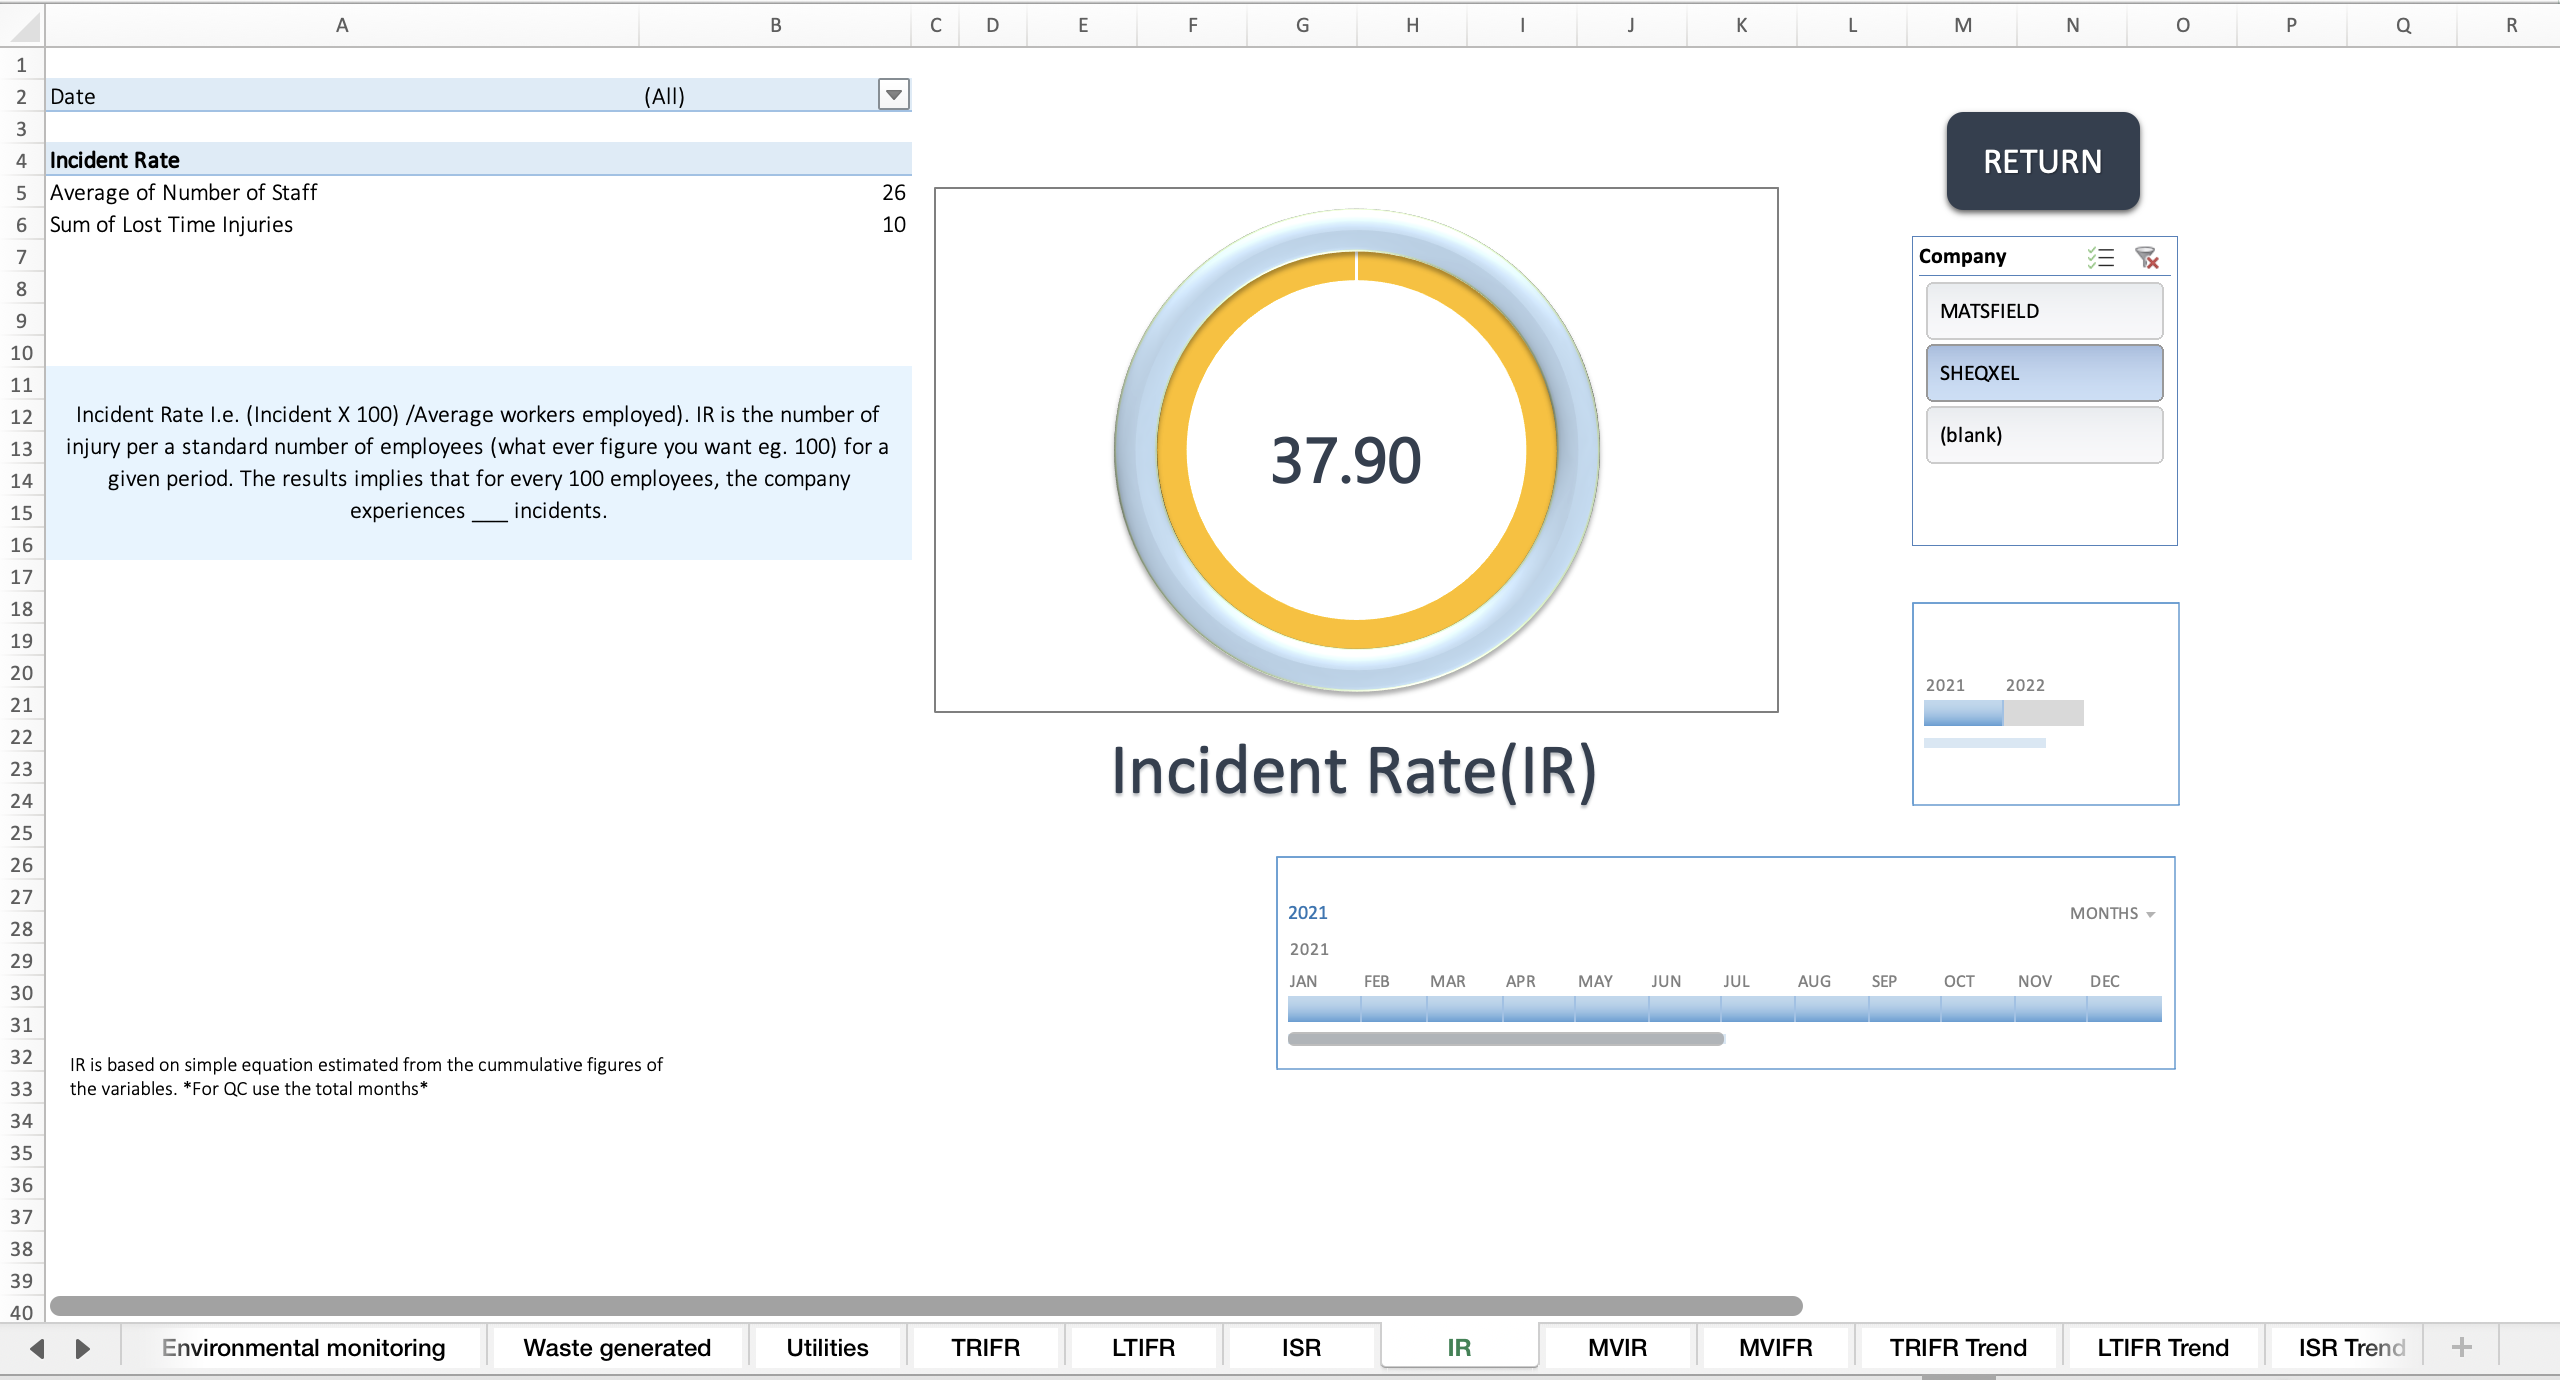
Proactively measure success
Based on generic indicators applicable to all high-risk workplaces
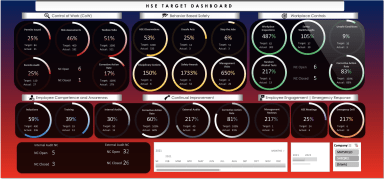
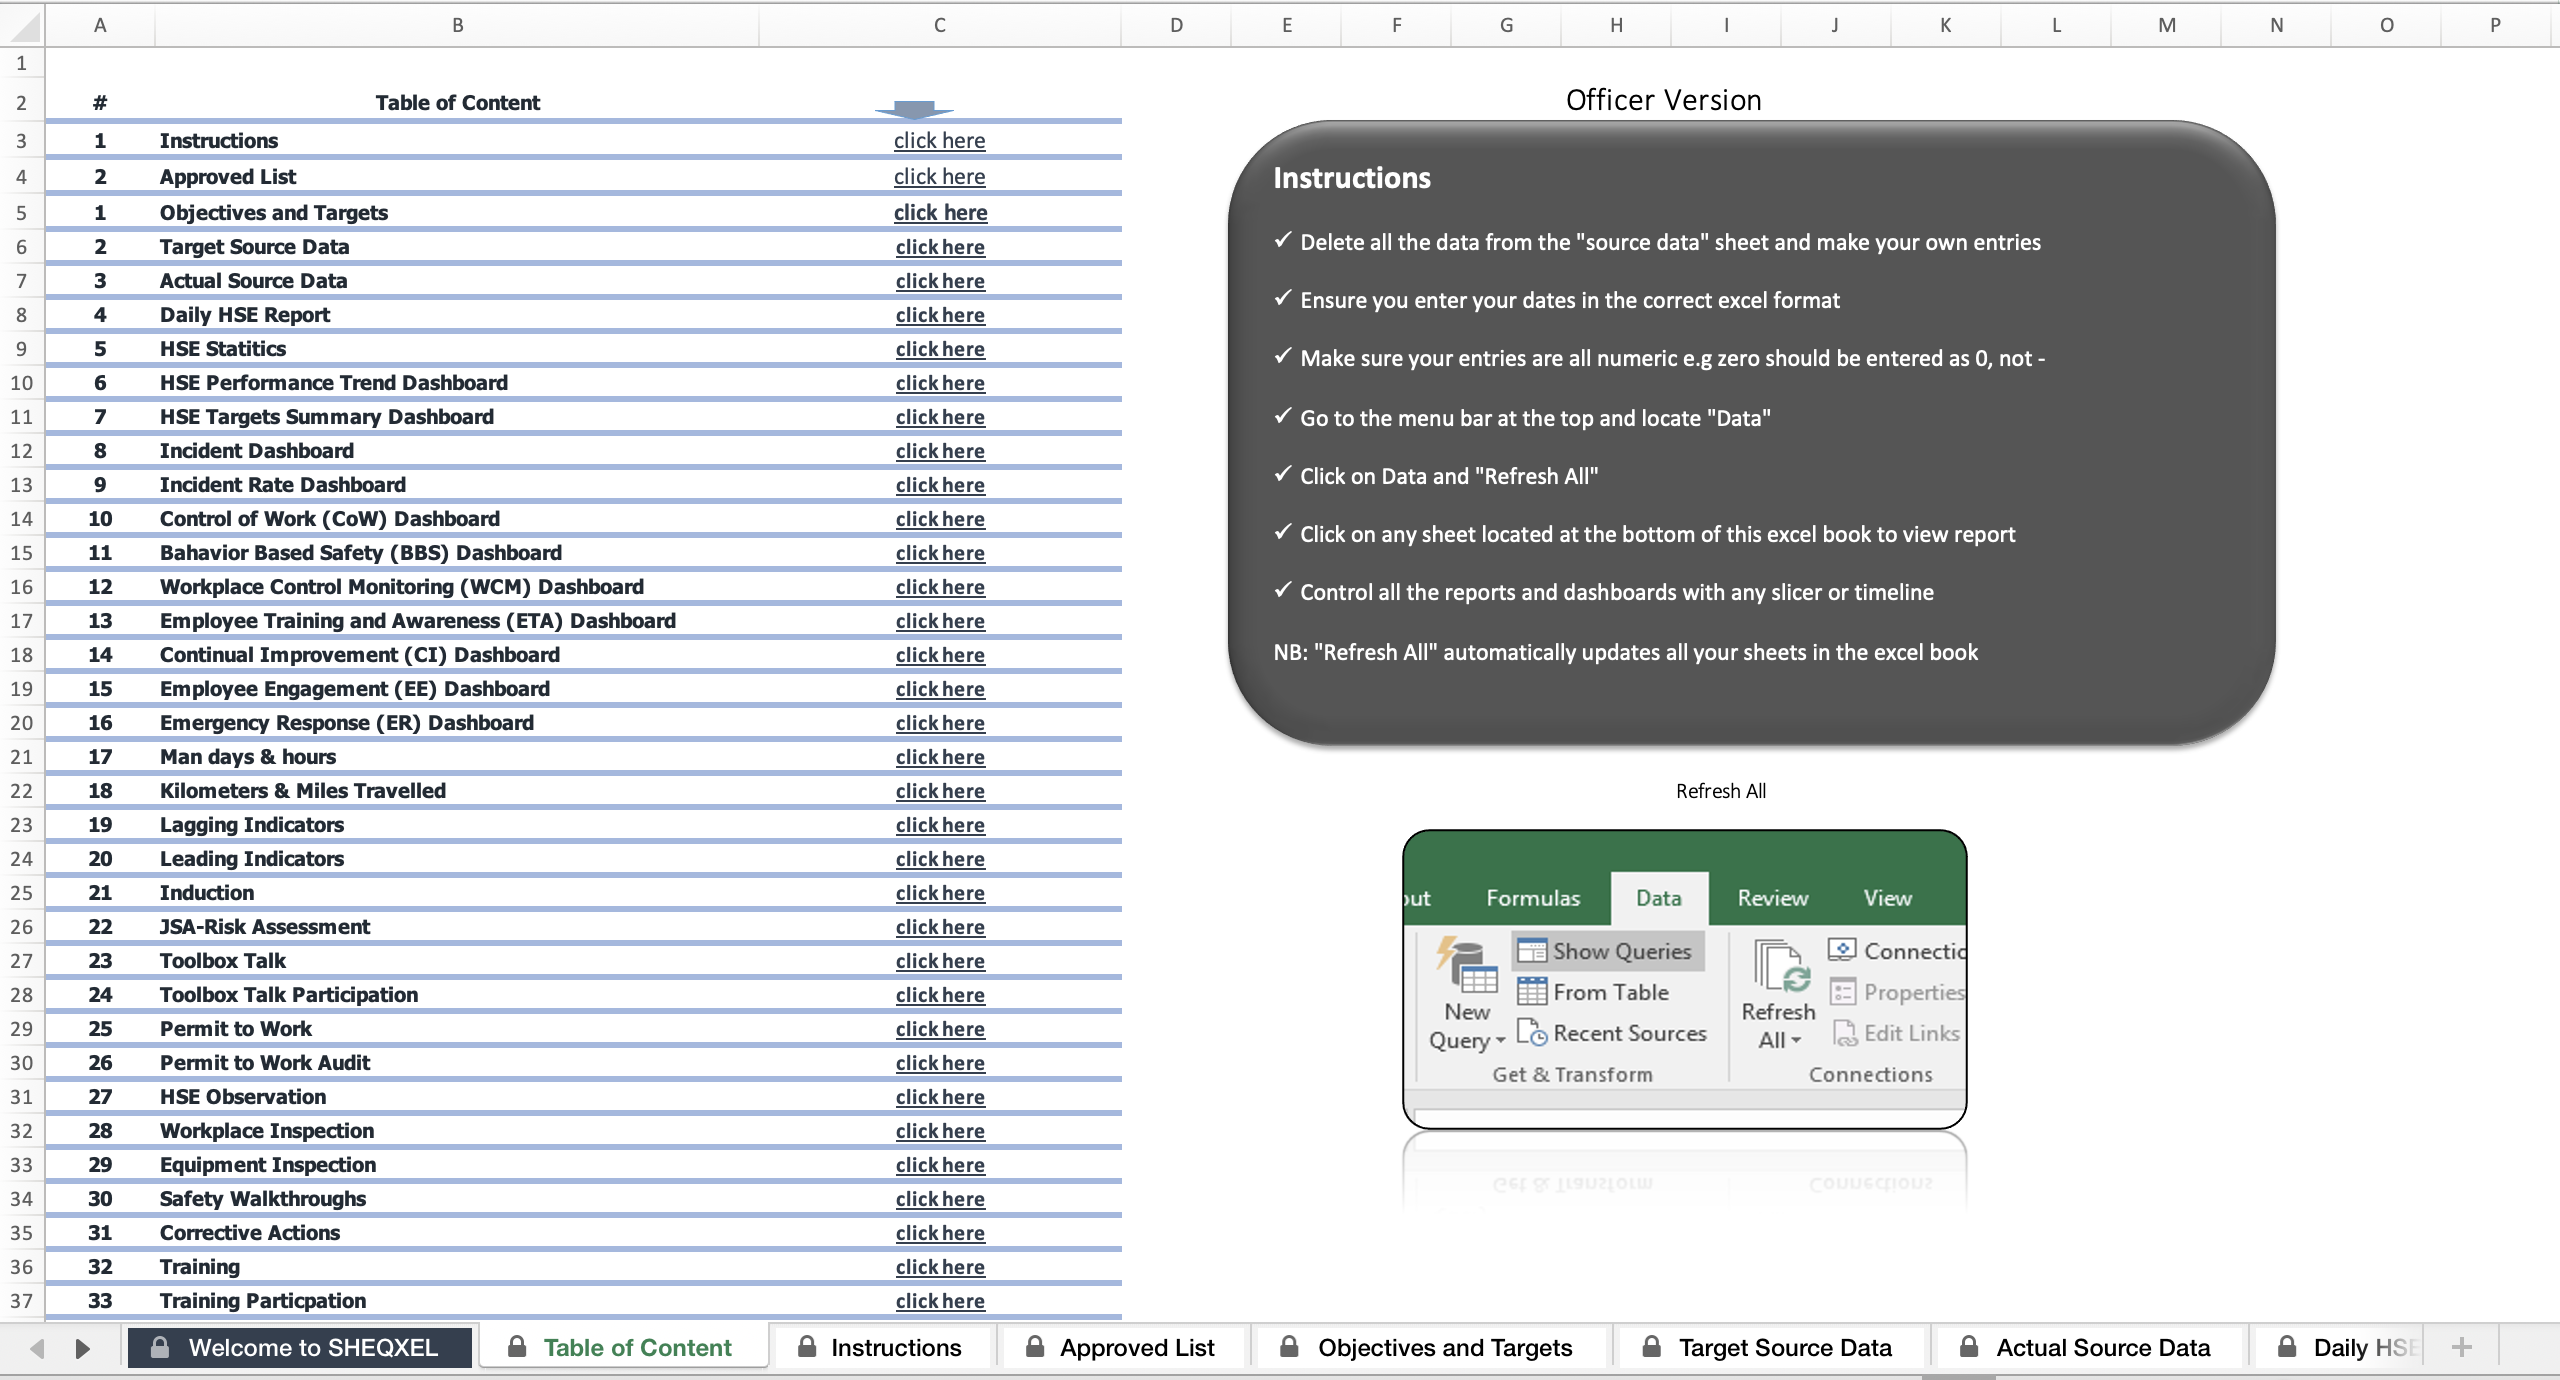
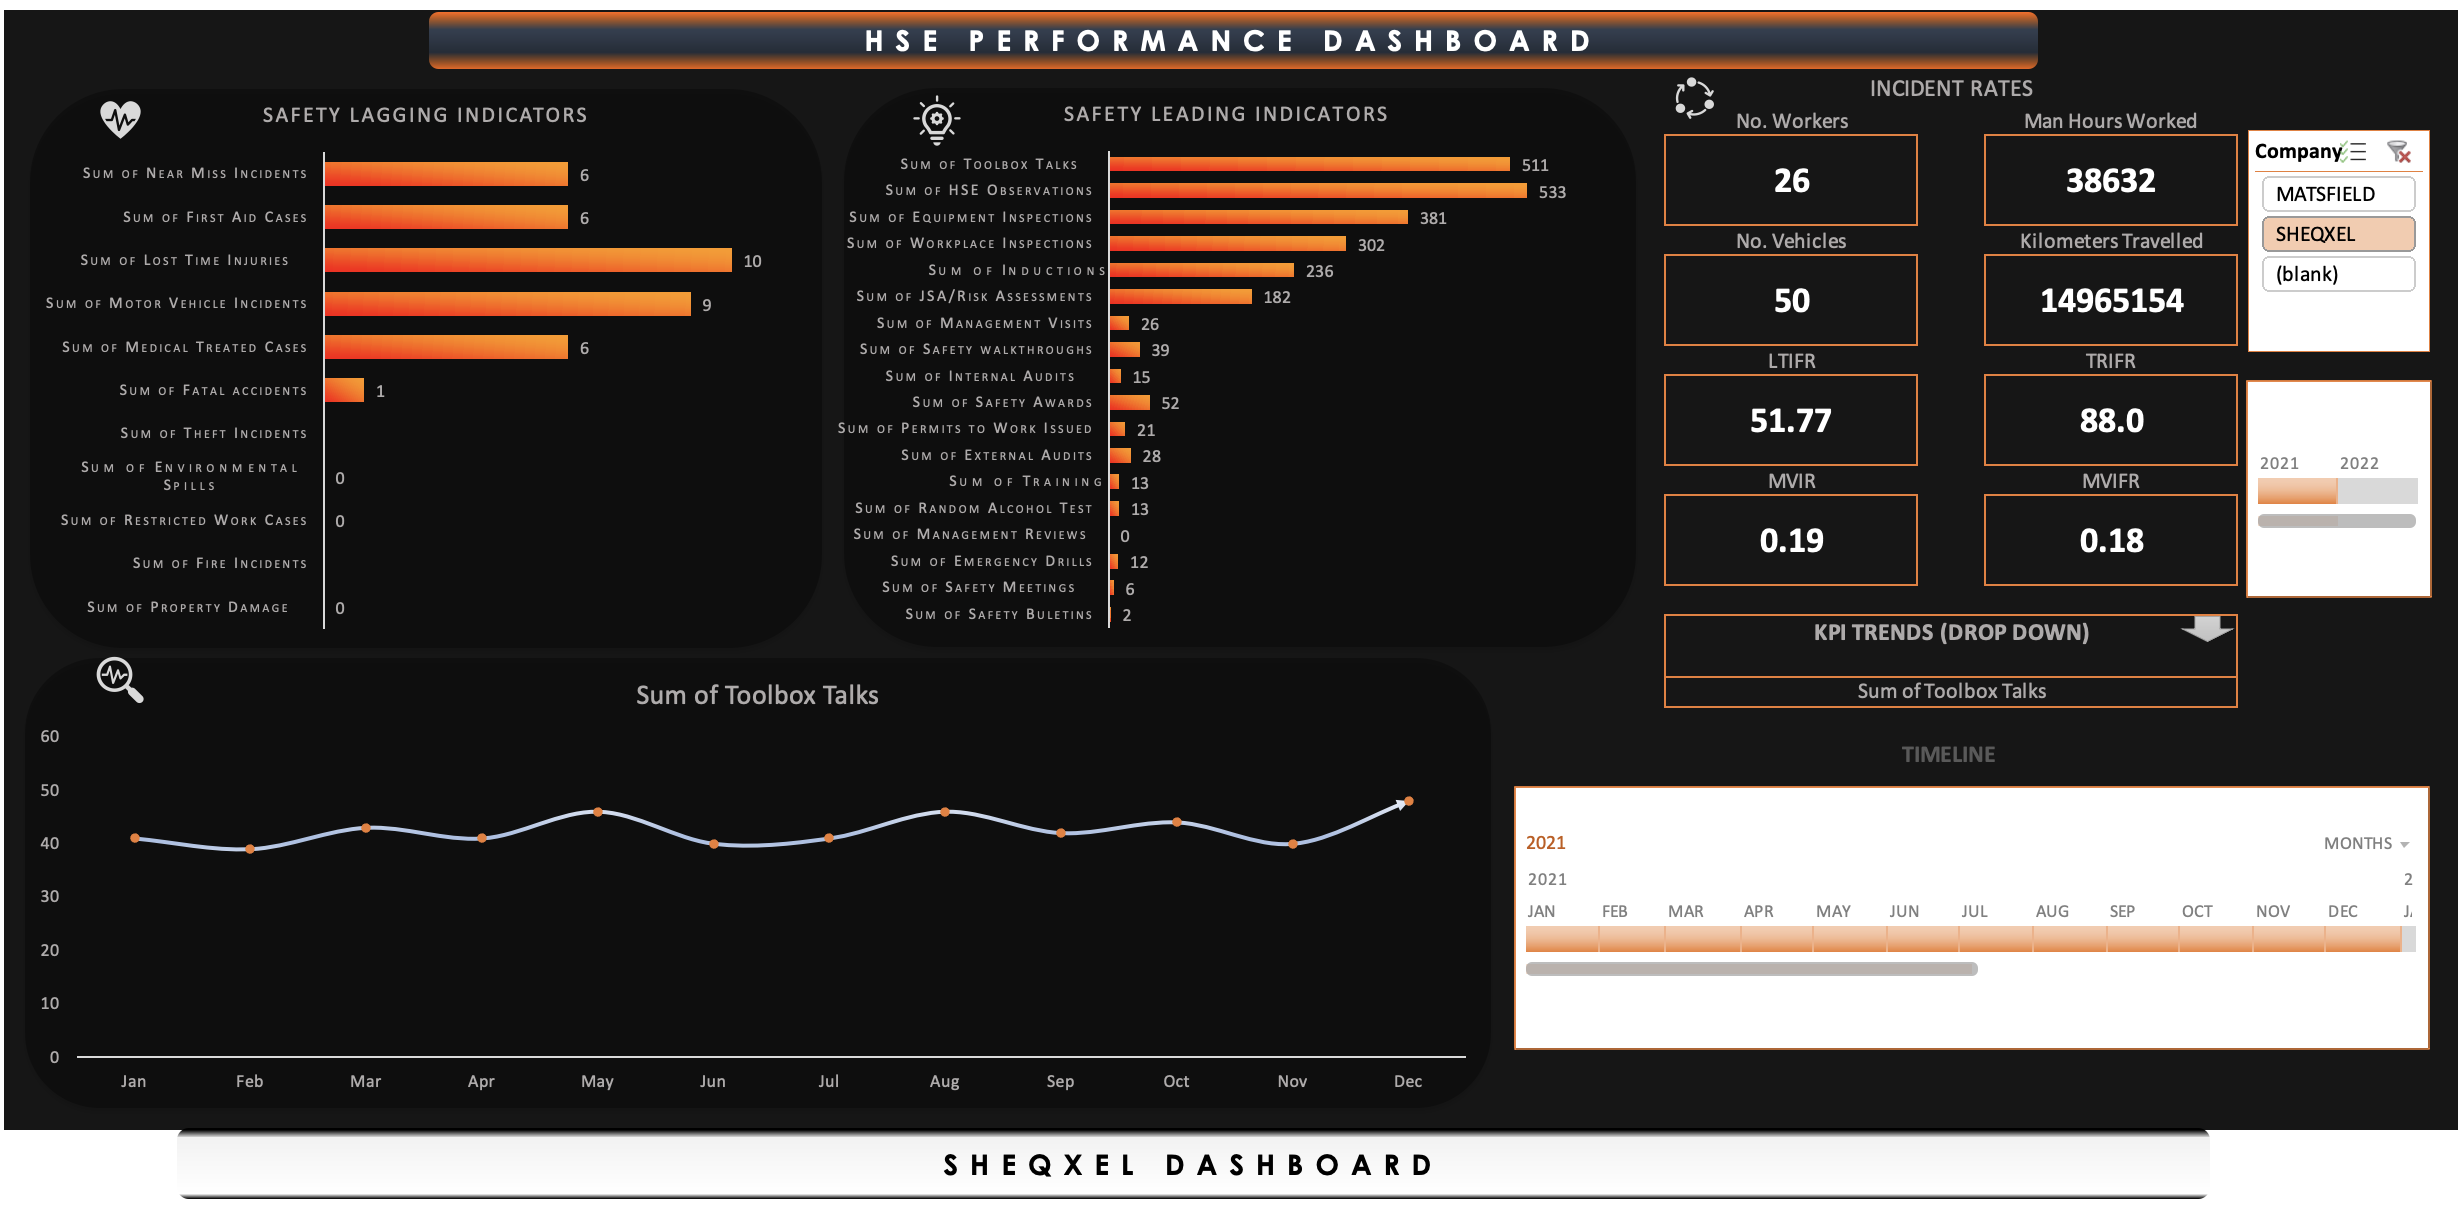
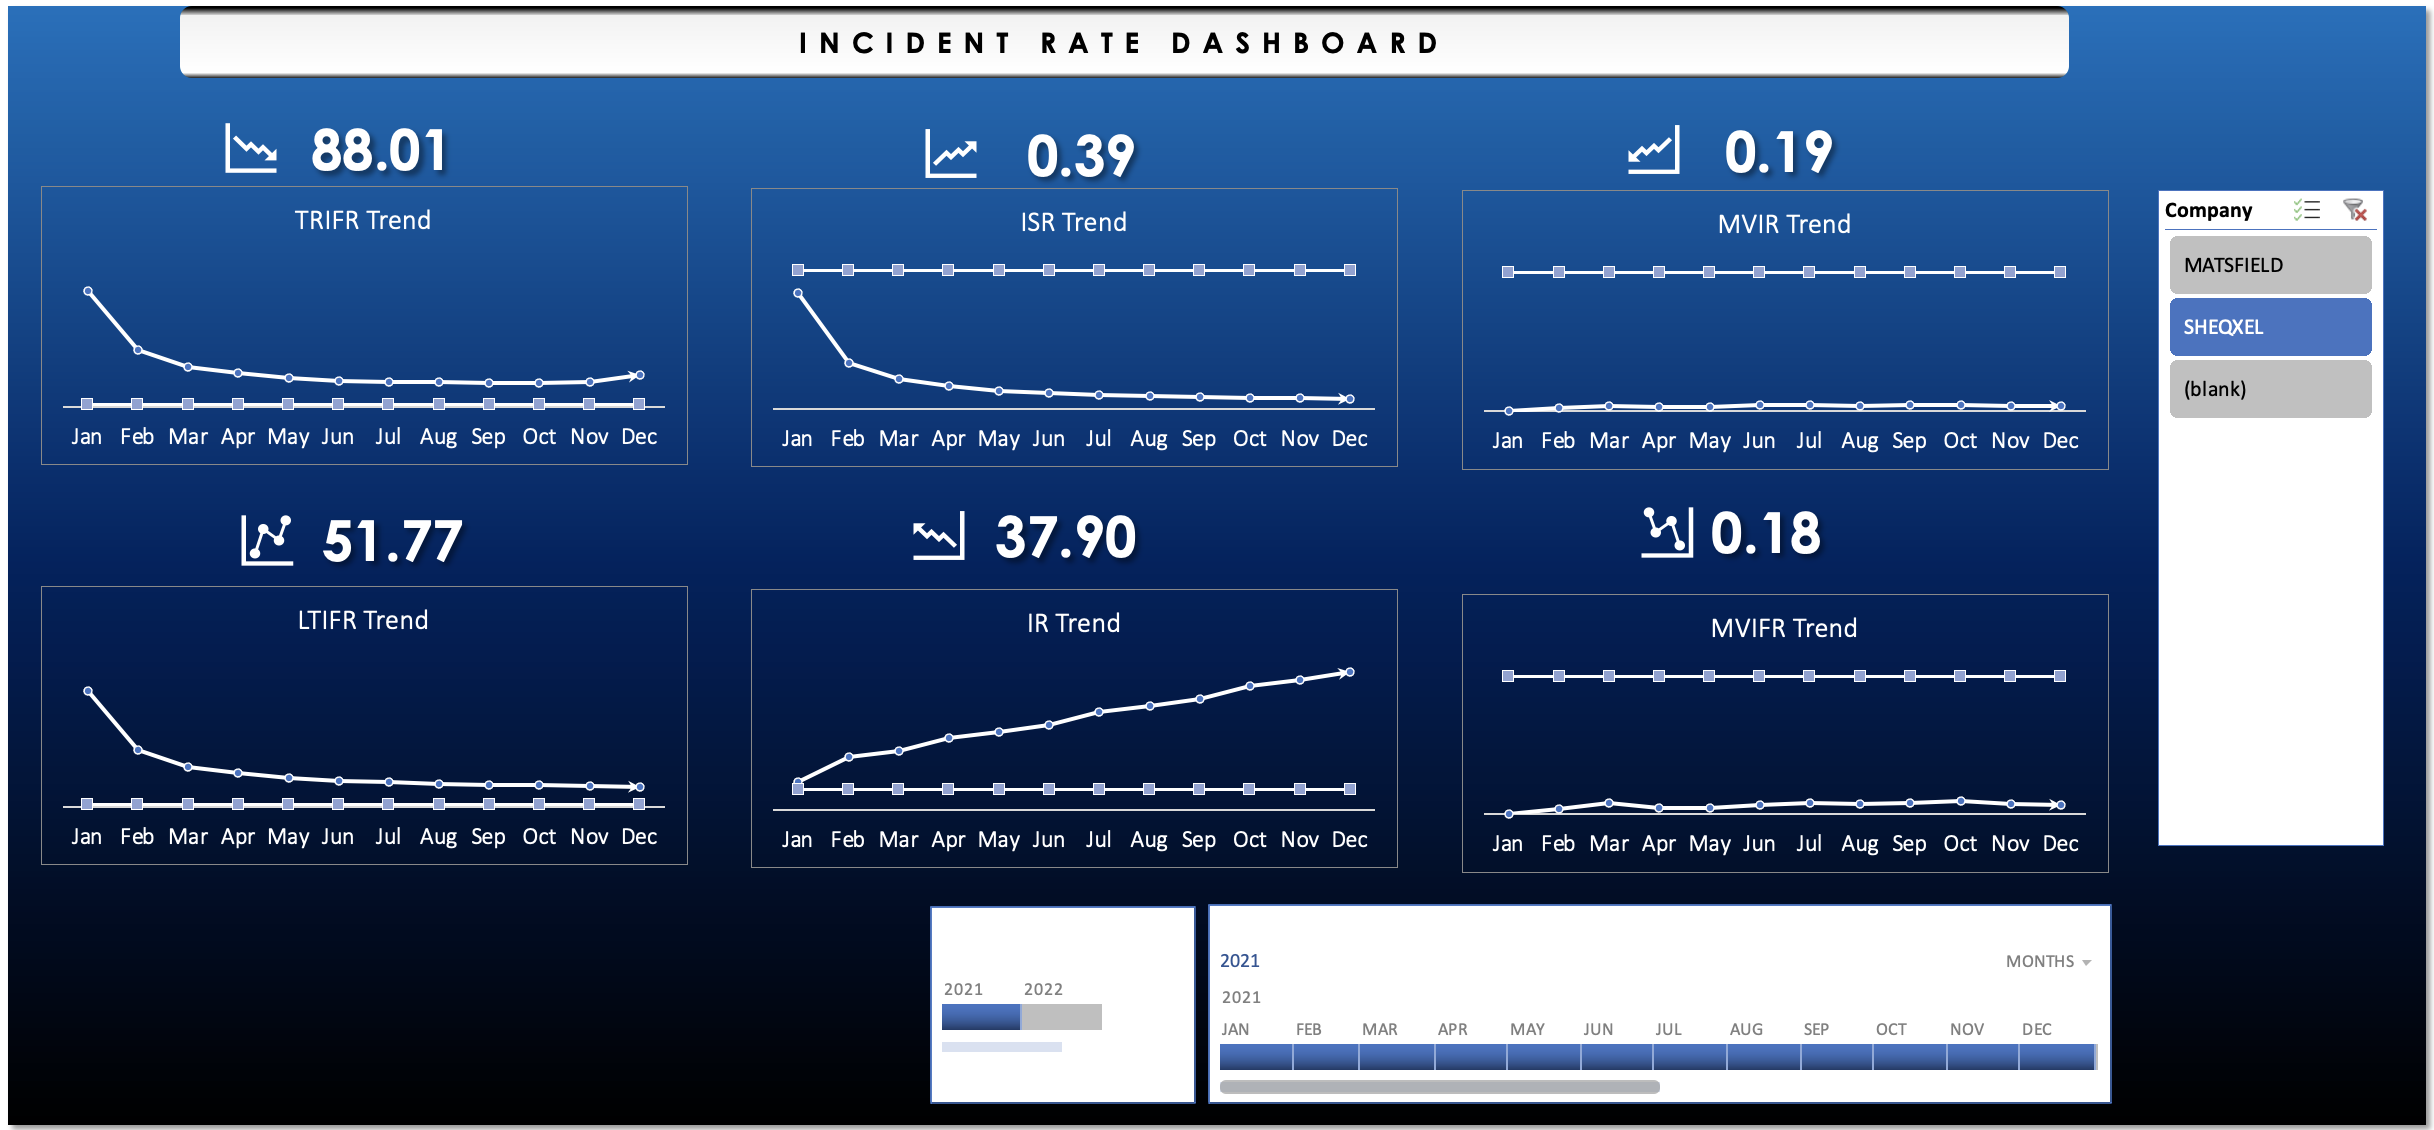
There are 10 fully dynamic dashboards, each focusing on specific safety management areas:
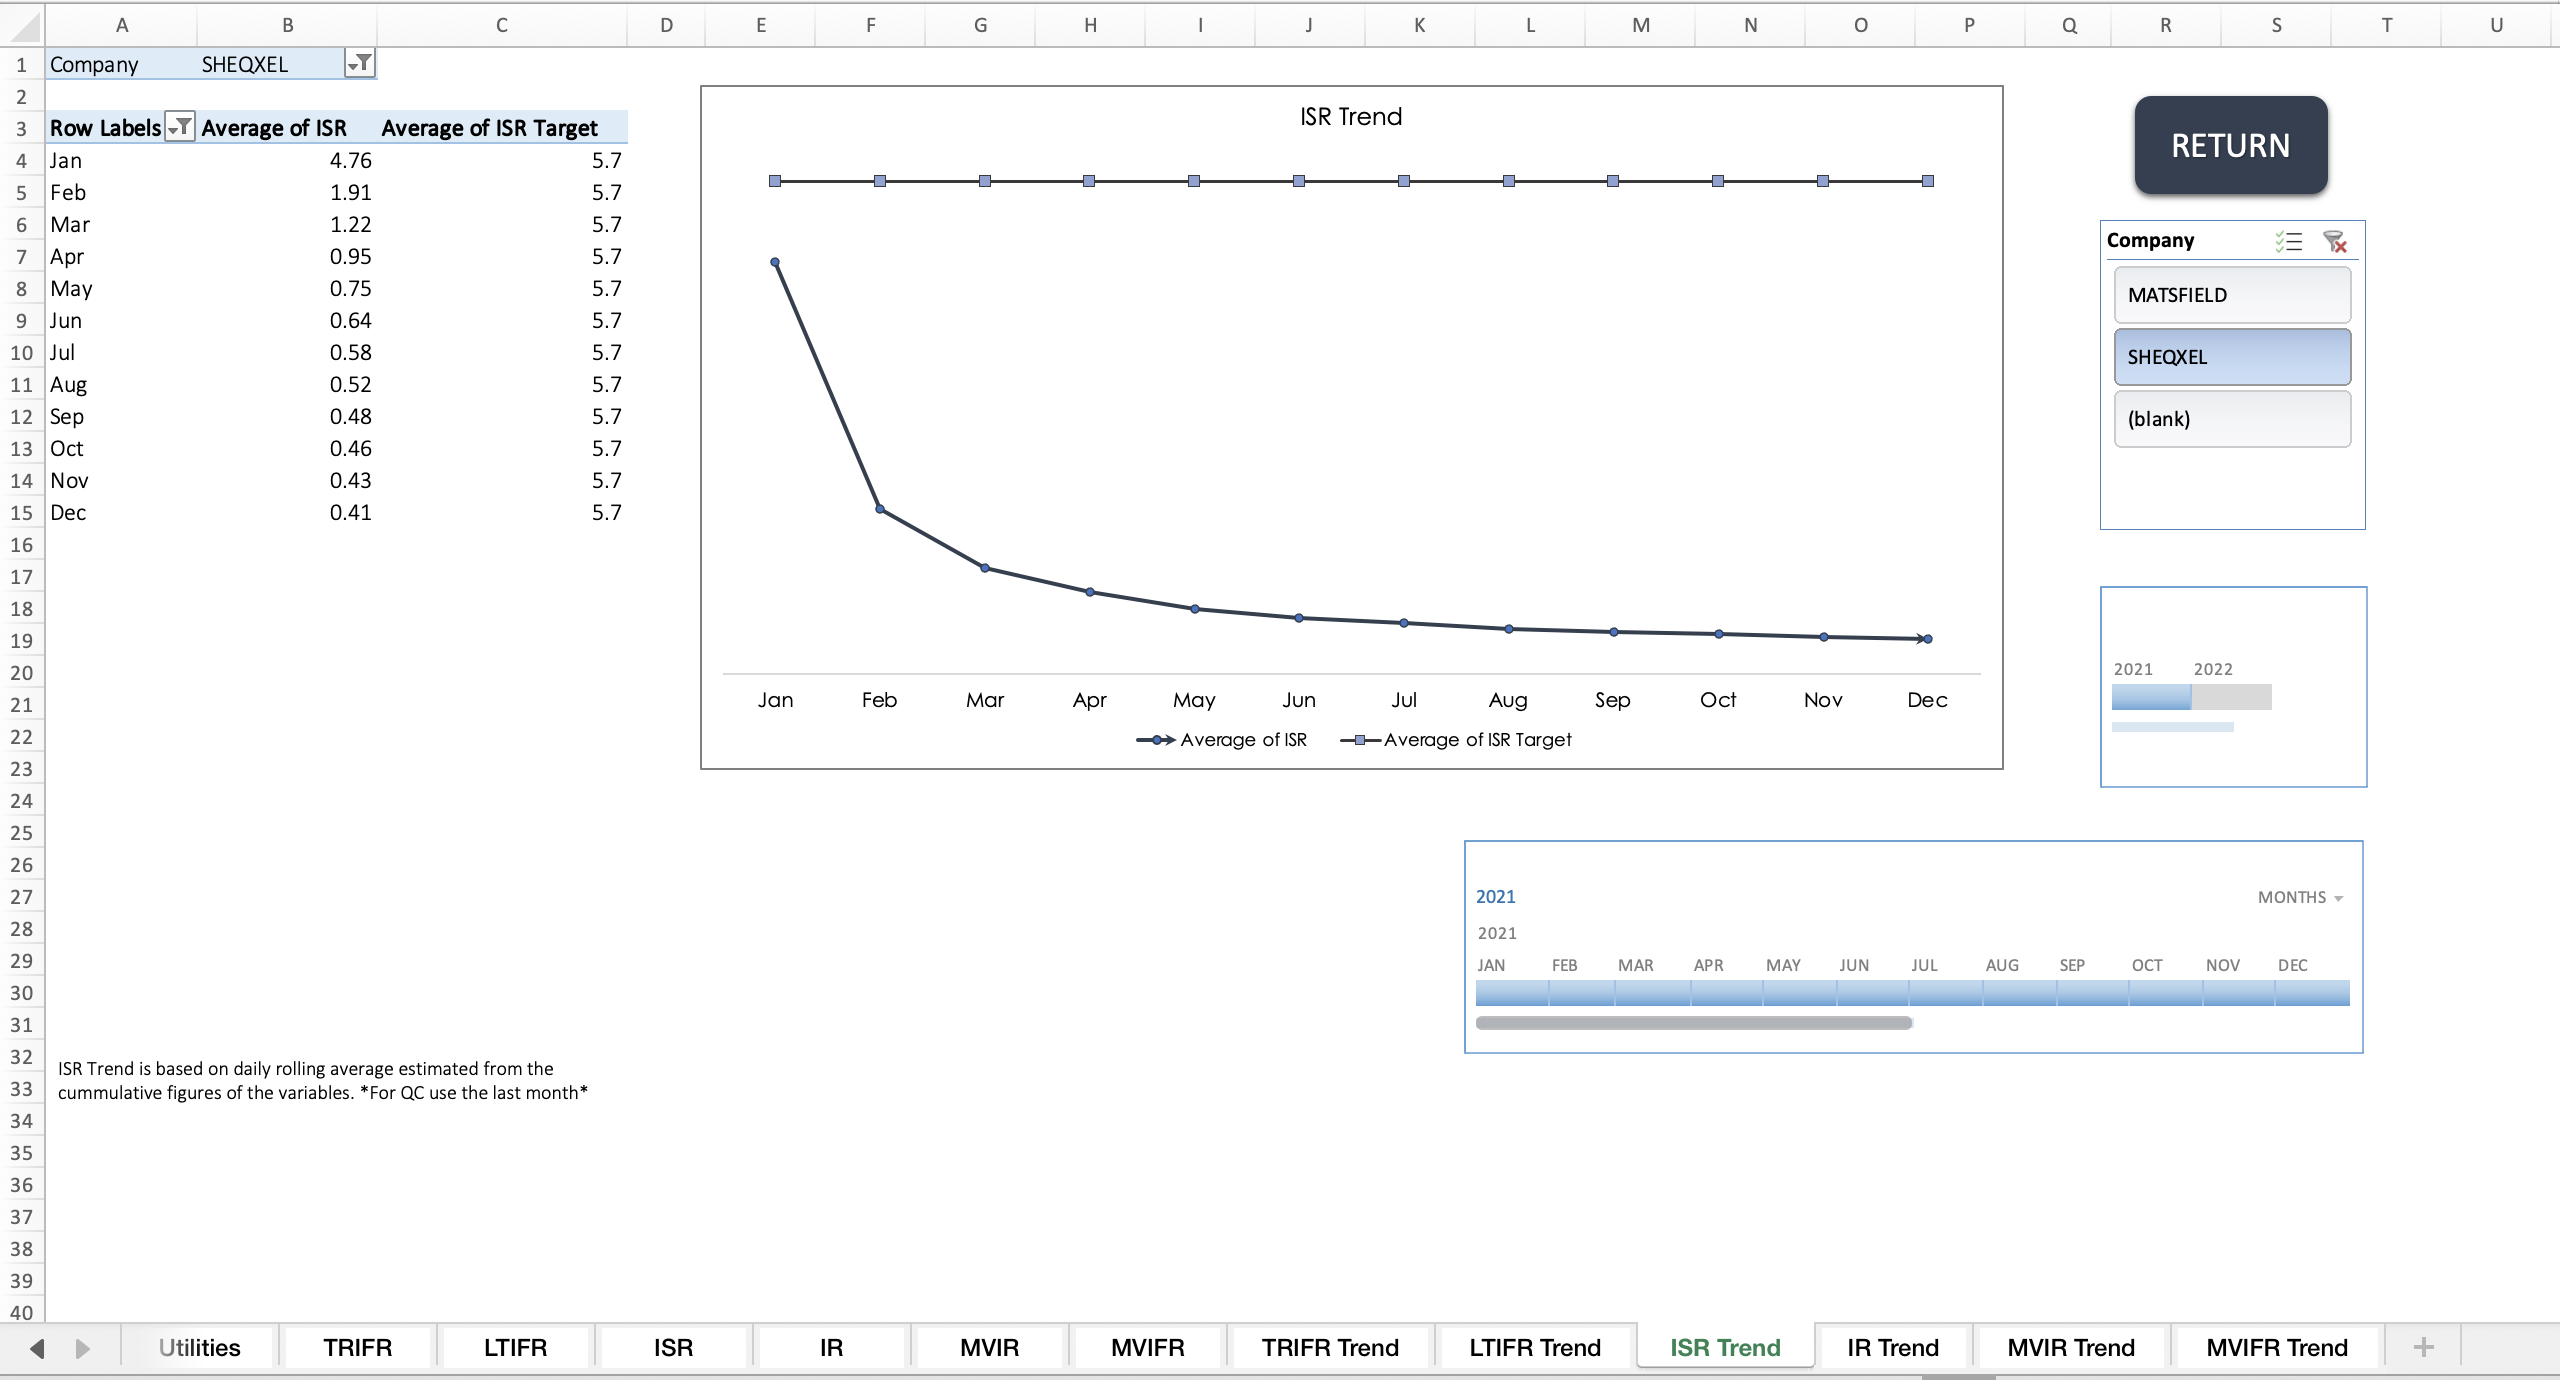
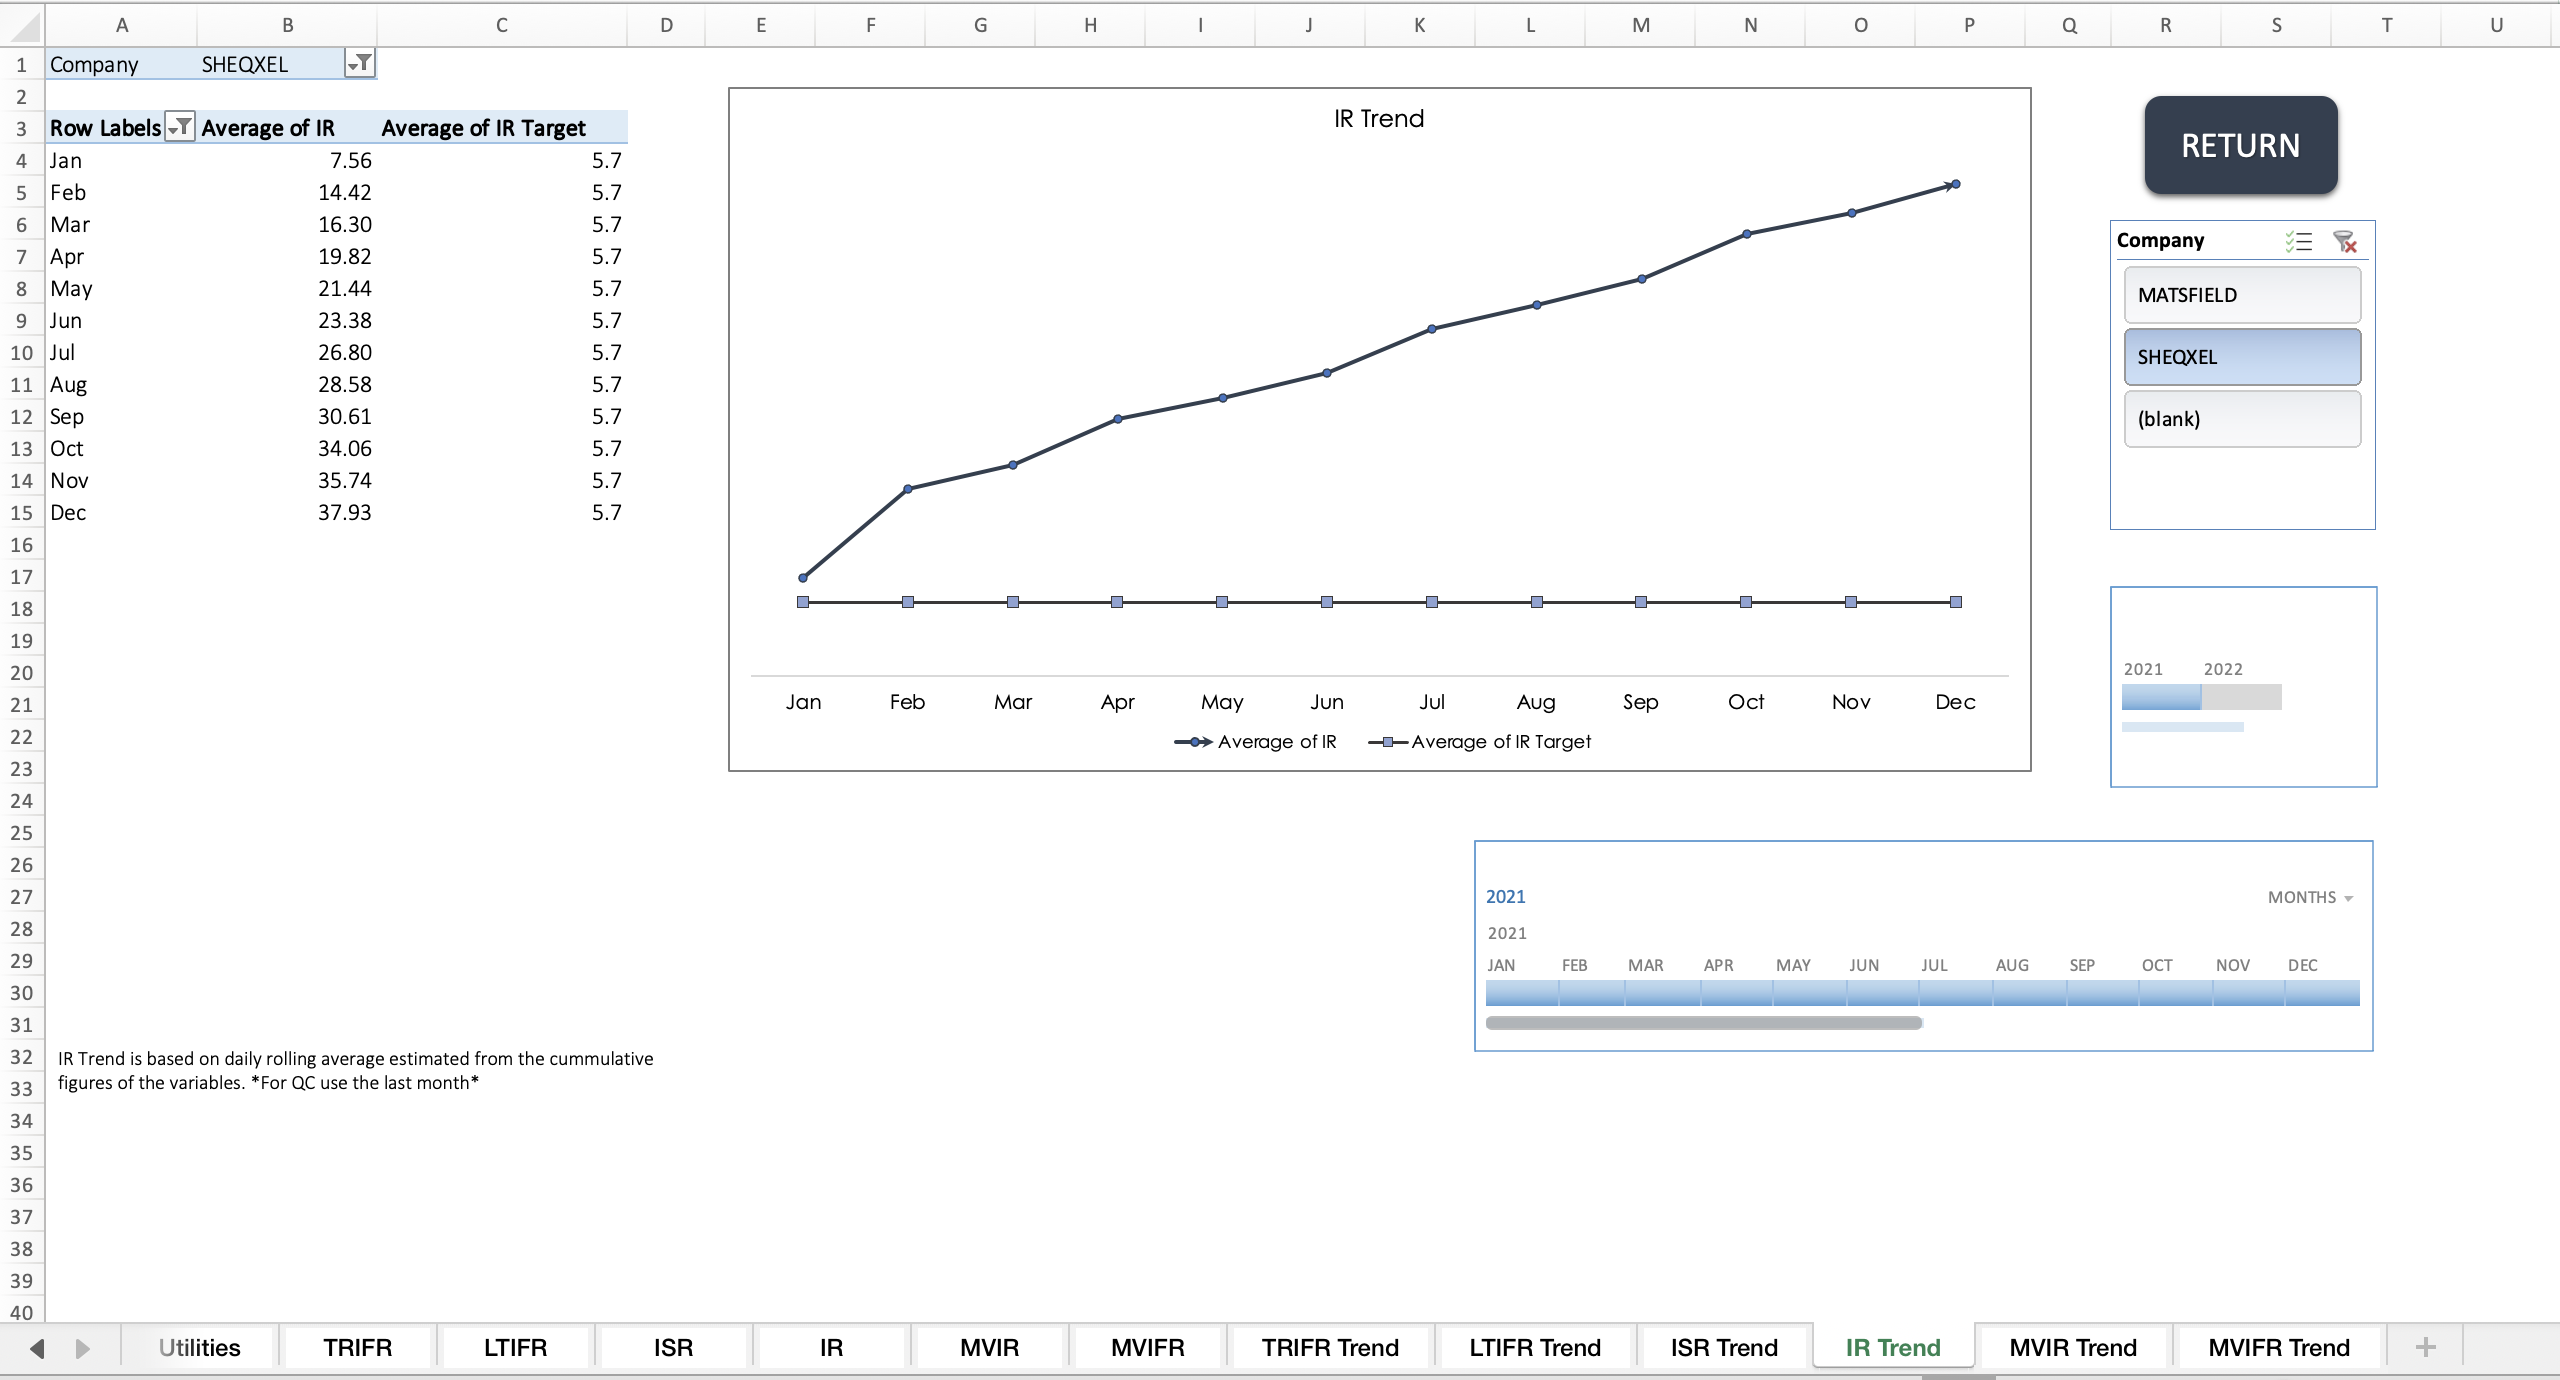
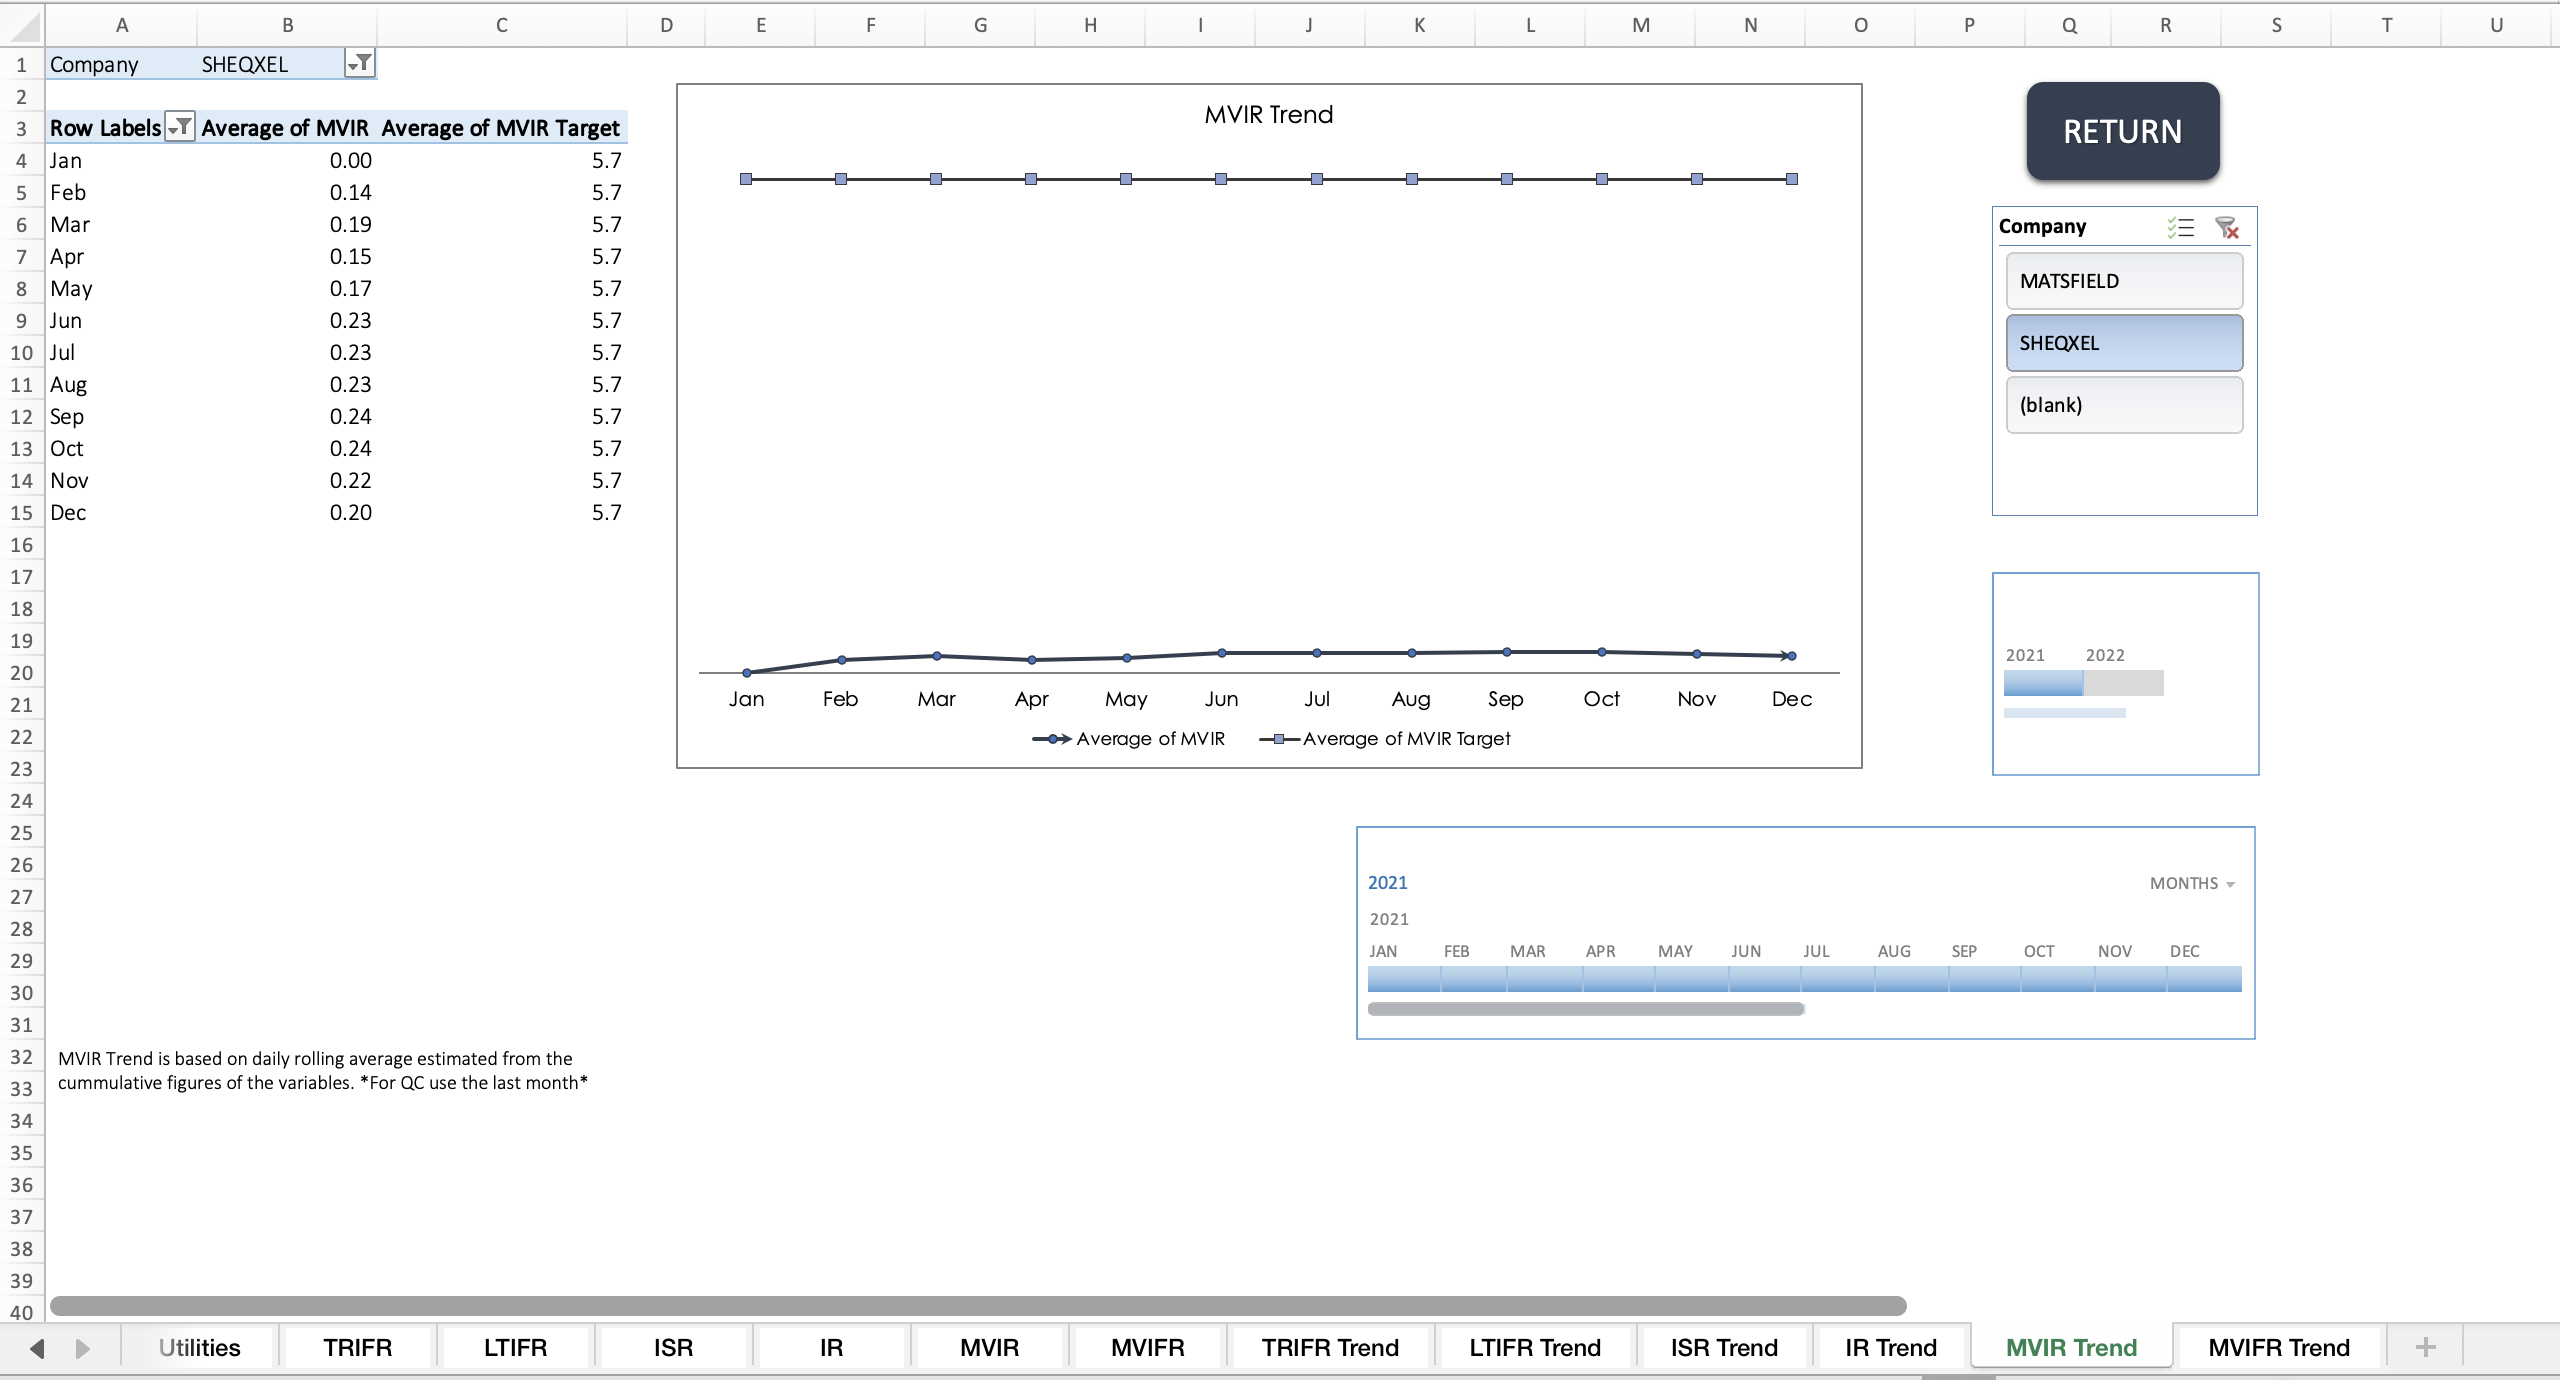
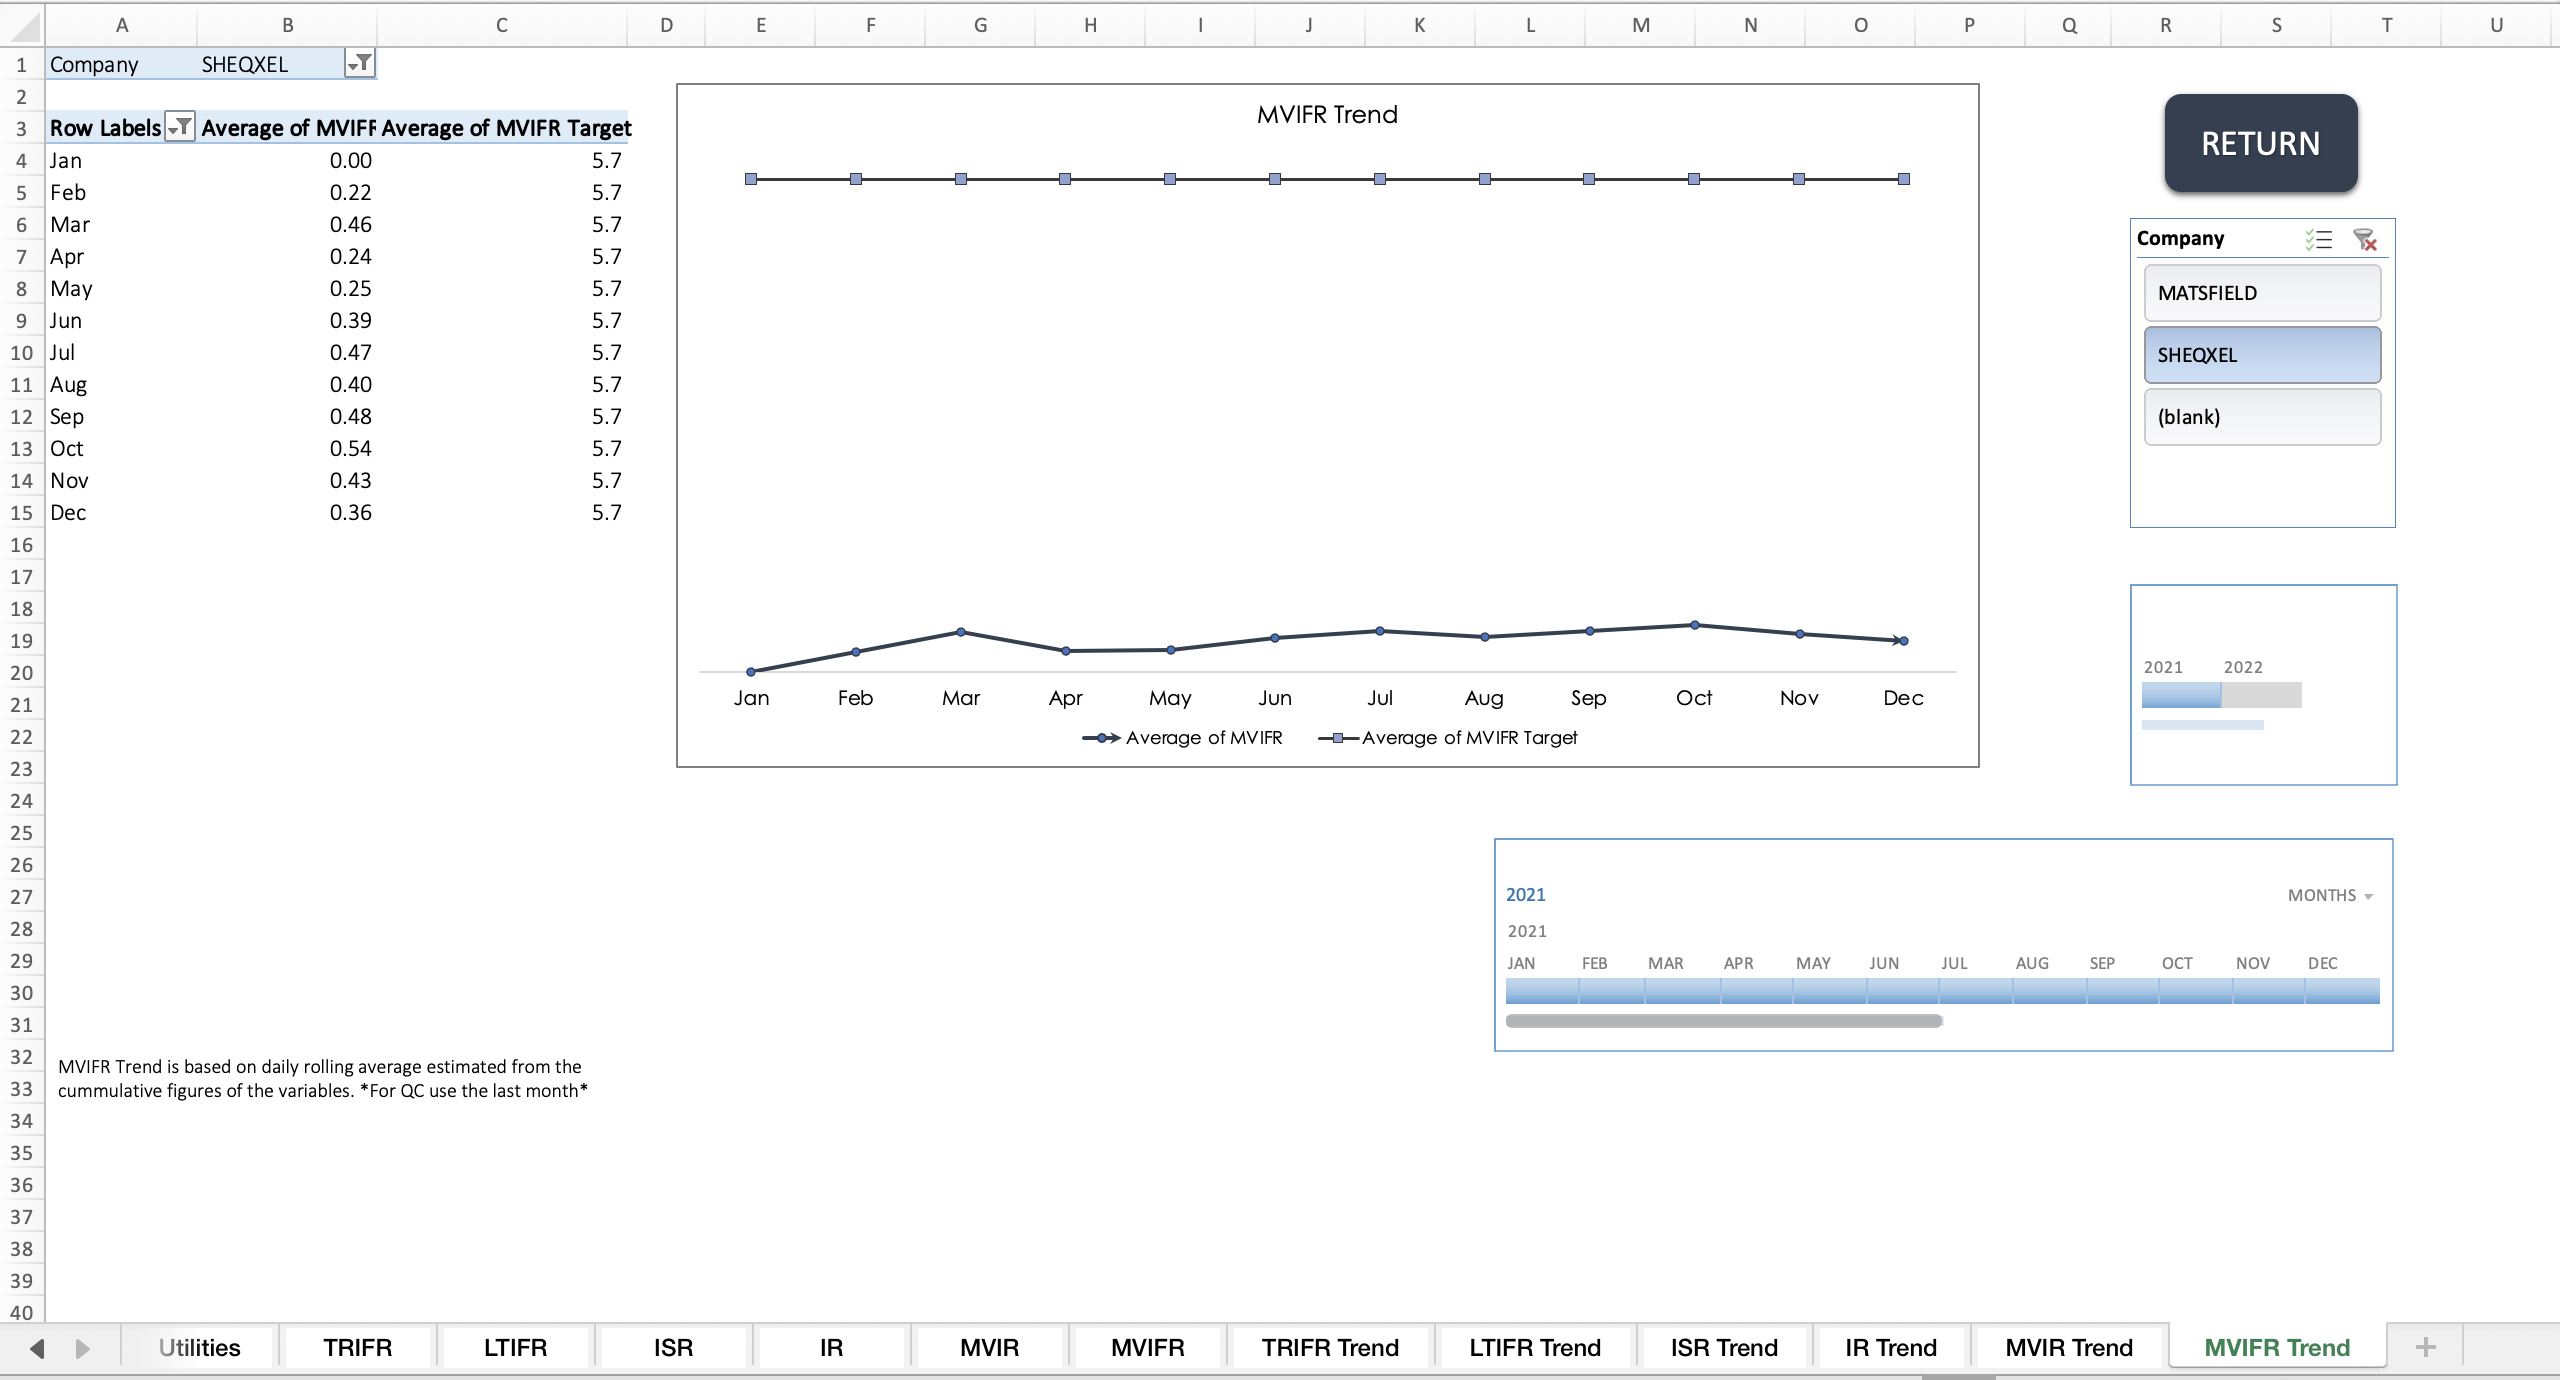
Performance Trend Dashboard
Targets Summary Dashboard
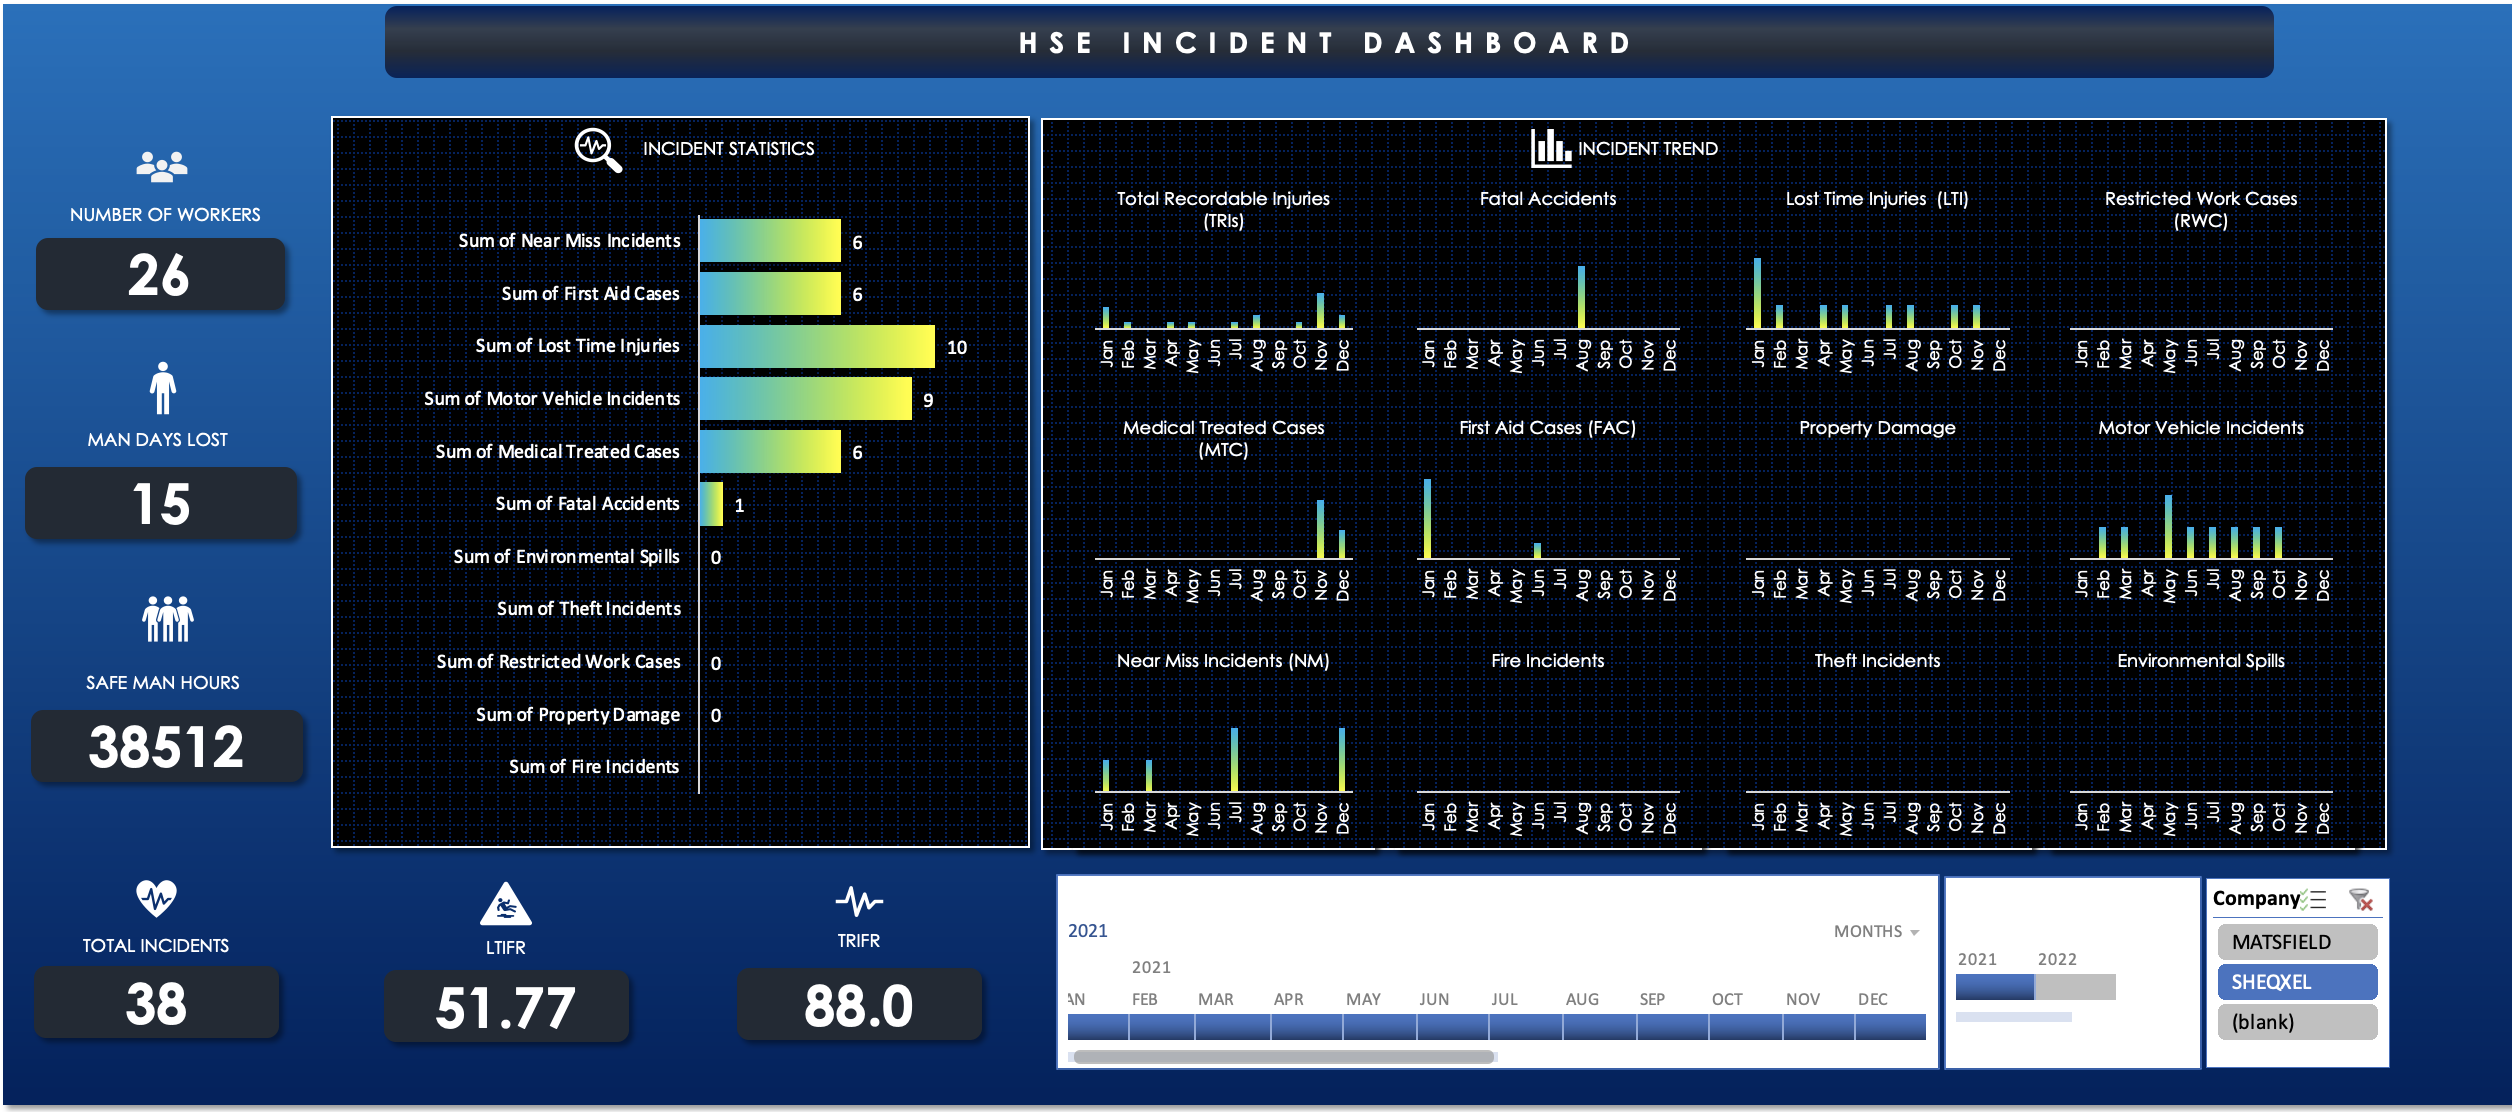
Incident Dashboard
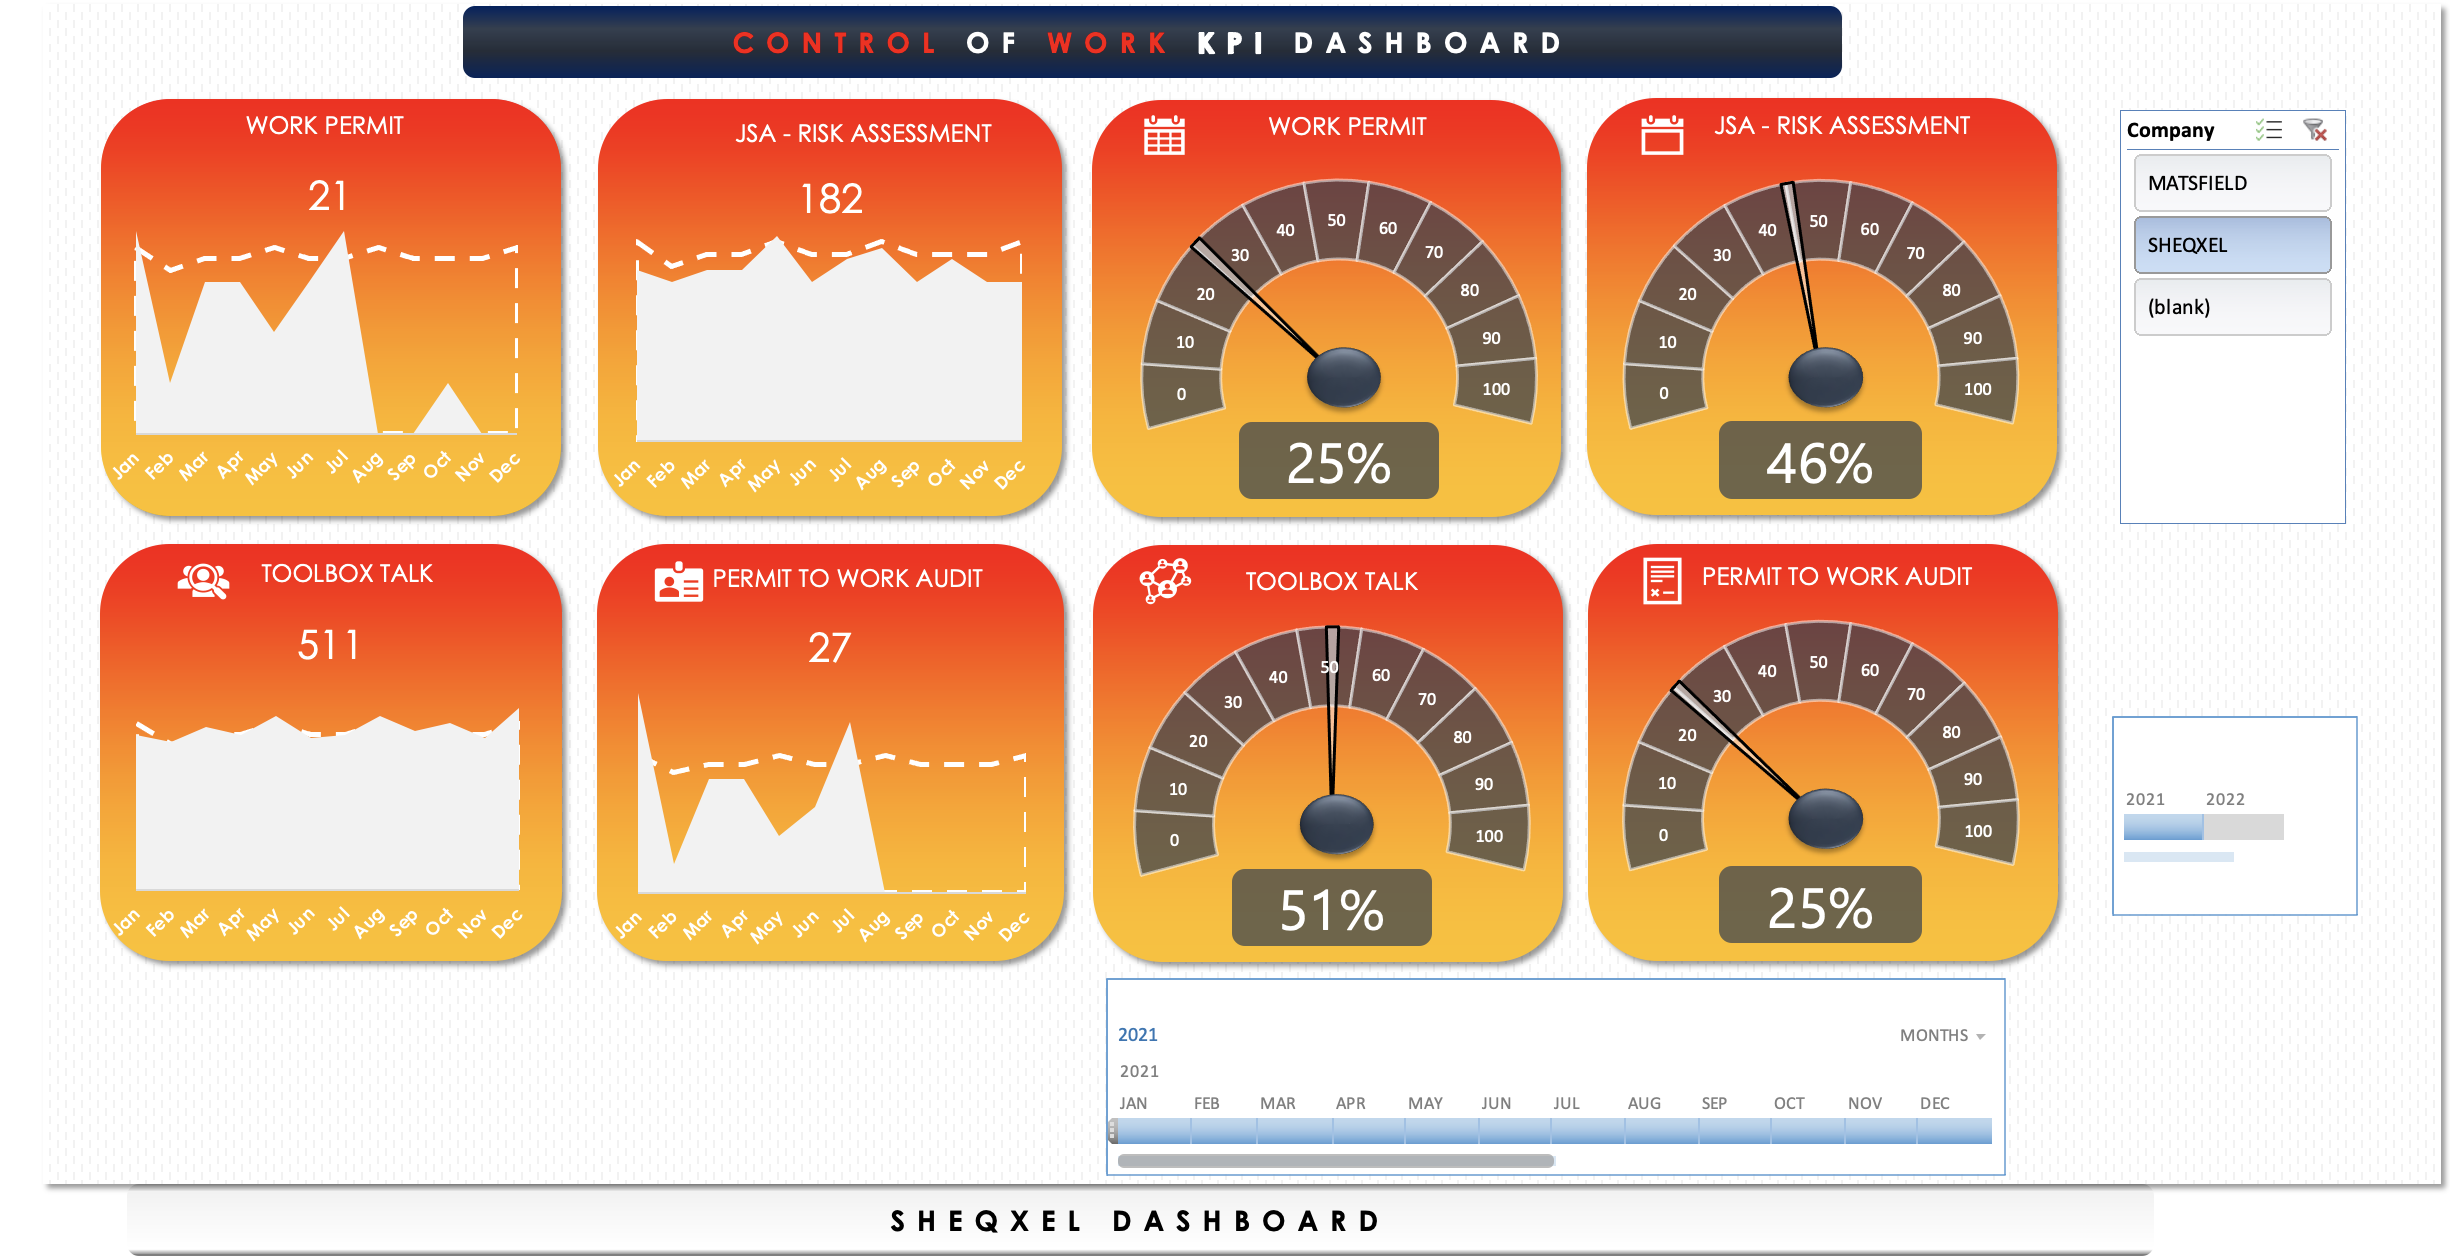
Control of Work (CoW) Dashboard
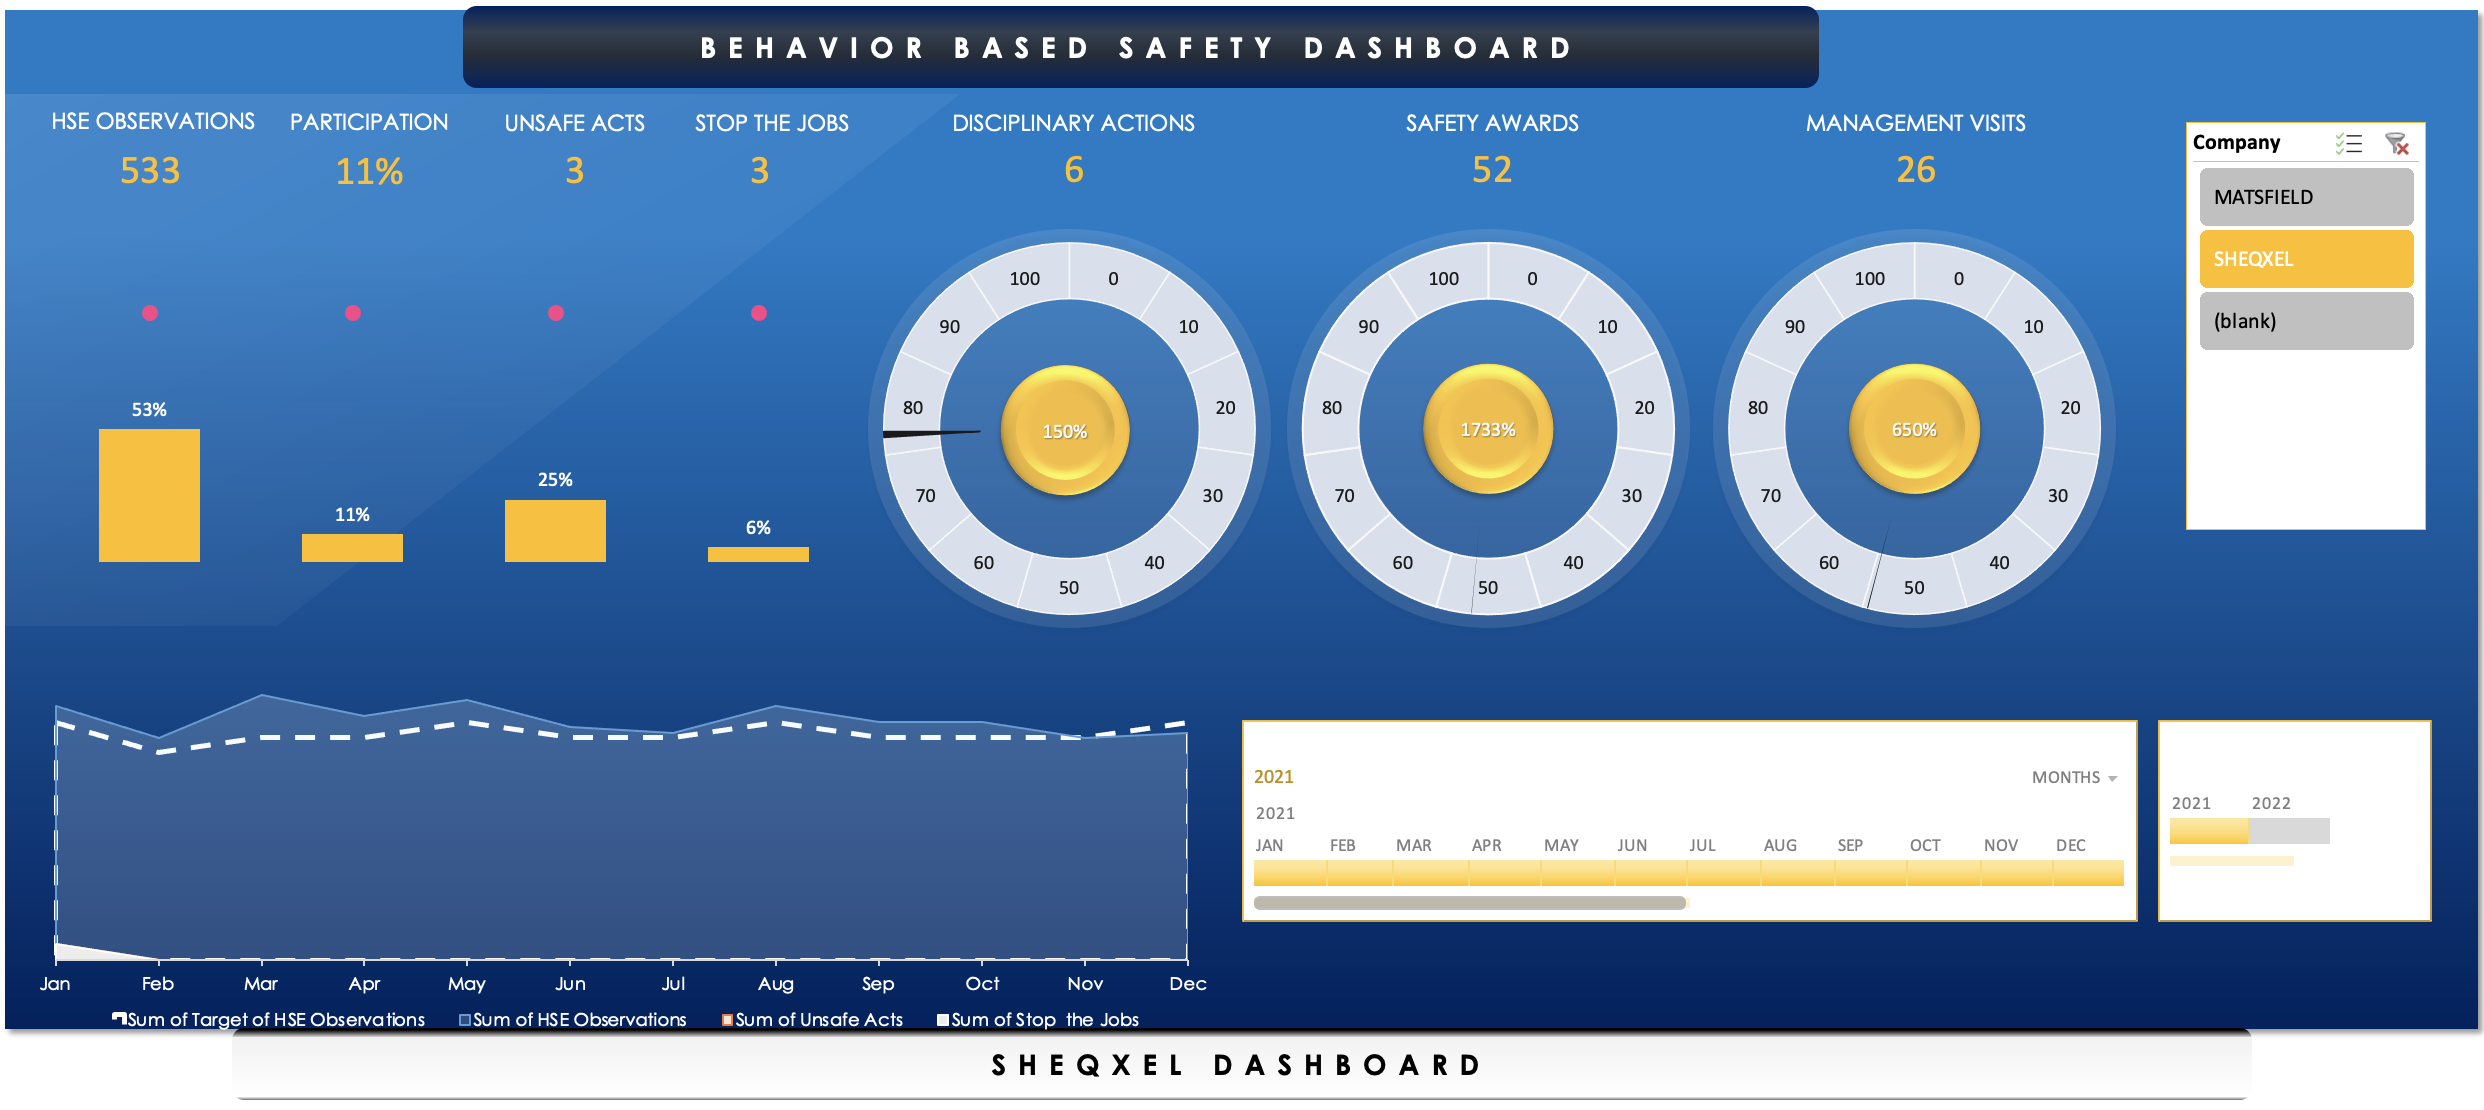
Behavior Based Safety (BBS) Dashboard
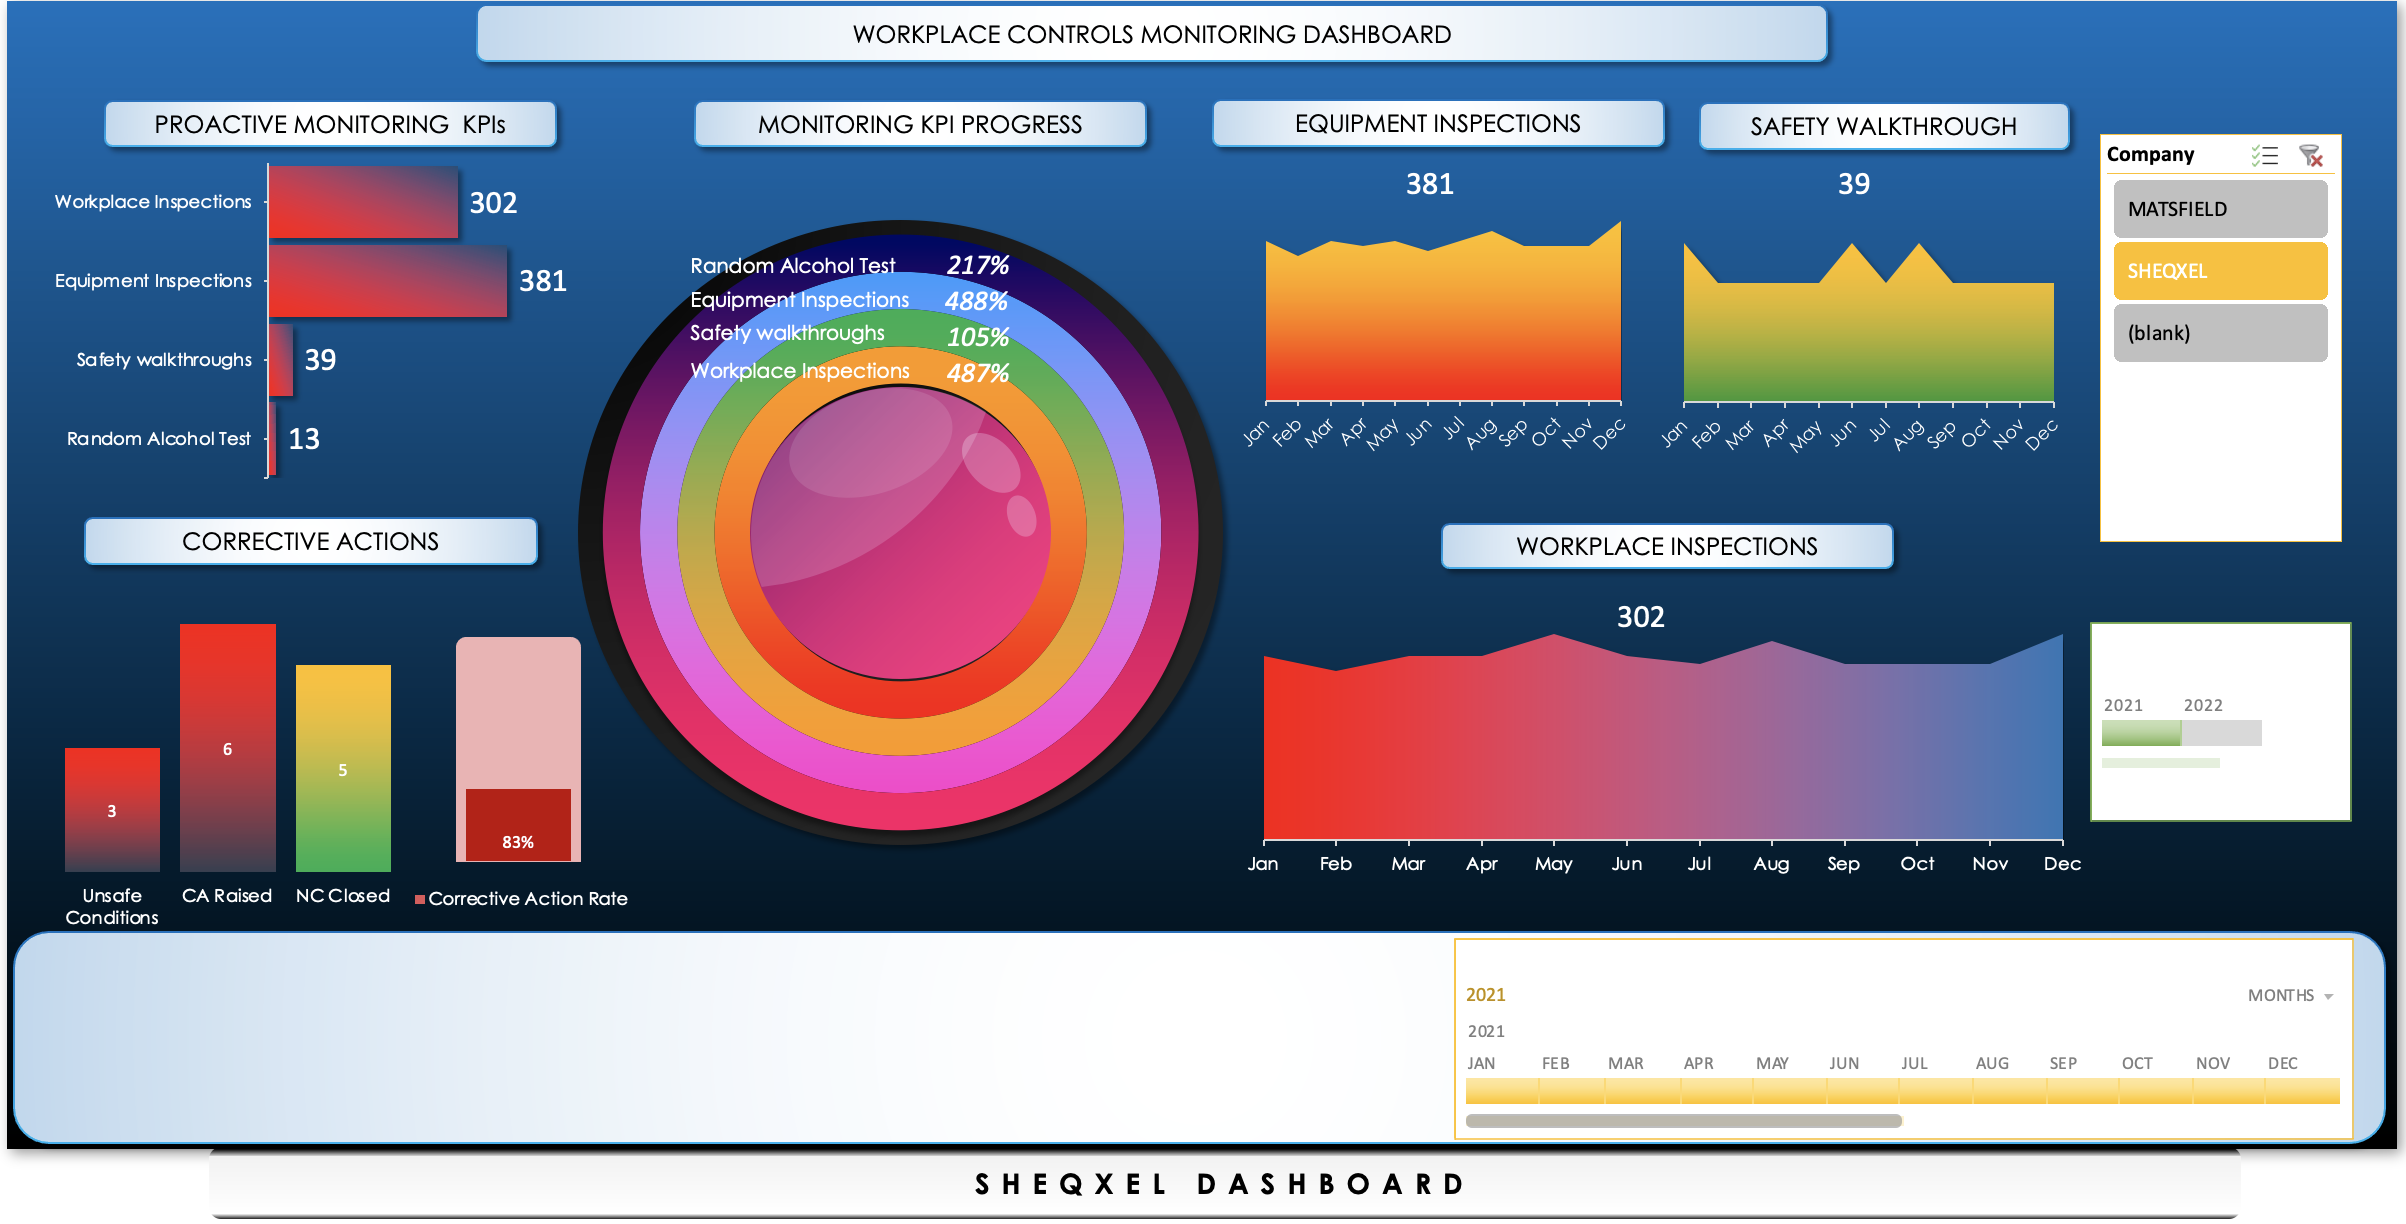
Workplace Control Monitoring (WCM) Dashboard
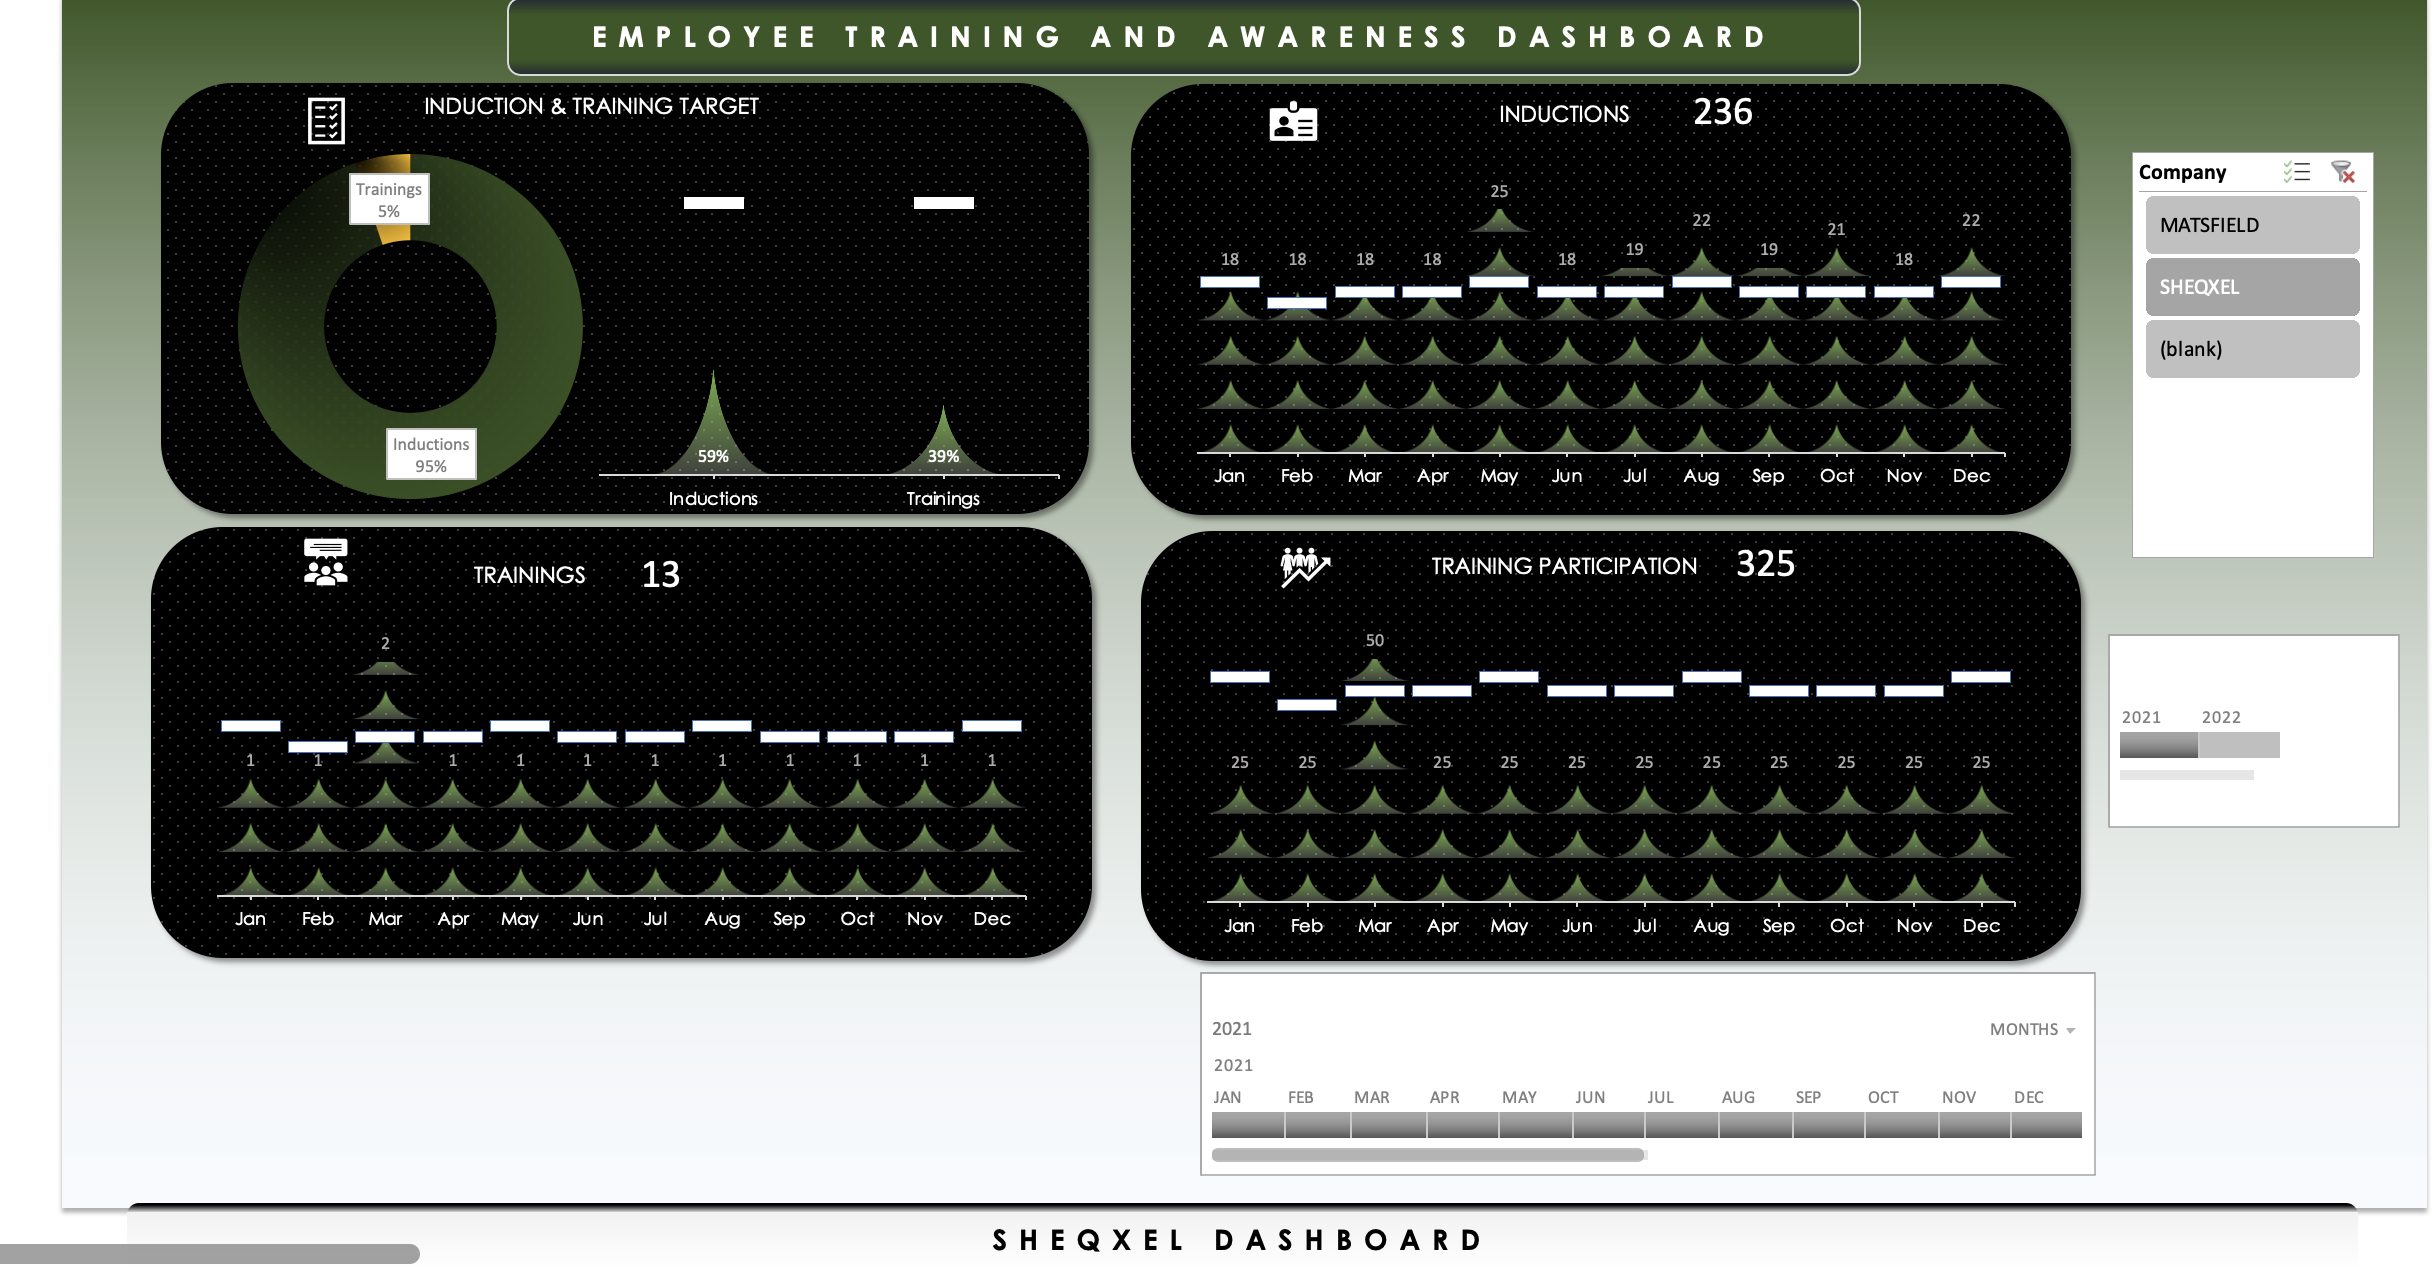
Employee Training and Awareness (ETA) Dashboard
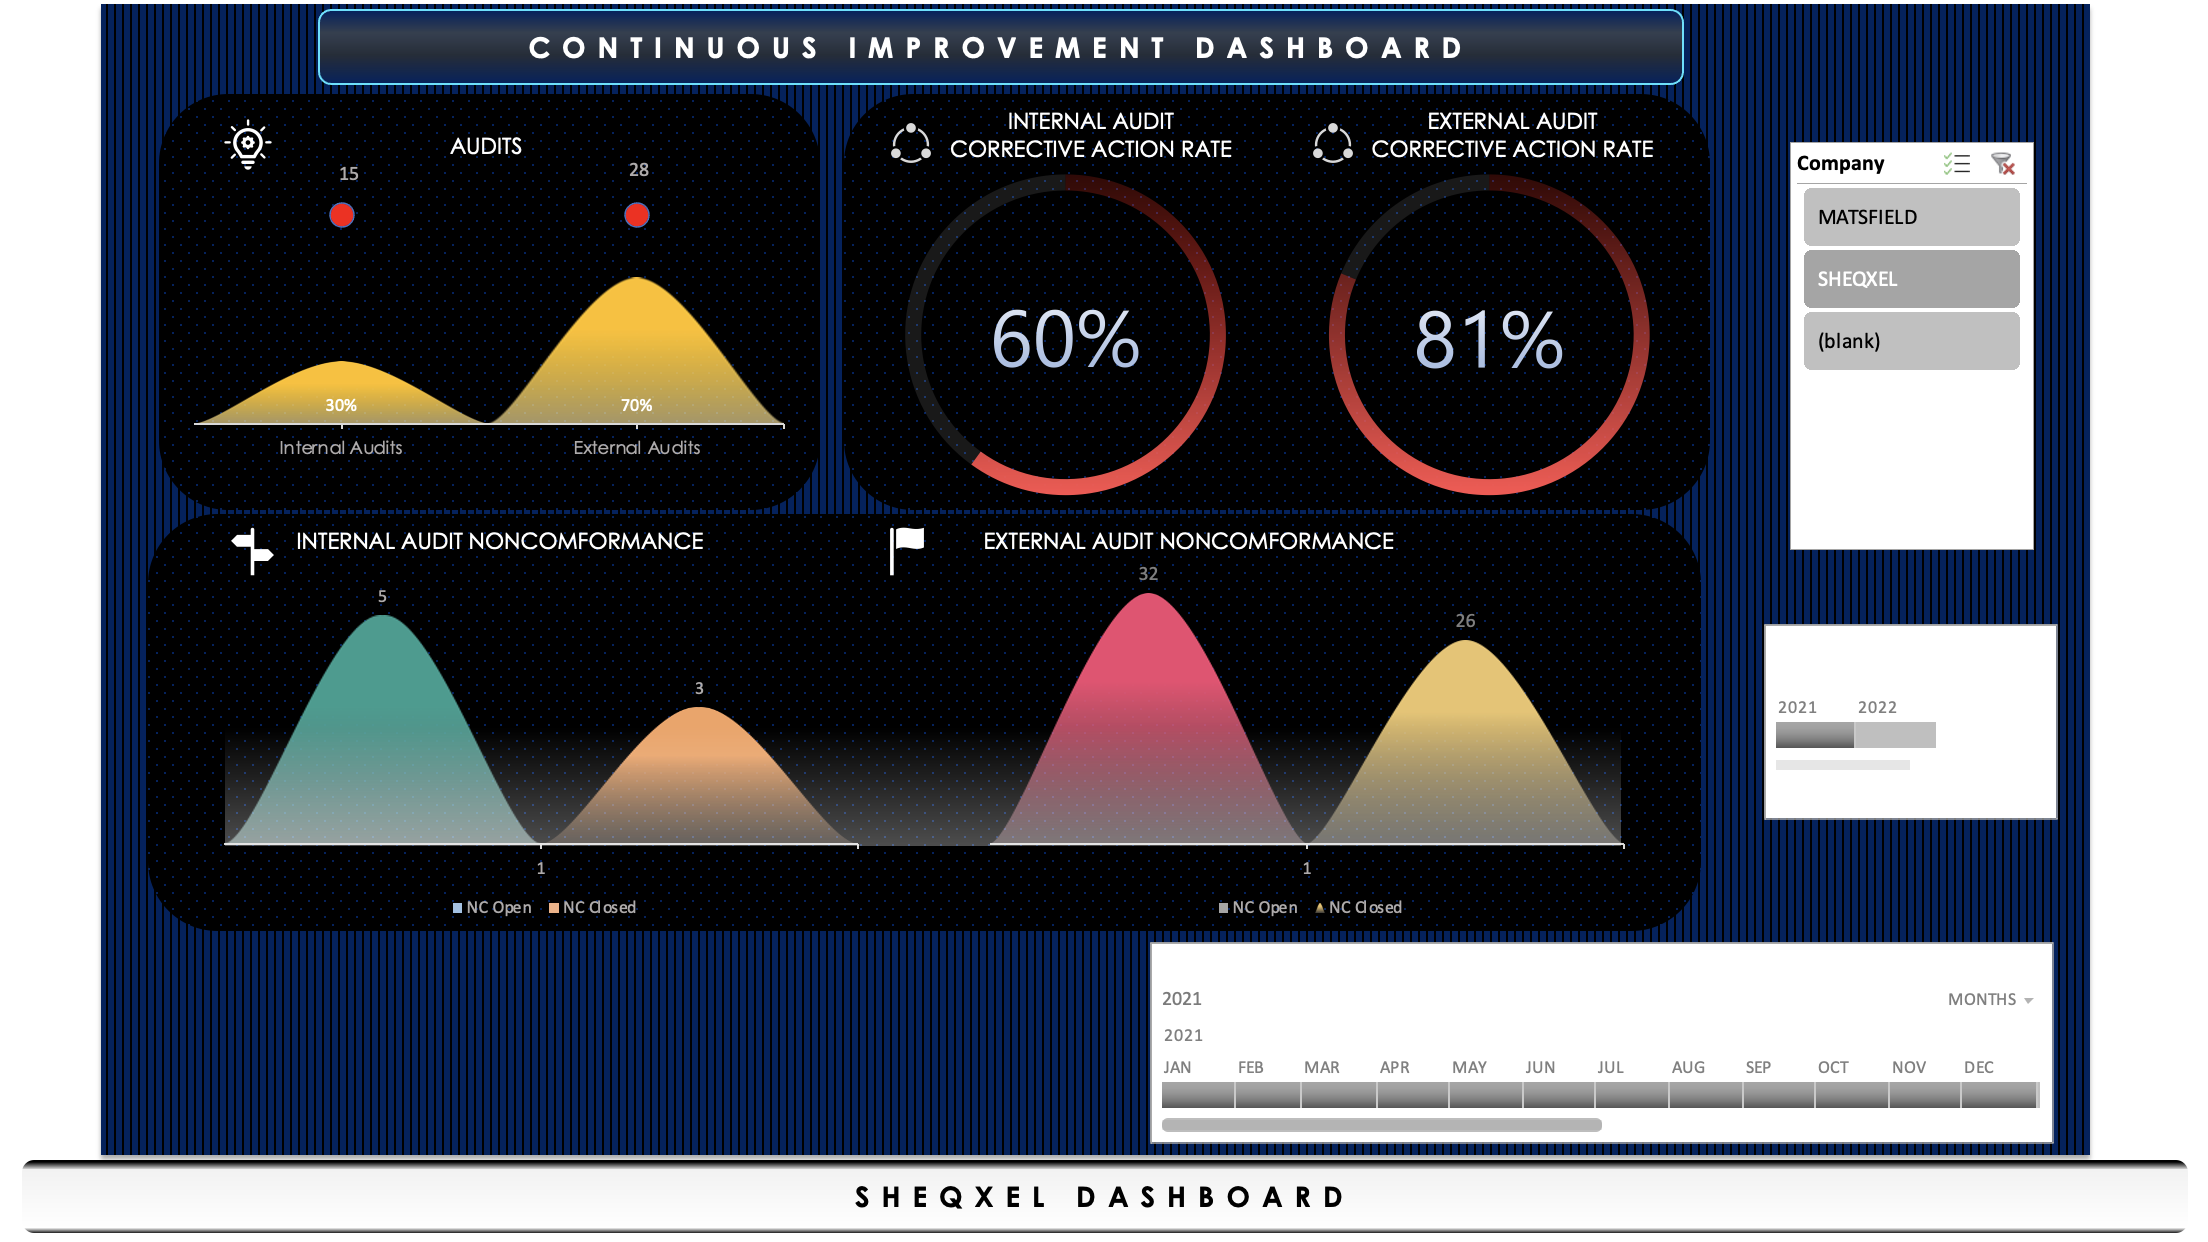
Continual Improvement (CI) Dashboard
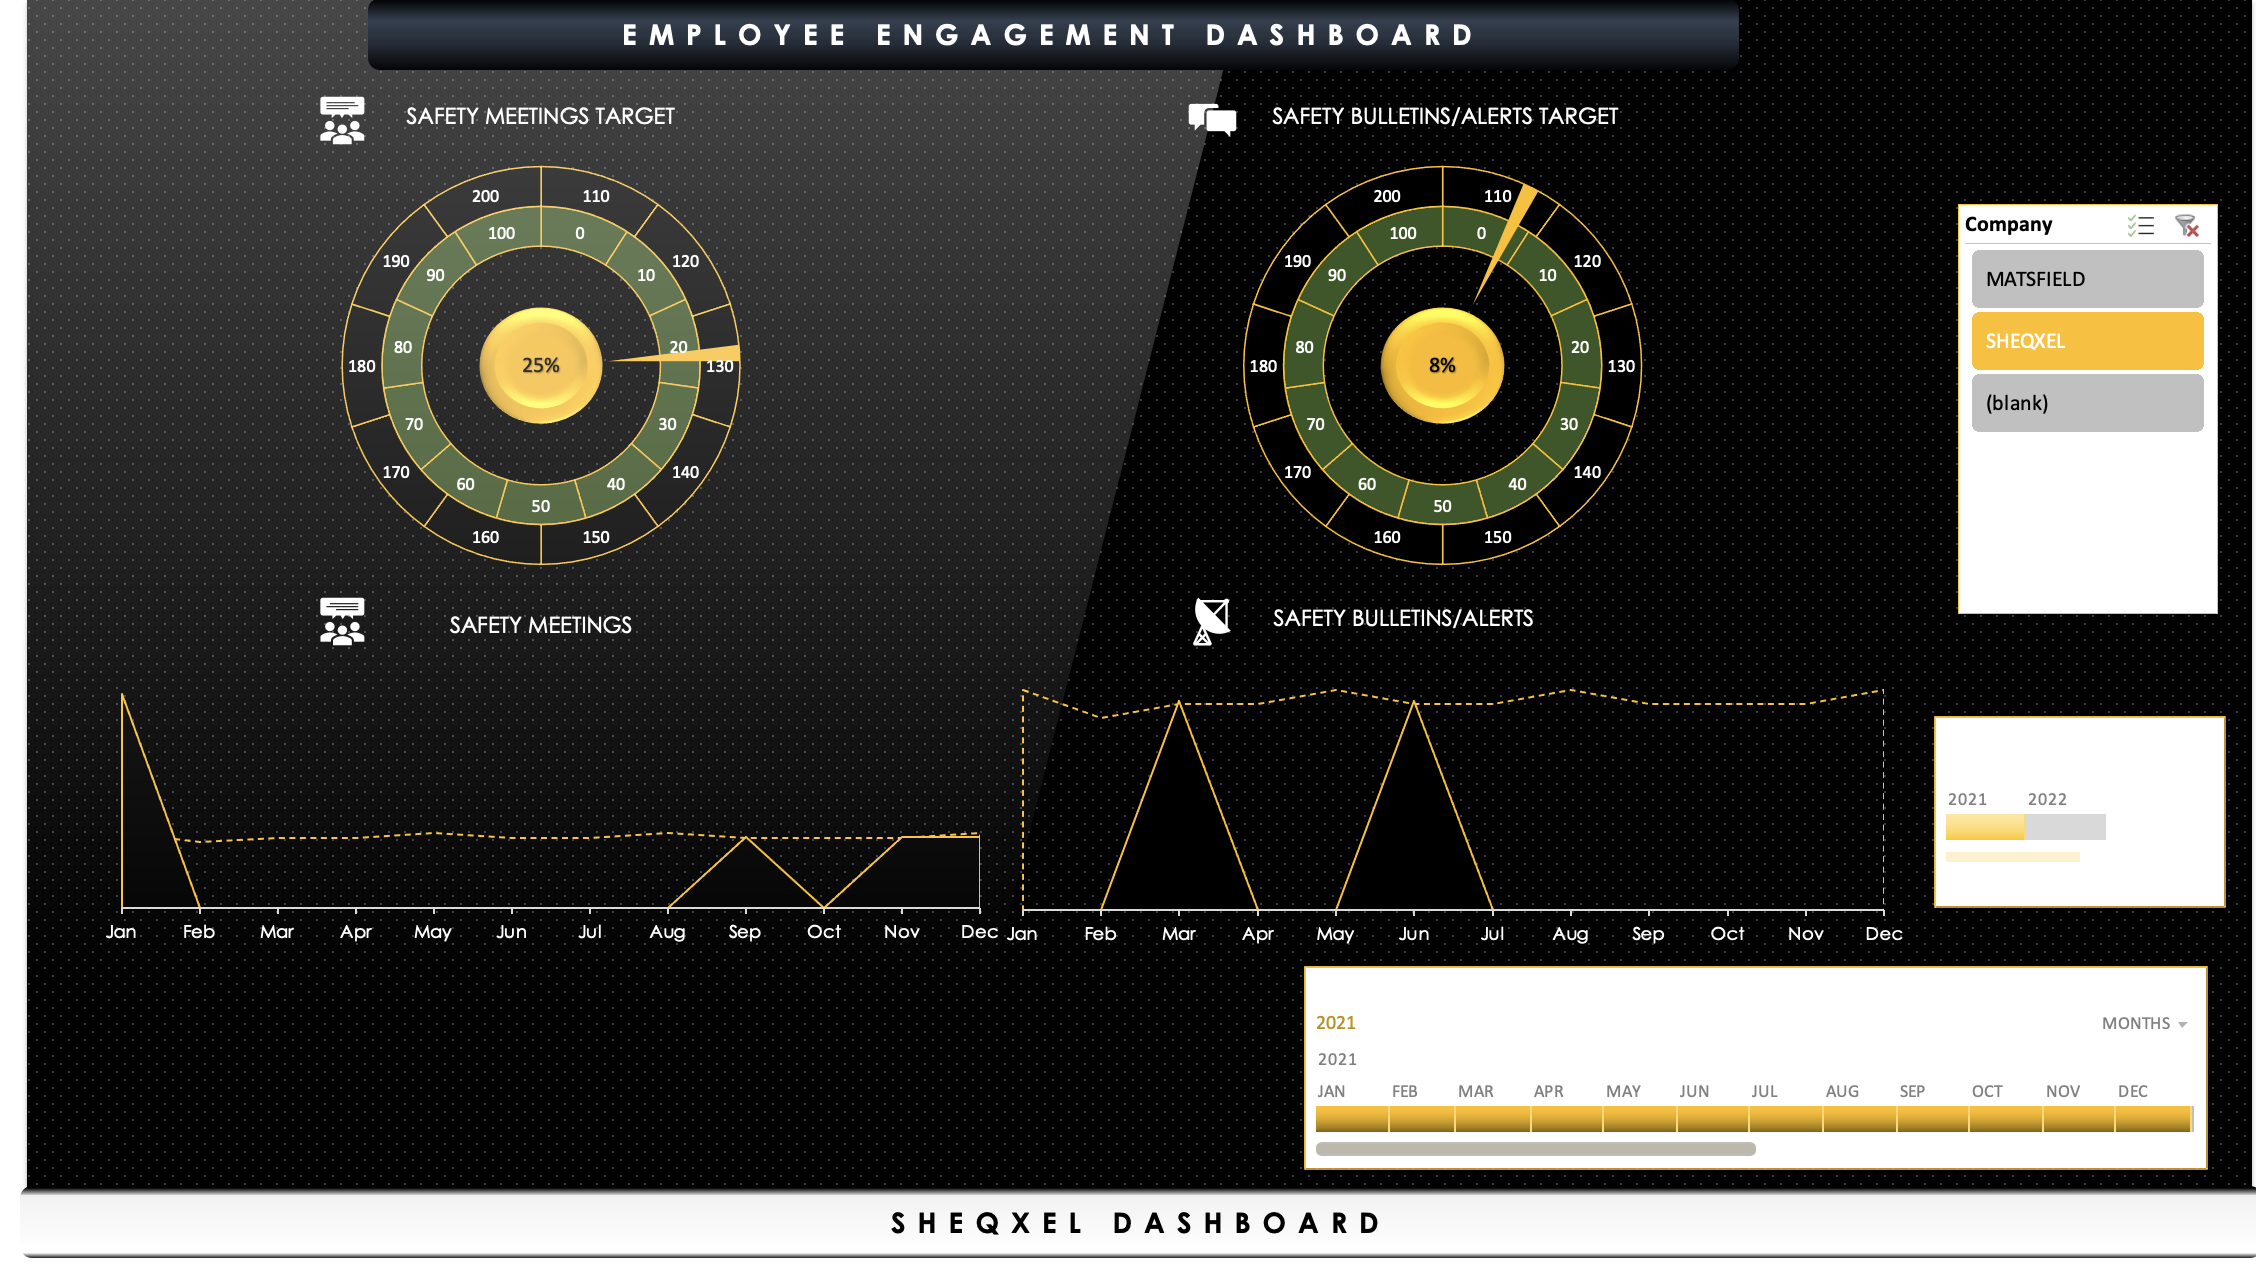
Employee Engagement (EE) Dashboard
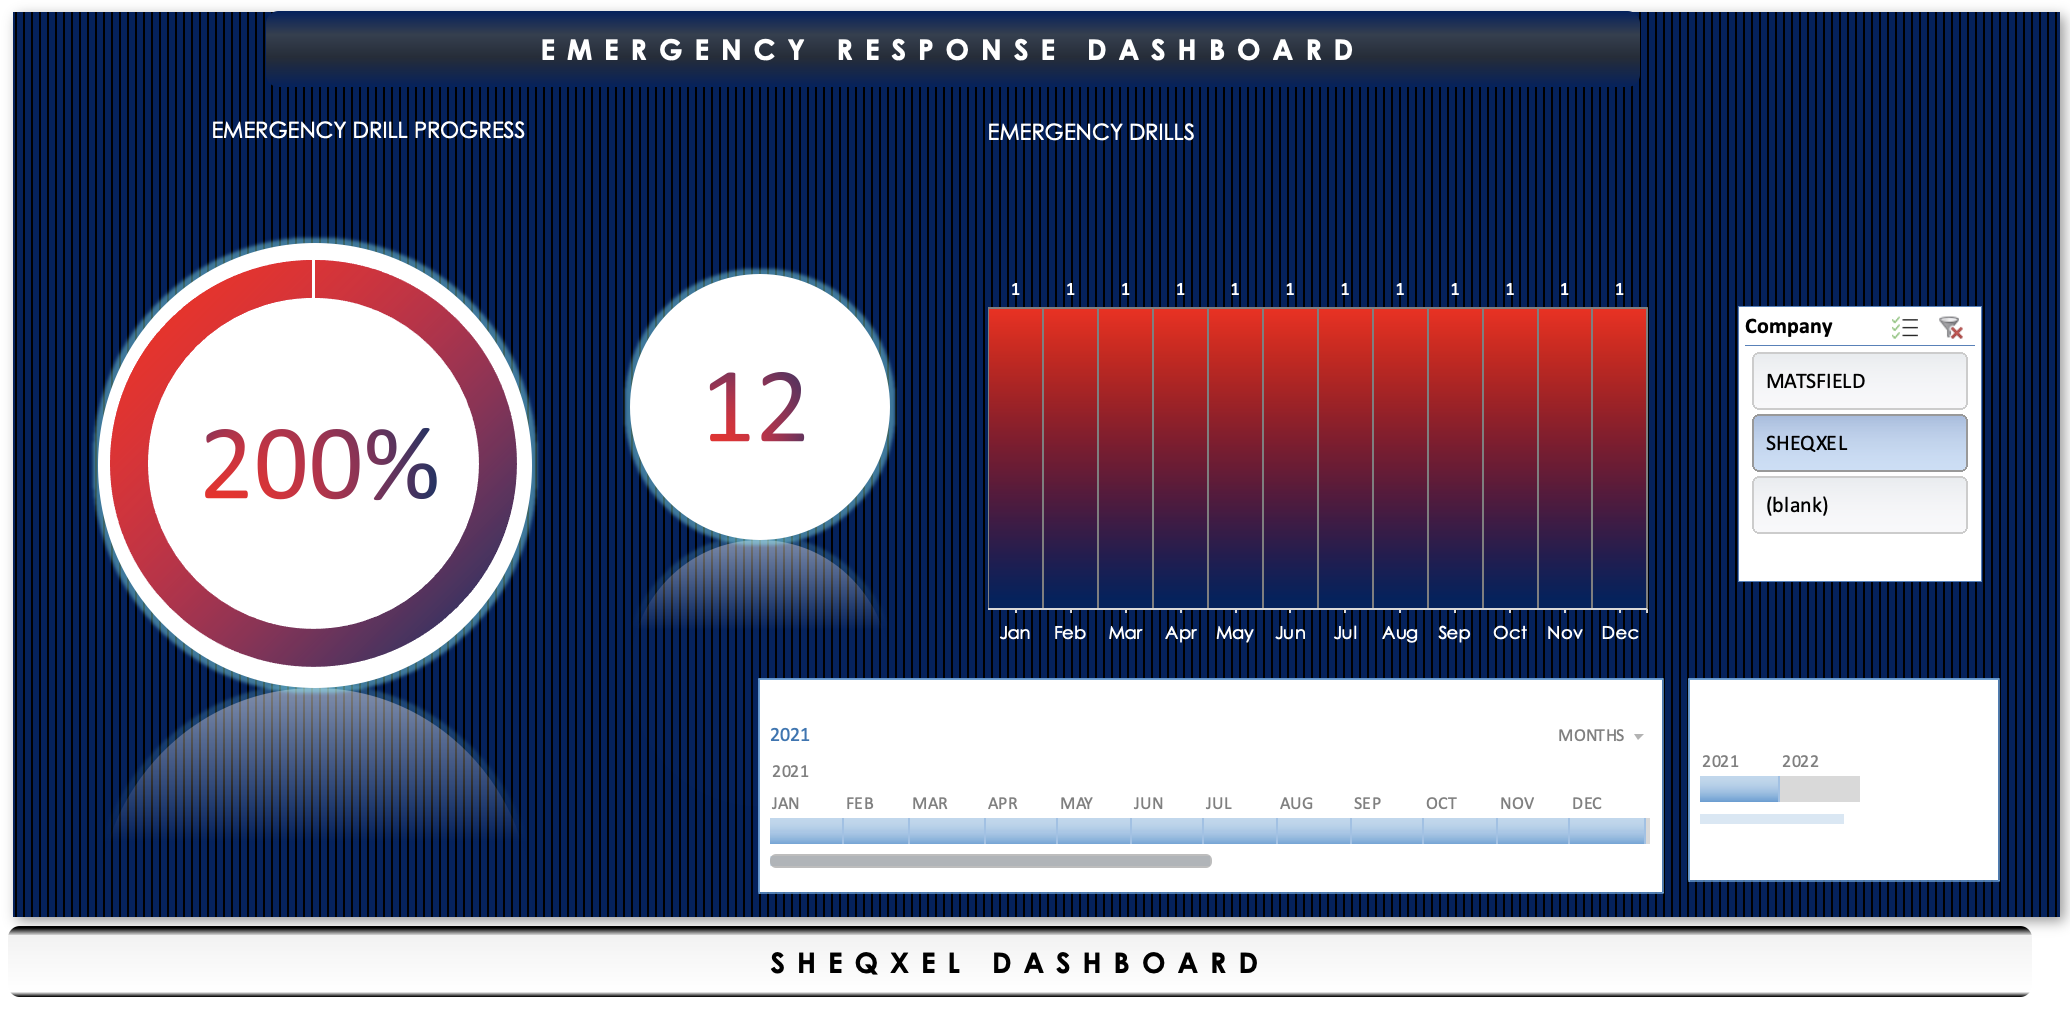
Emergency Response (ER) Dashboard
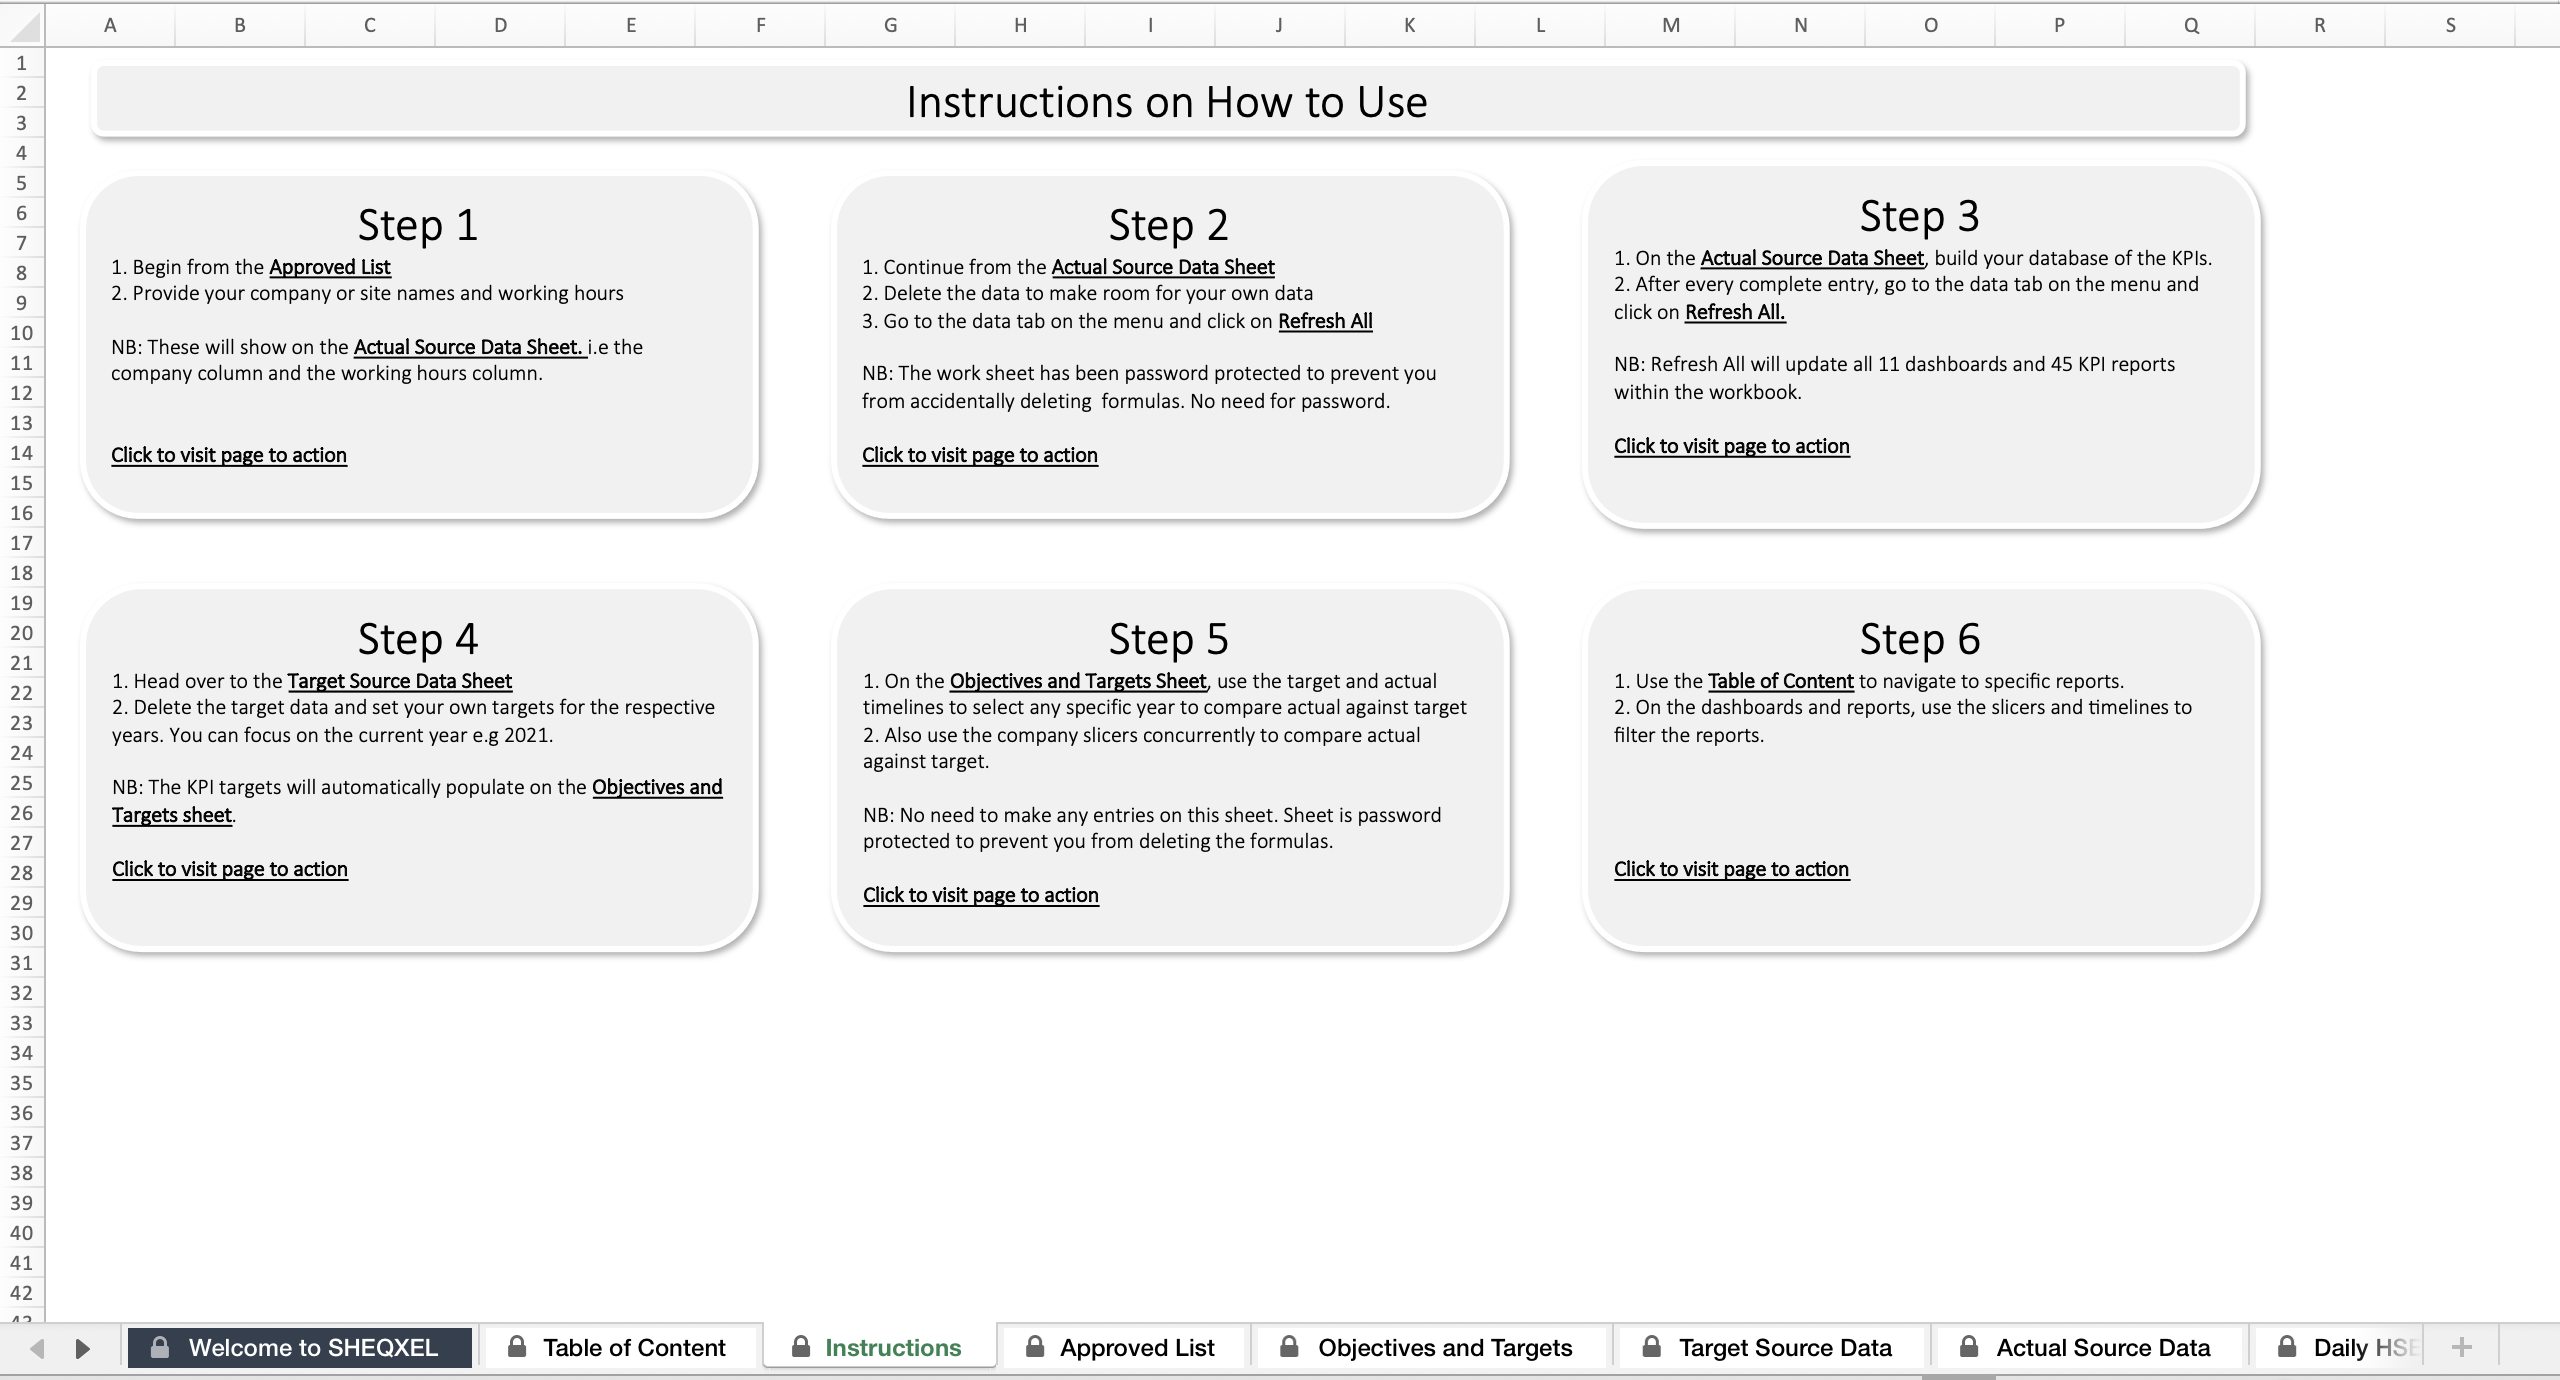
Functionality:
Simply click “Refresh All” on the Menu bar to automatically update all dashboards and reports
Control all dashboards and 45 reports via any slicer or timeline in the workbook
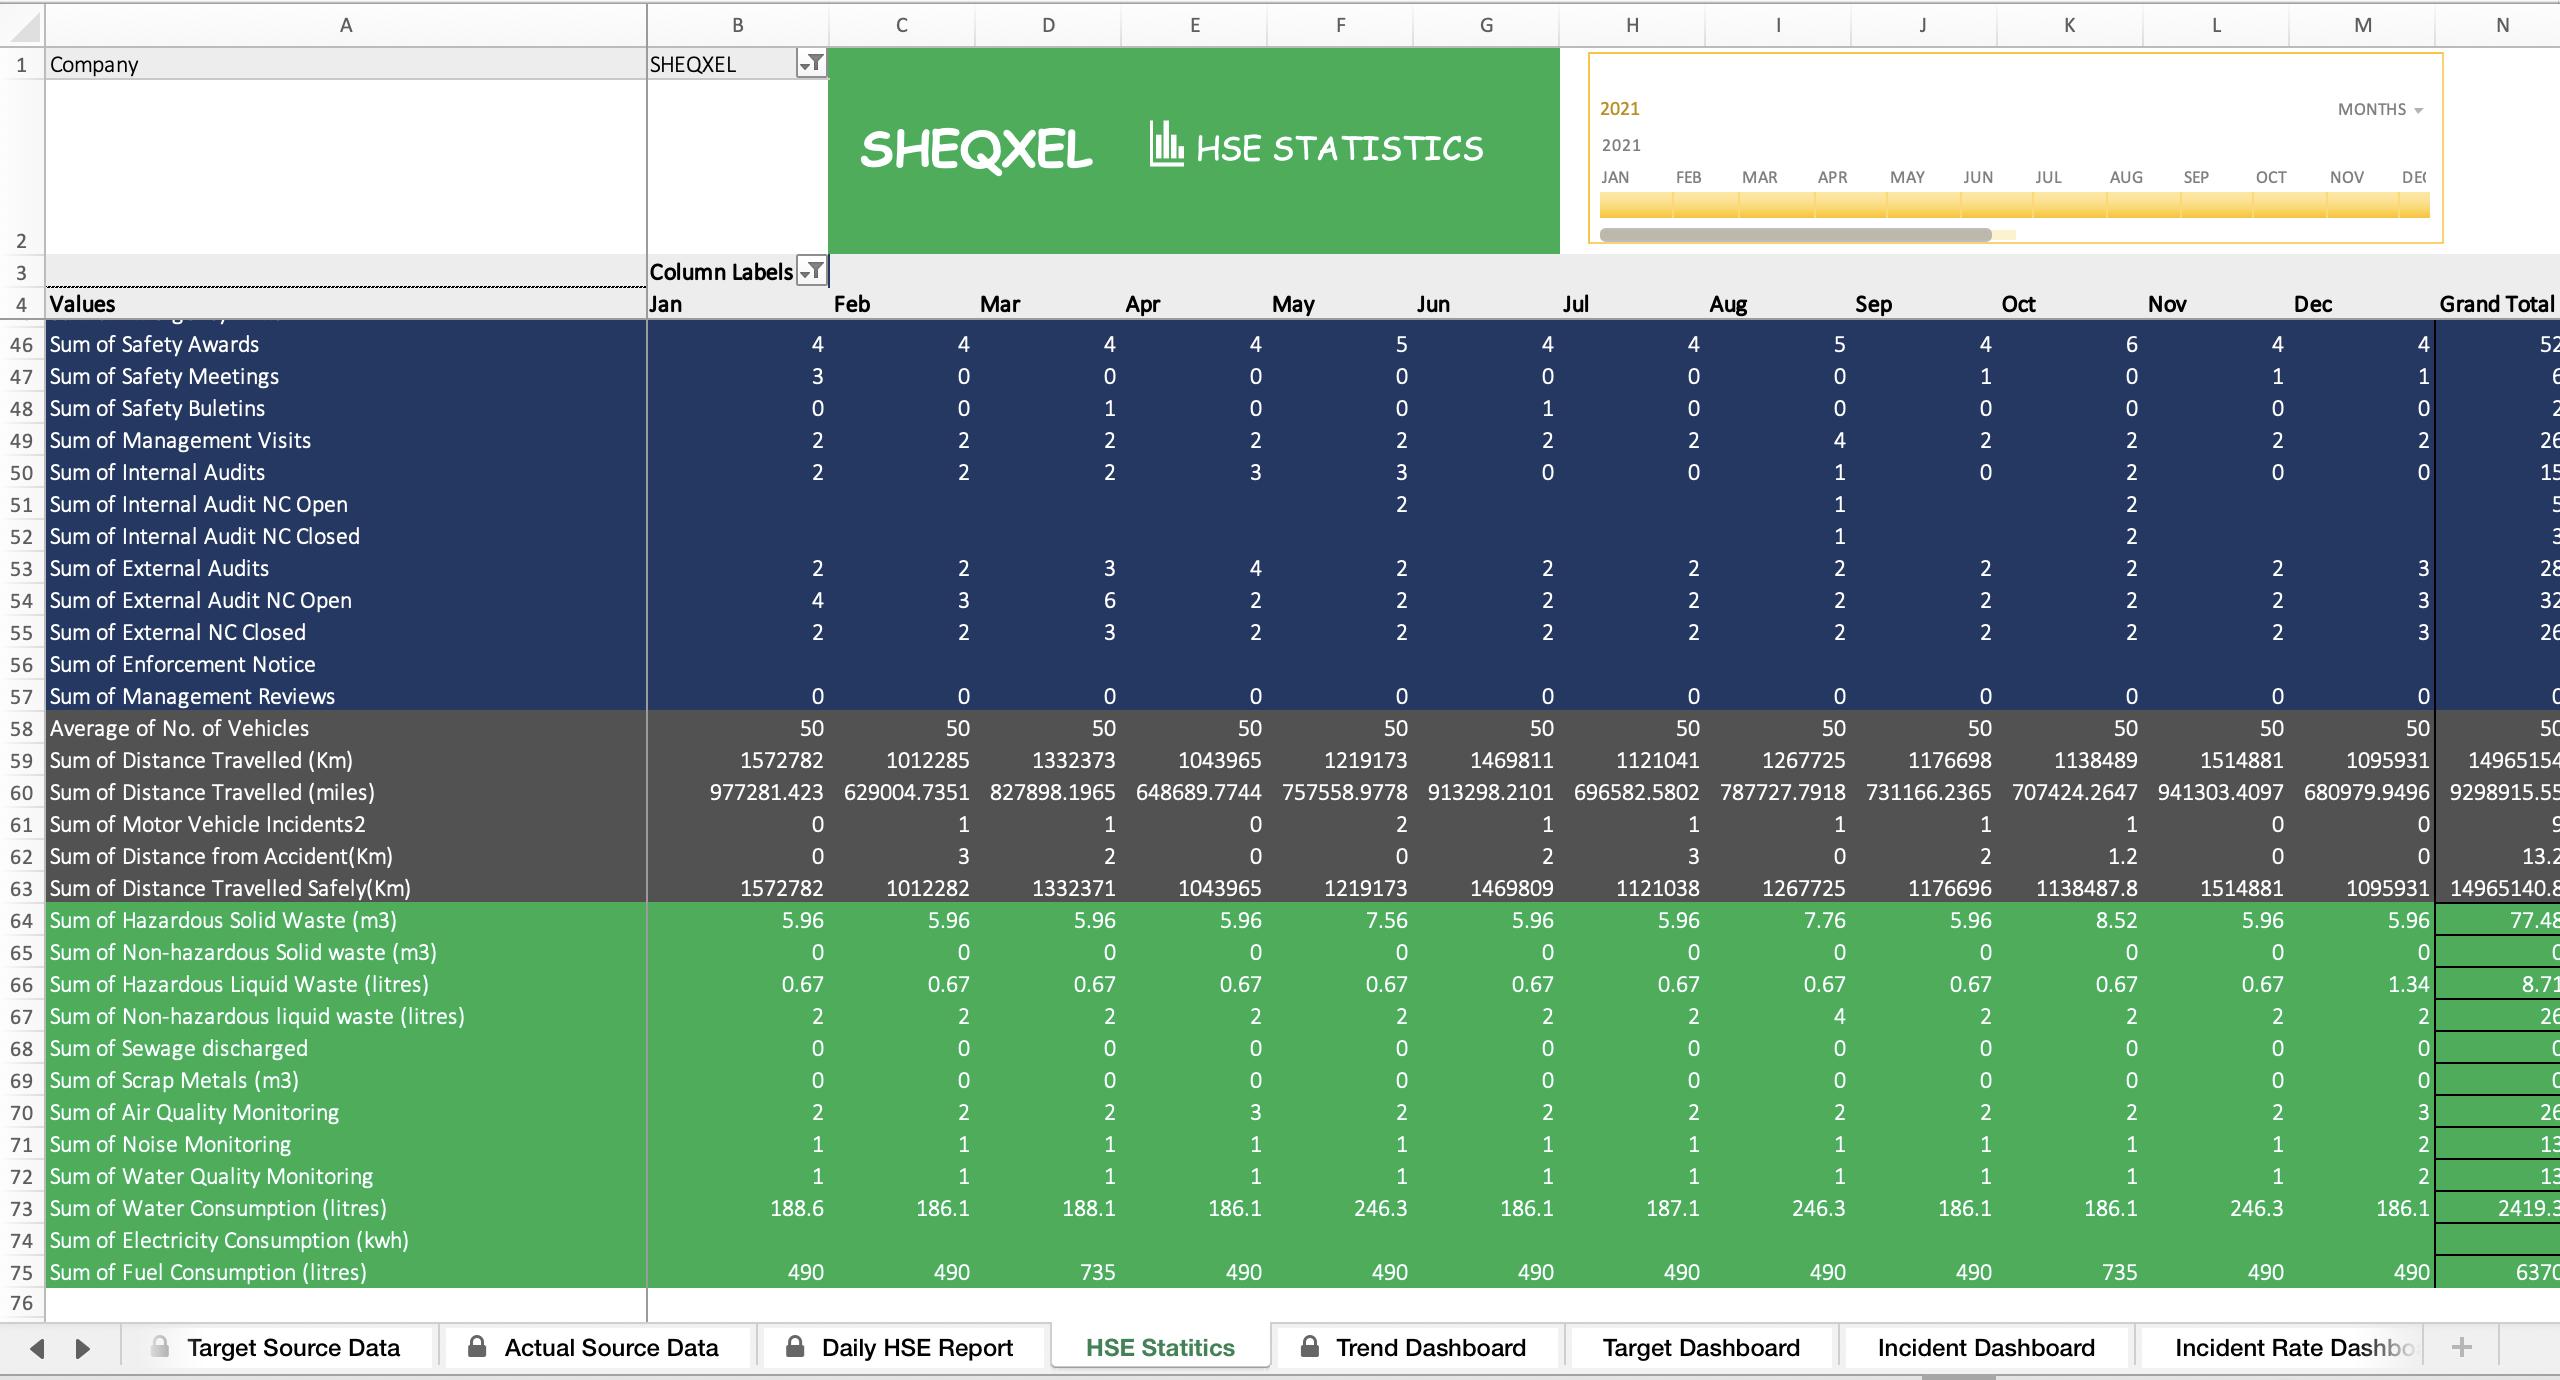
Automatically compiles monthly statistics of all KPIs into a review table
Requires no extra effort from the user — focus remains on building the KPI database
Automatically populates and generates daily reports based on Source Data Sheet inputs
Eliminates repeated manual data entry for daily reporting
Supports database growth while maintaining consistent reporting
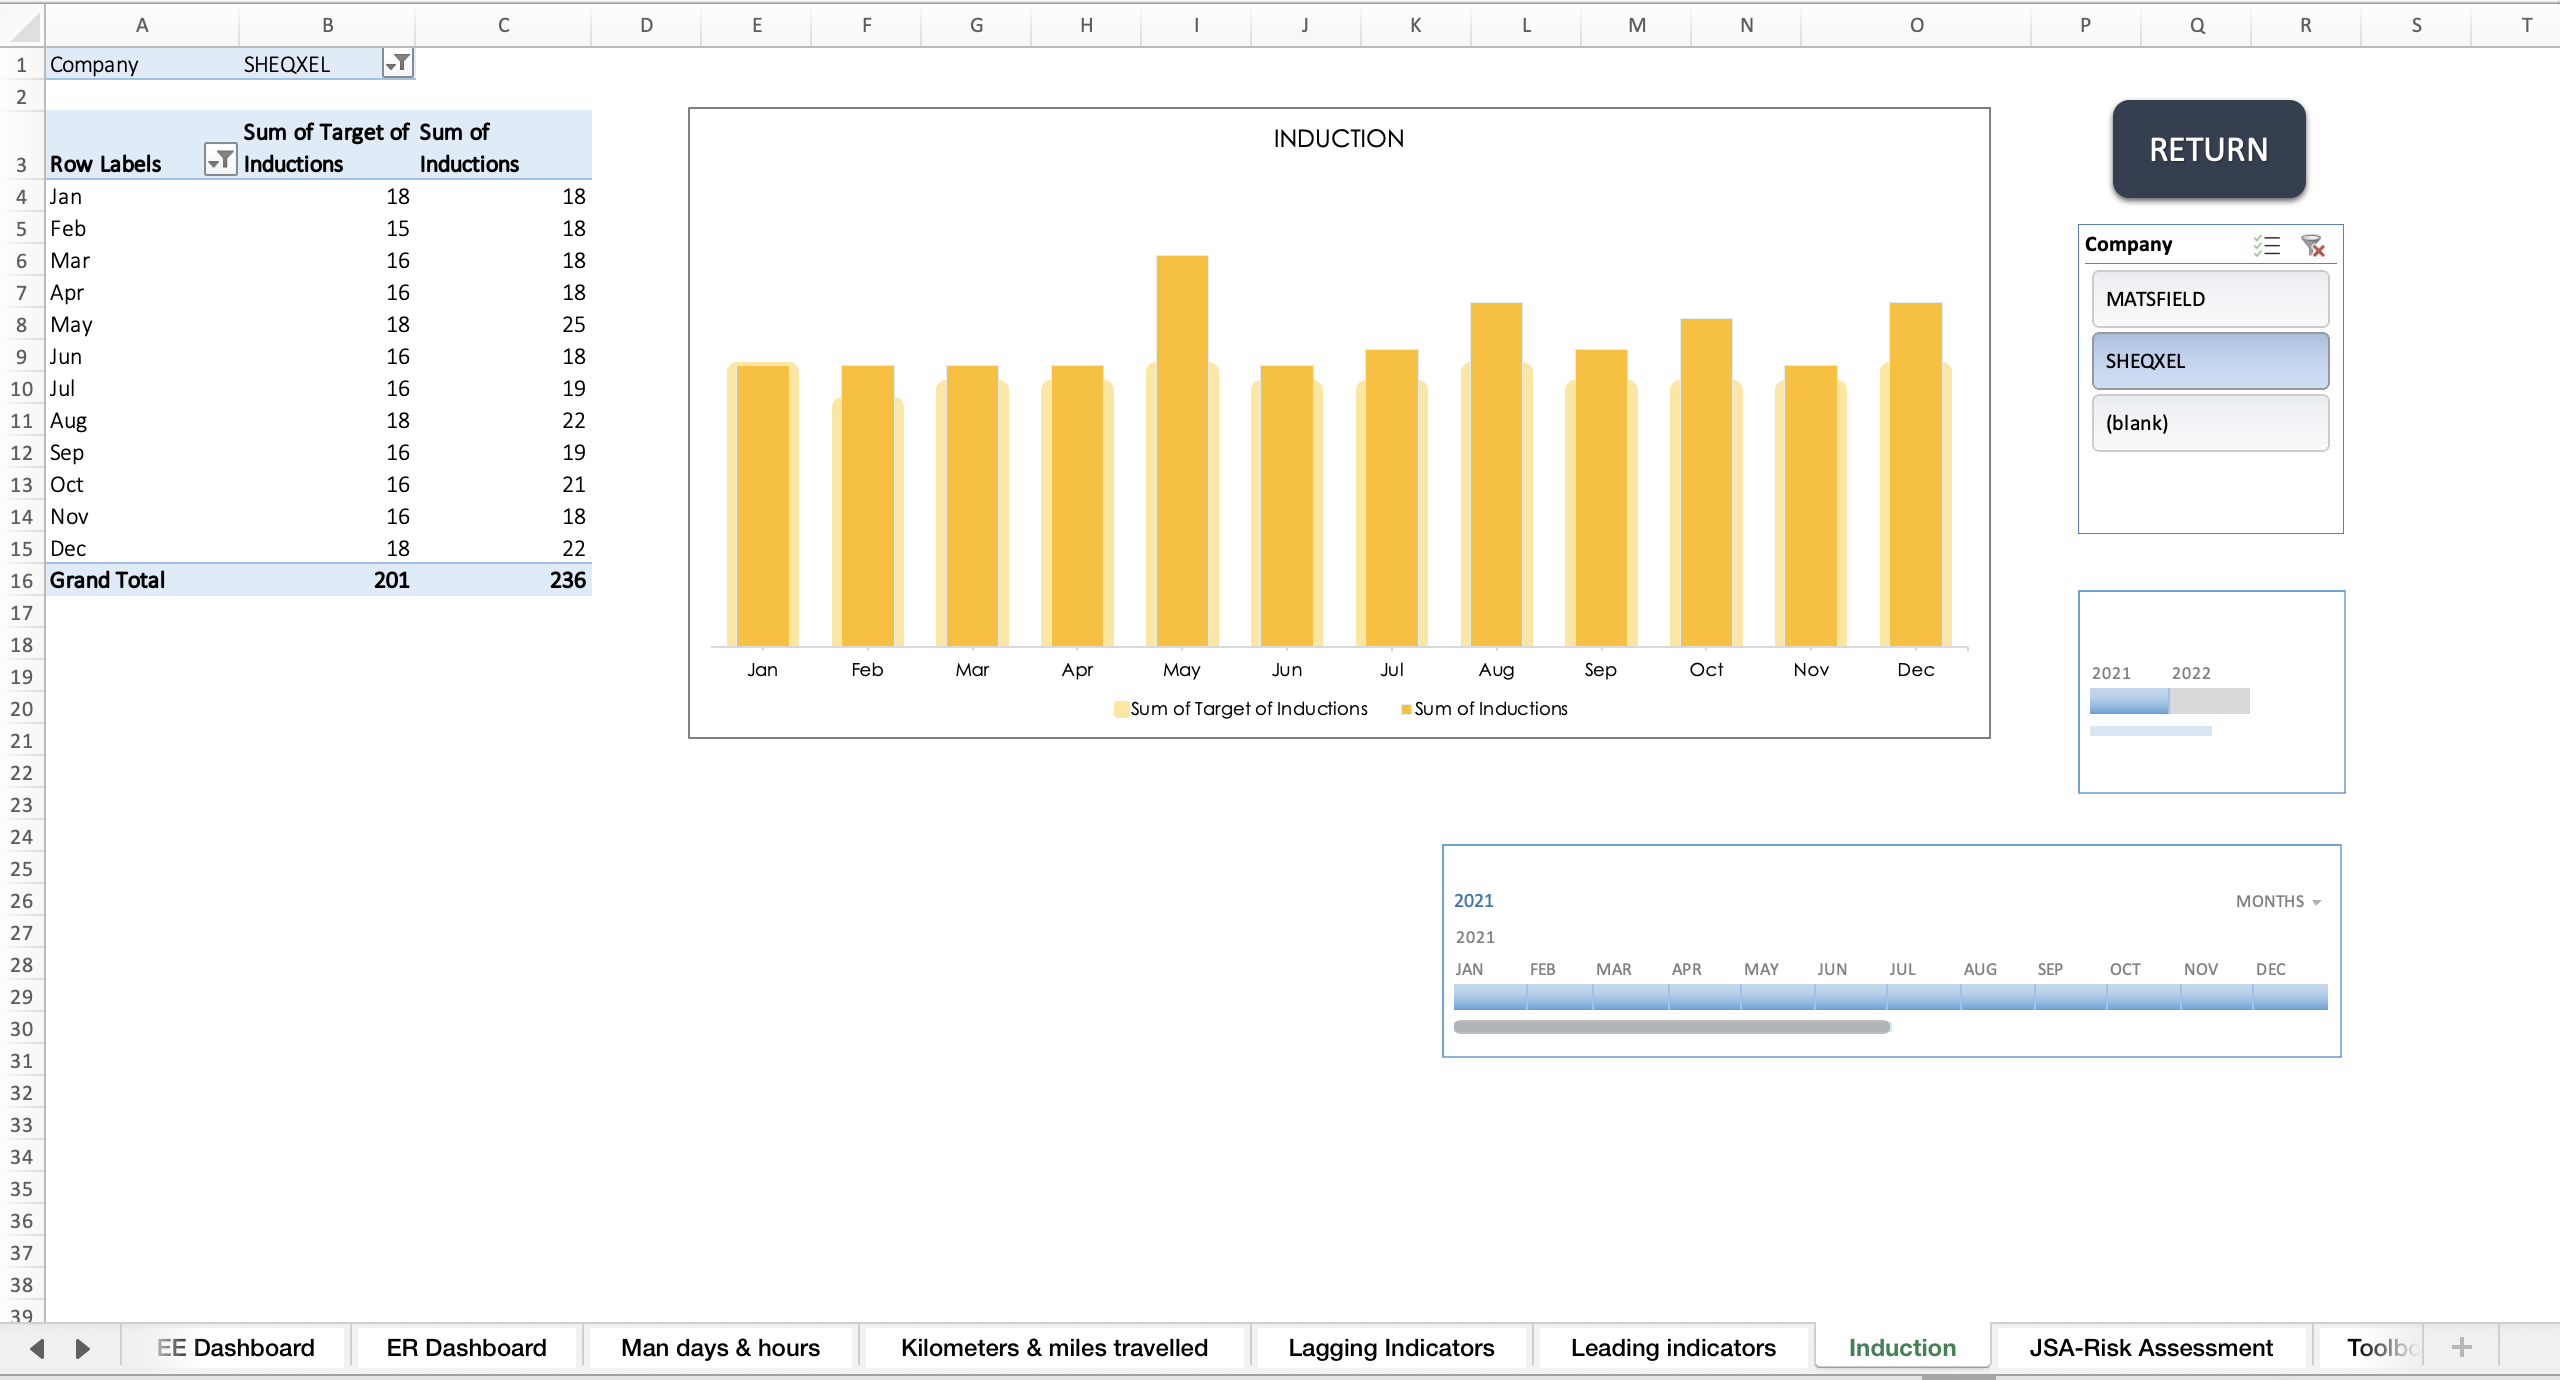
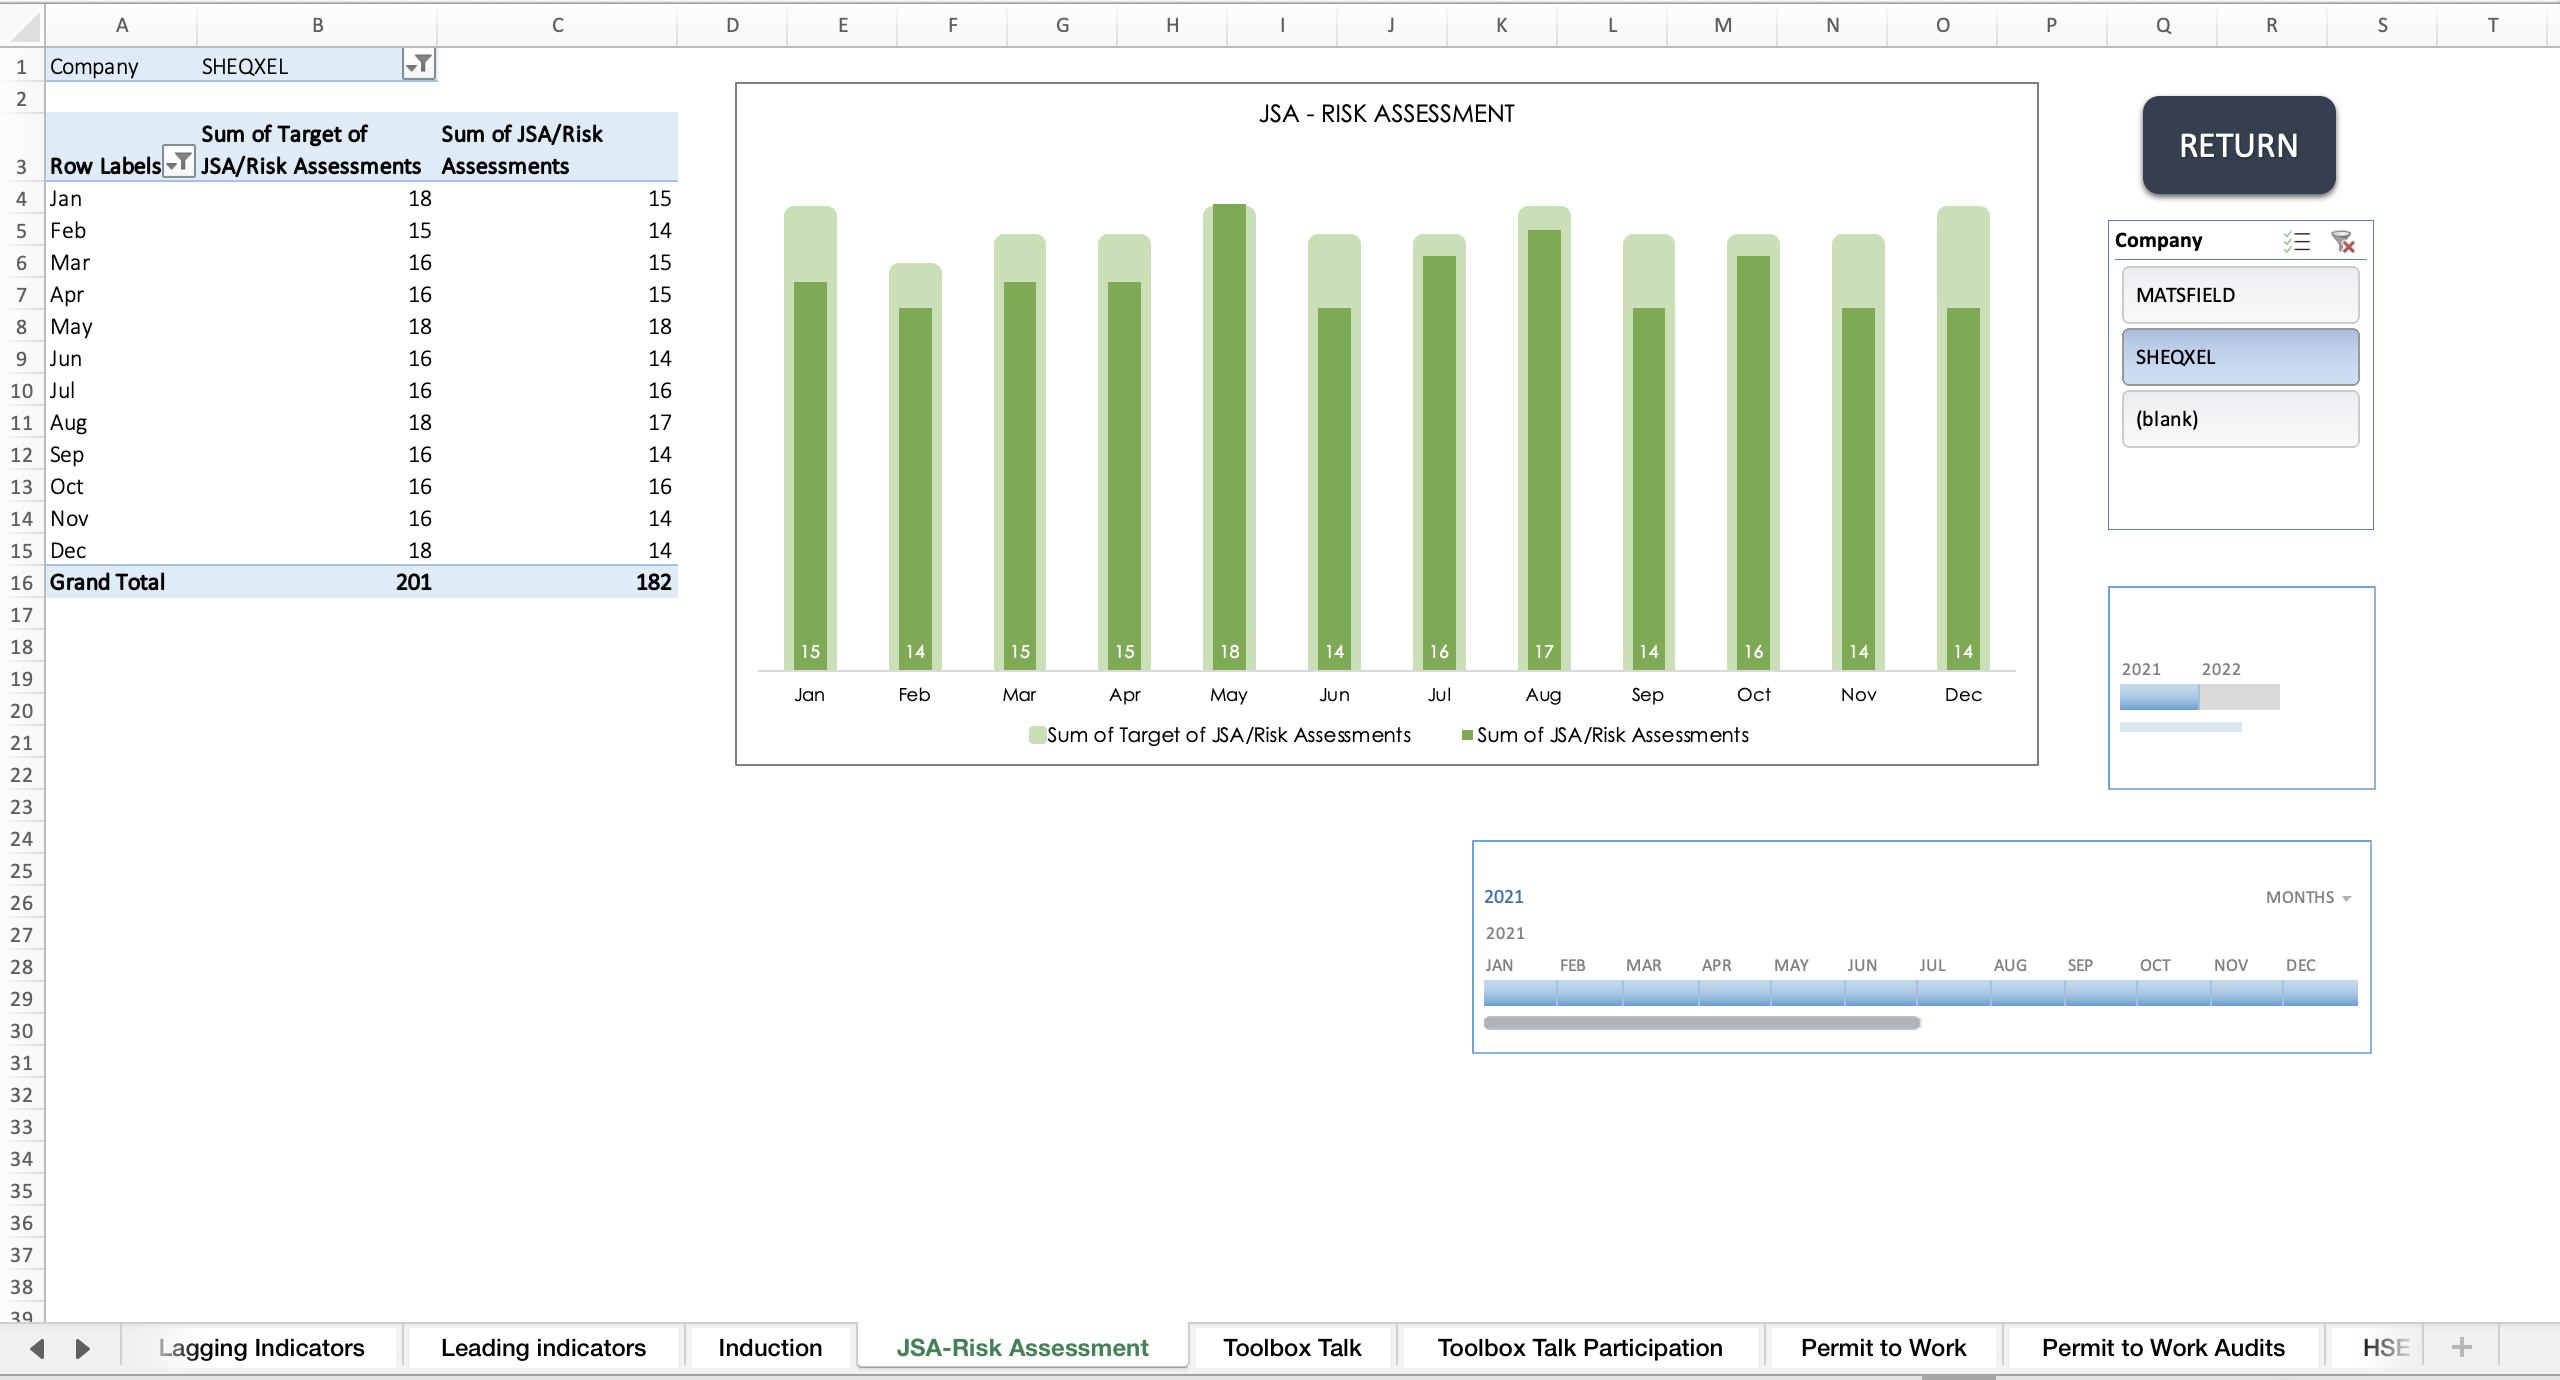
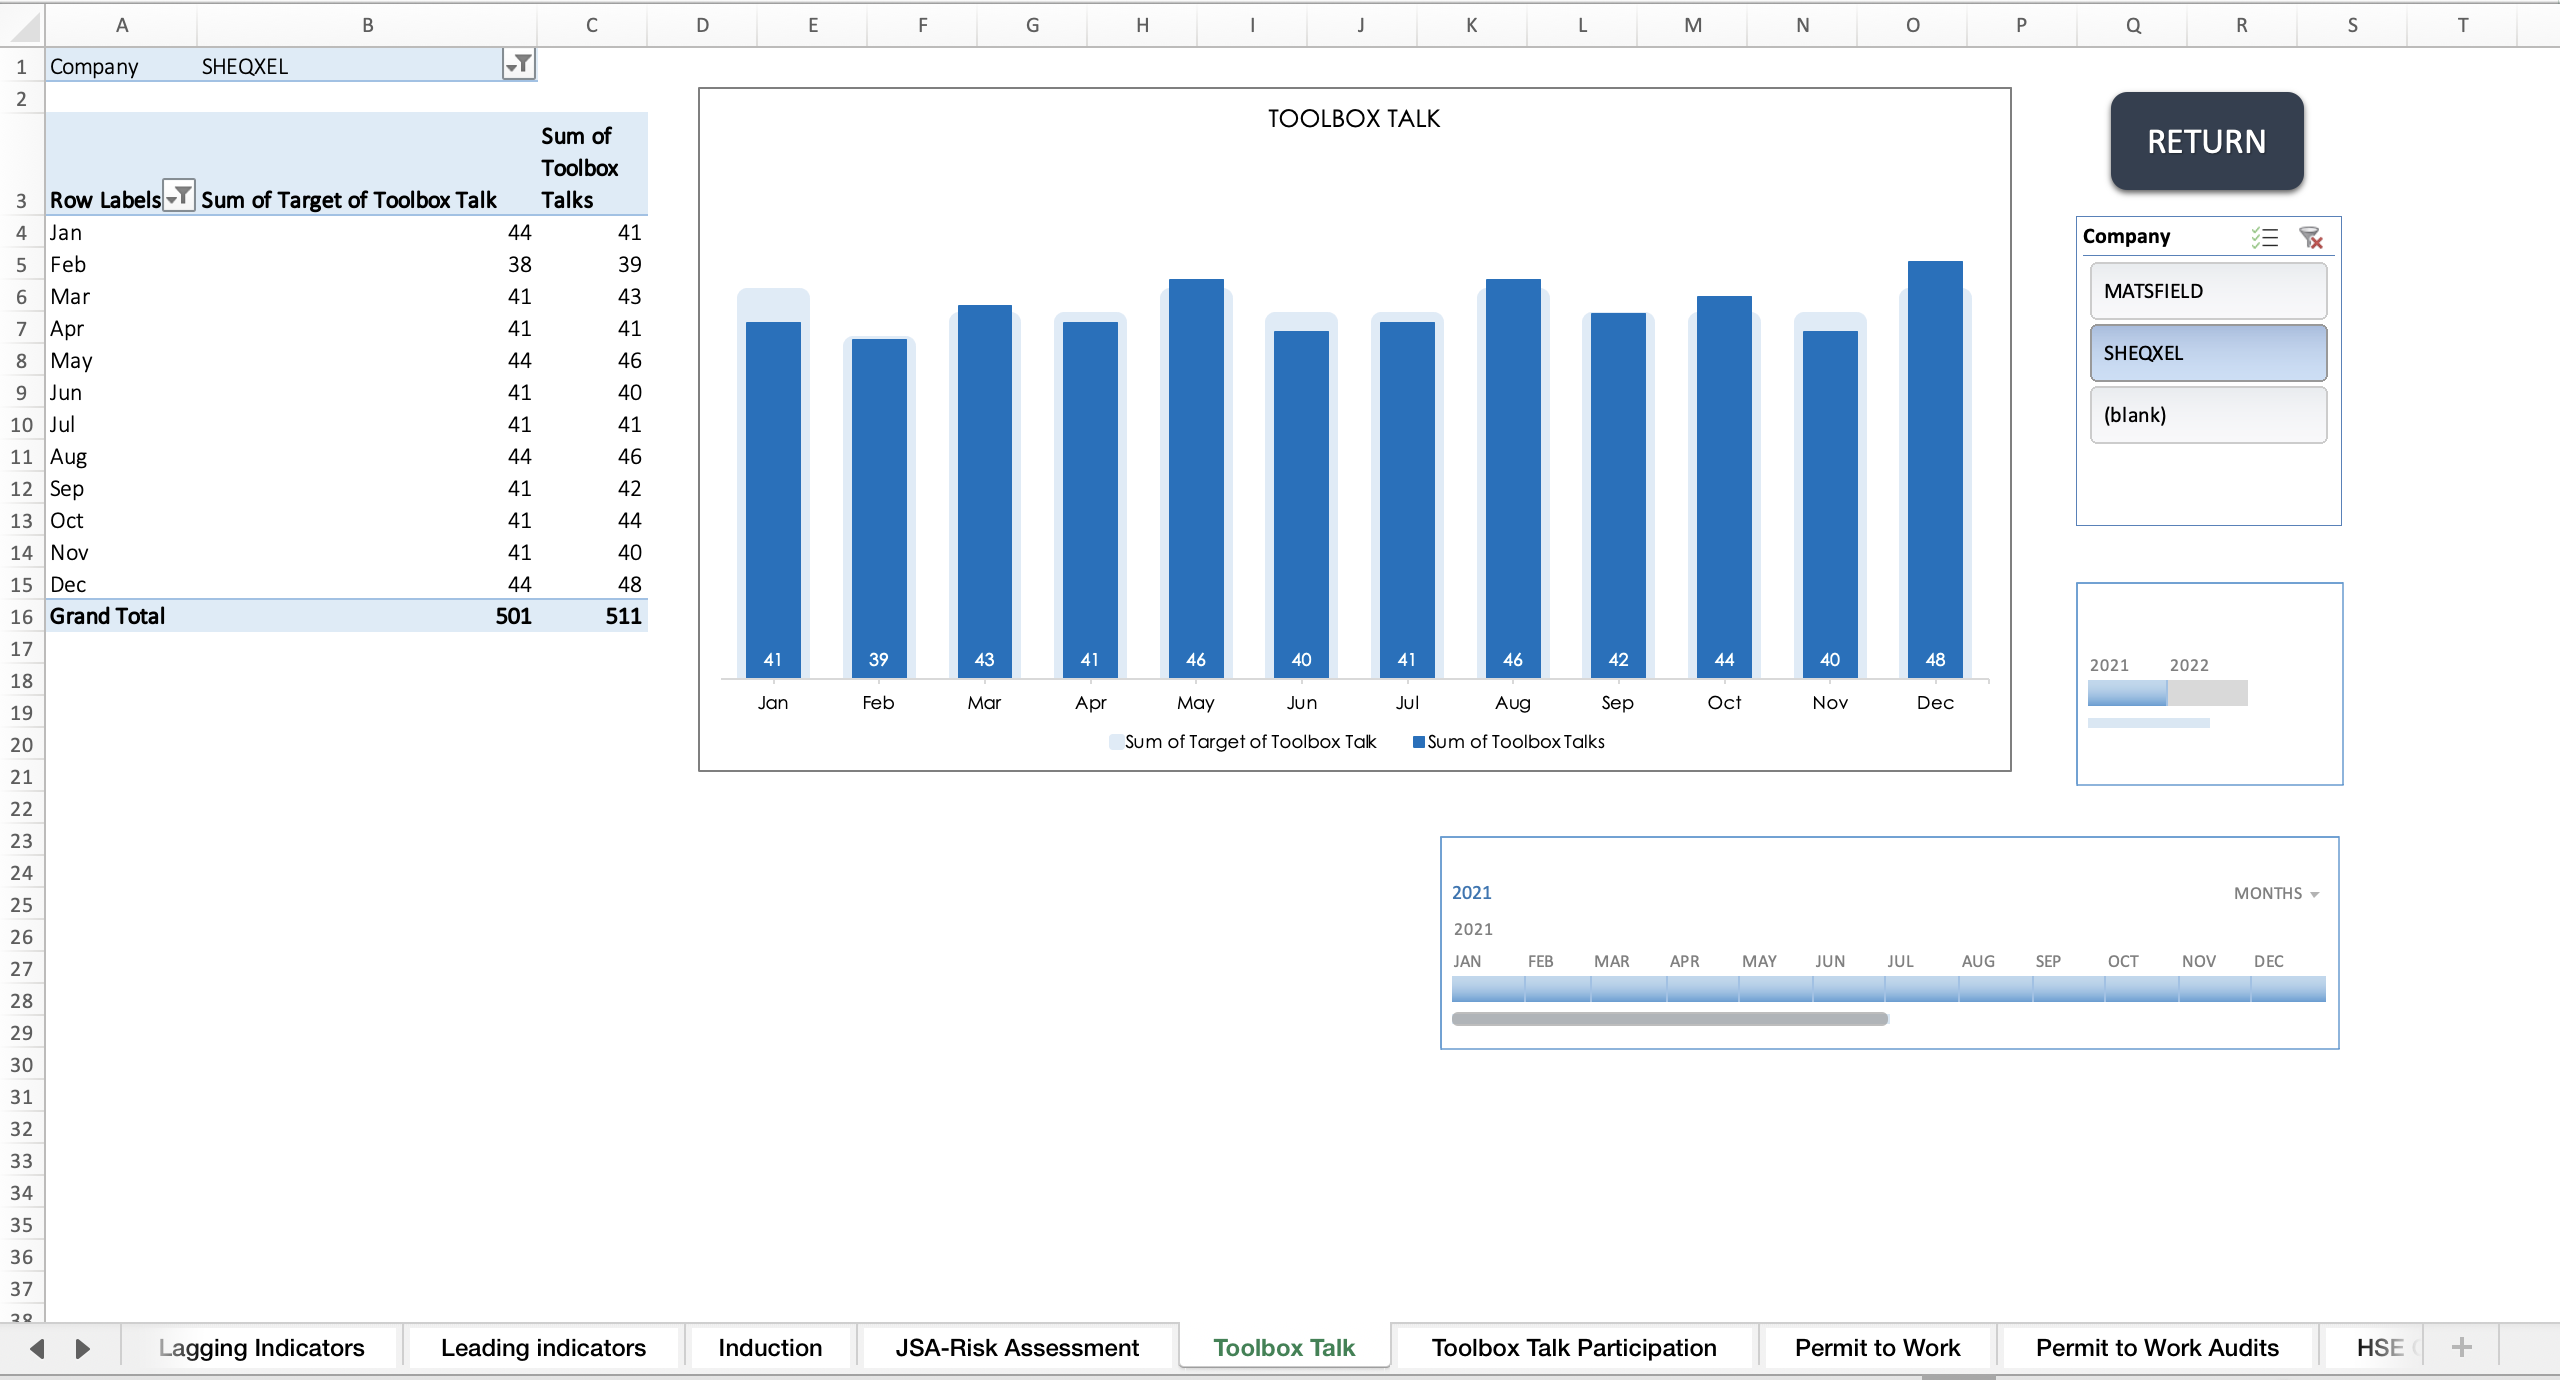
Allows users to set custom targets from Source Data Sheet indicators
Timeline selection: monthly, quarterly, semi-annual, or annual
Conditional formatting:
Red = underperformance
Green = good performance
Encourages continual improvement to keep all indicators green and exceed set targets
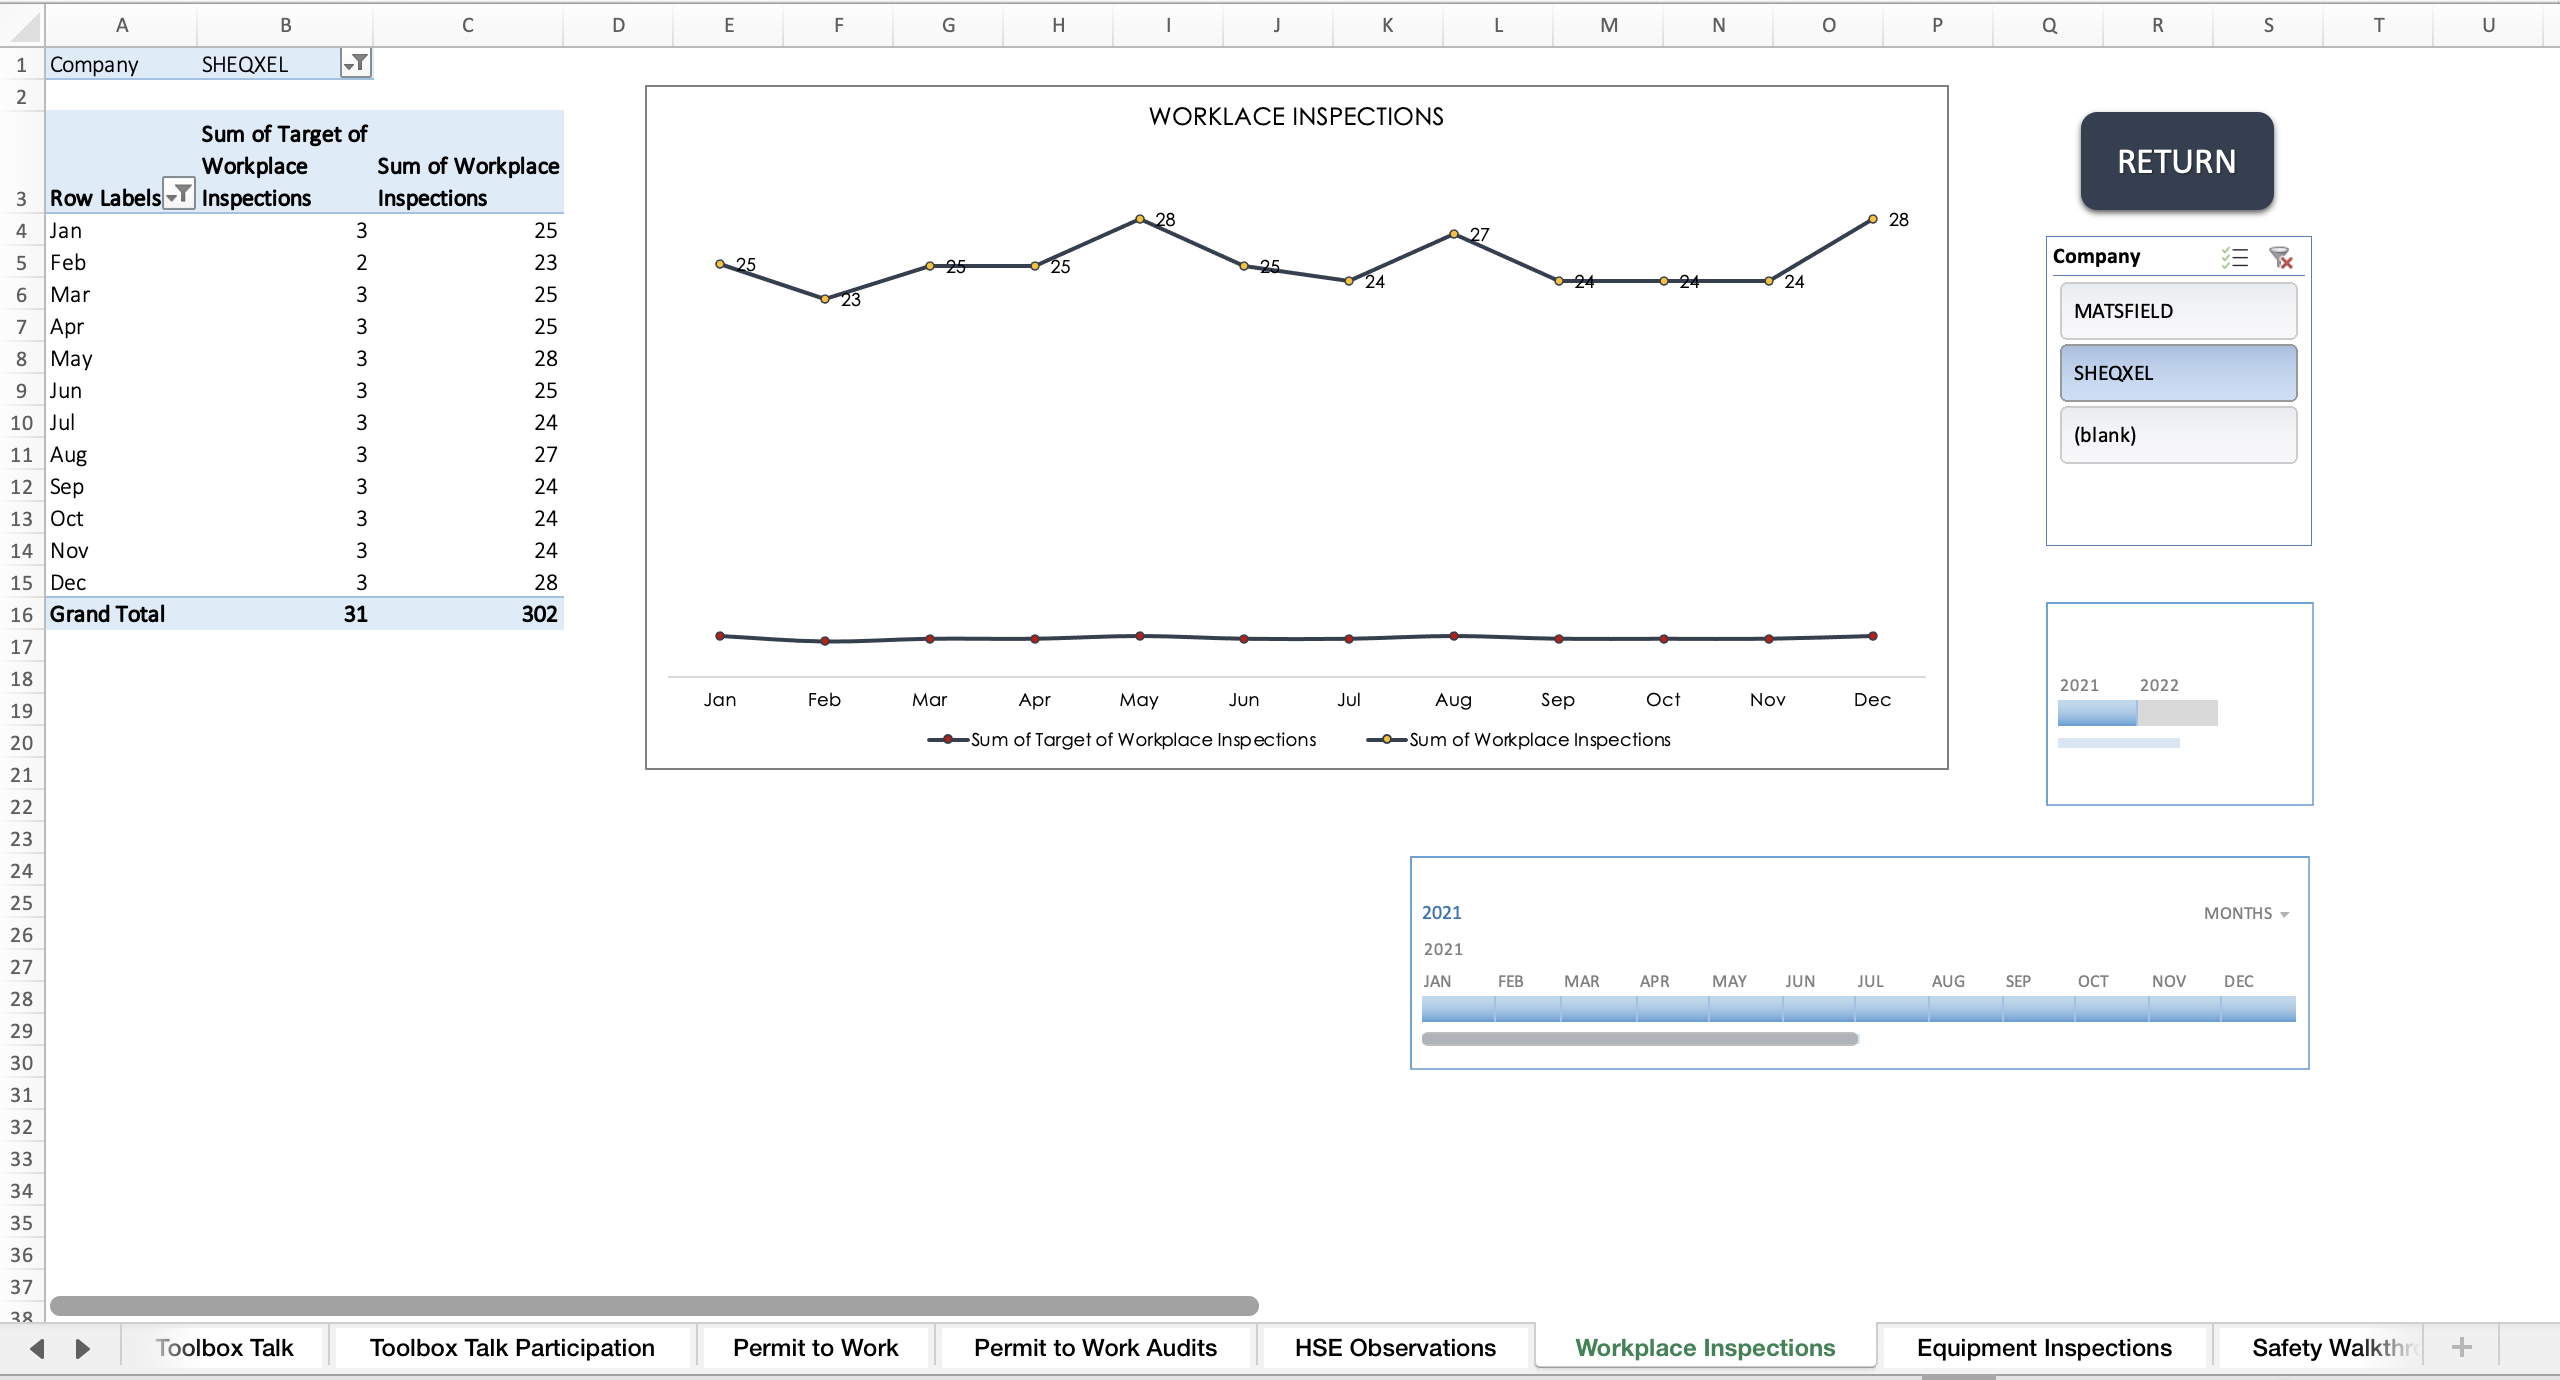
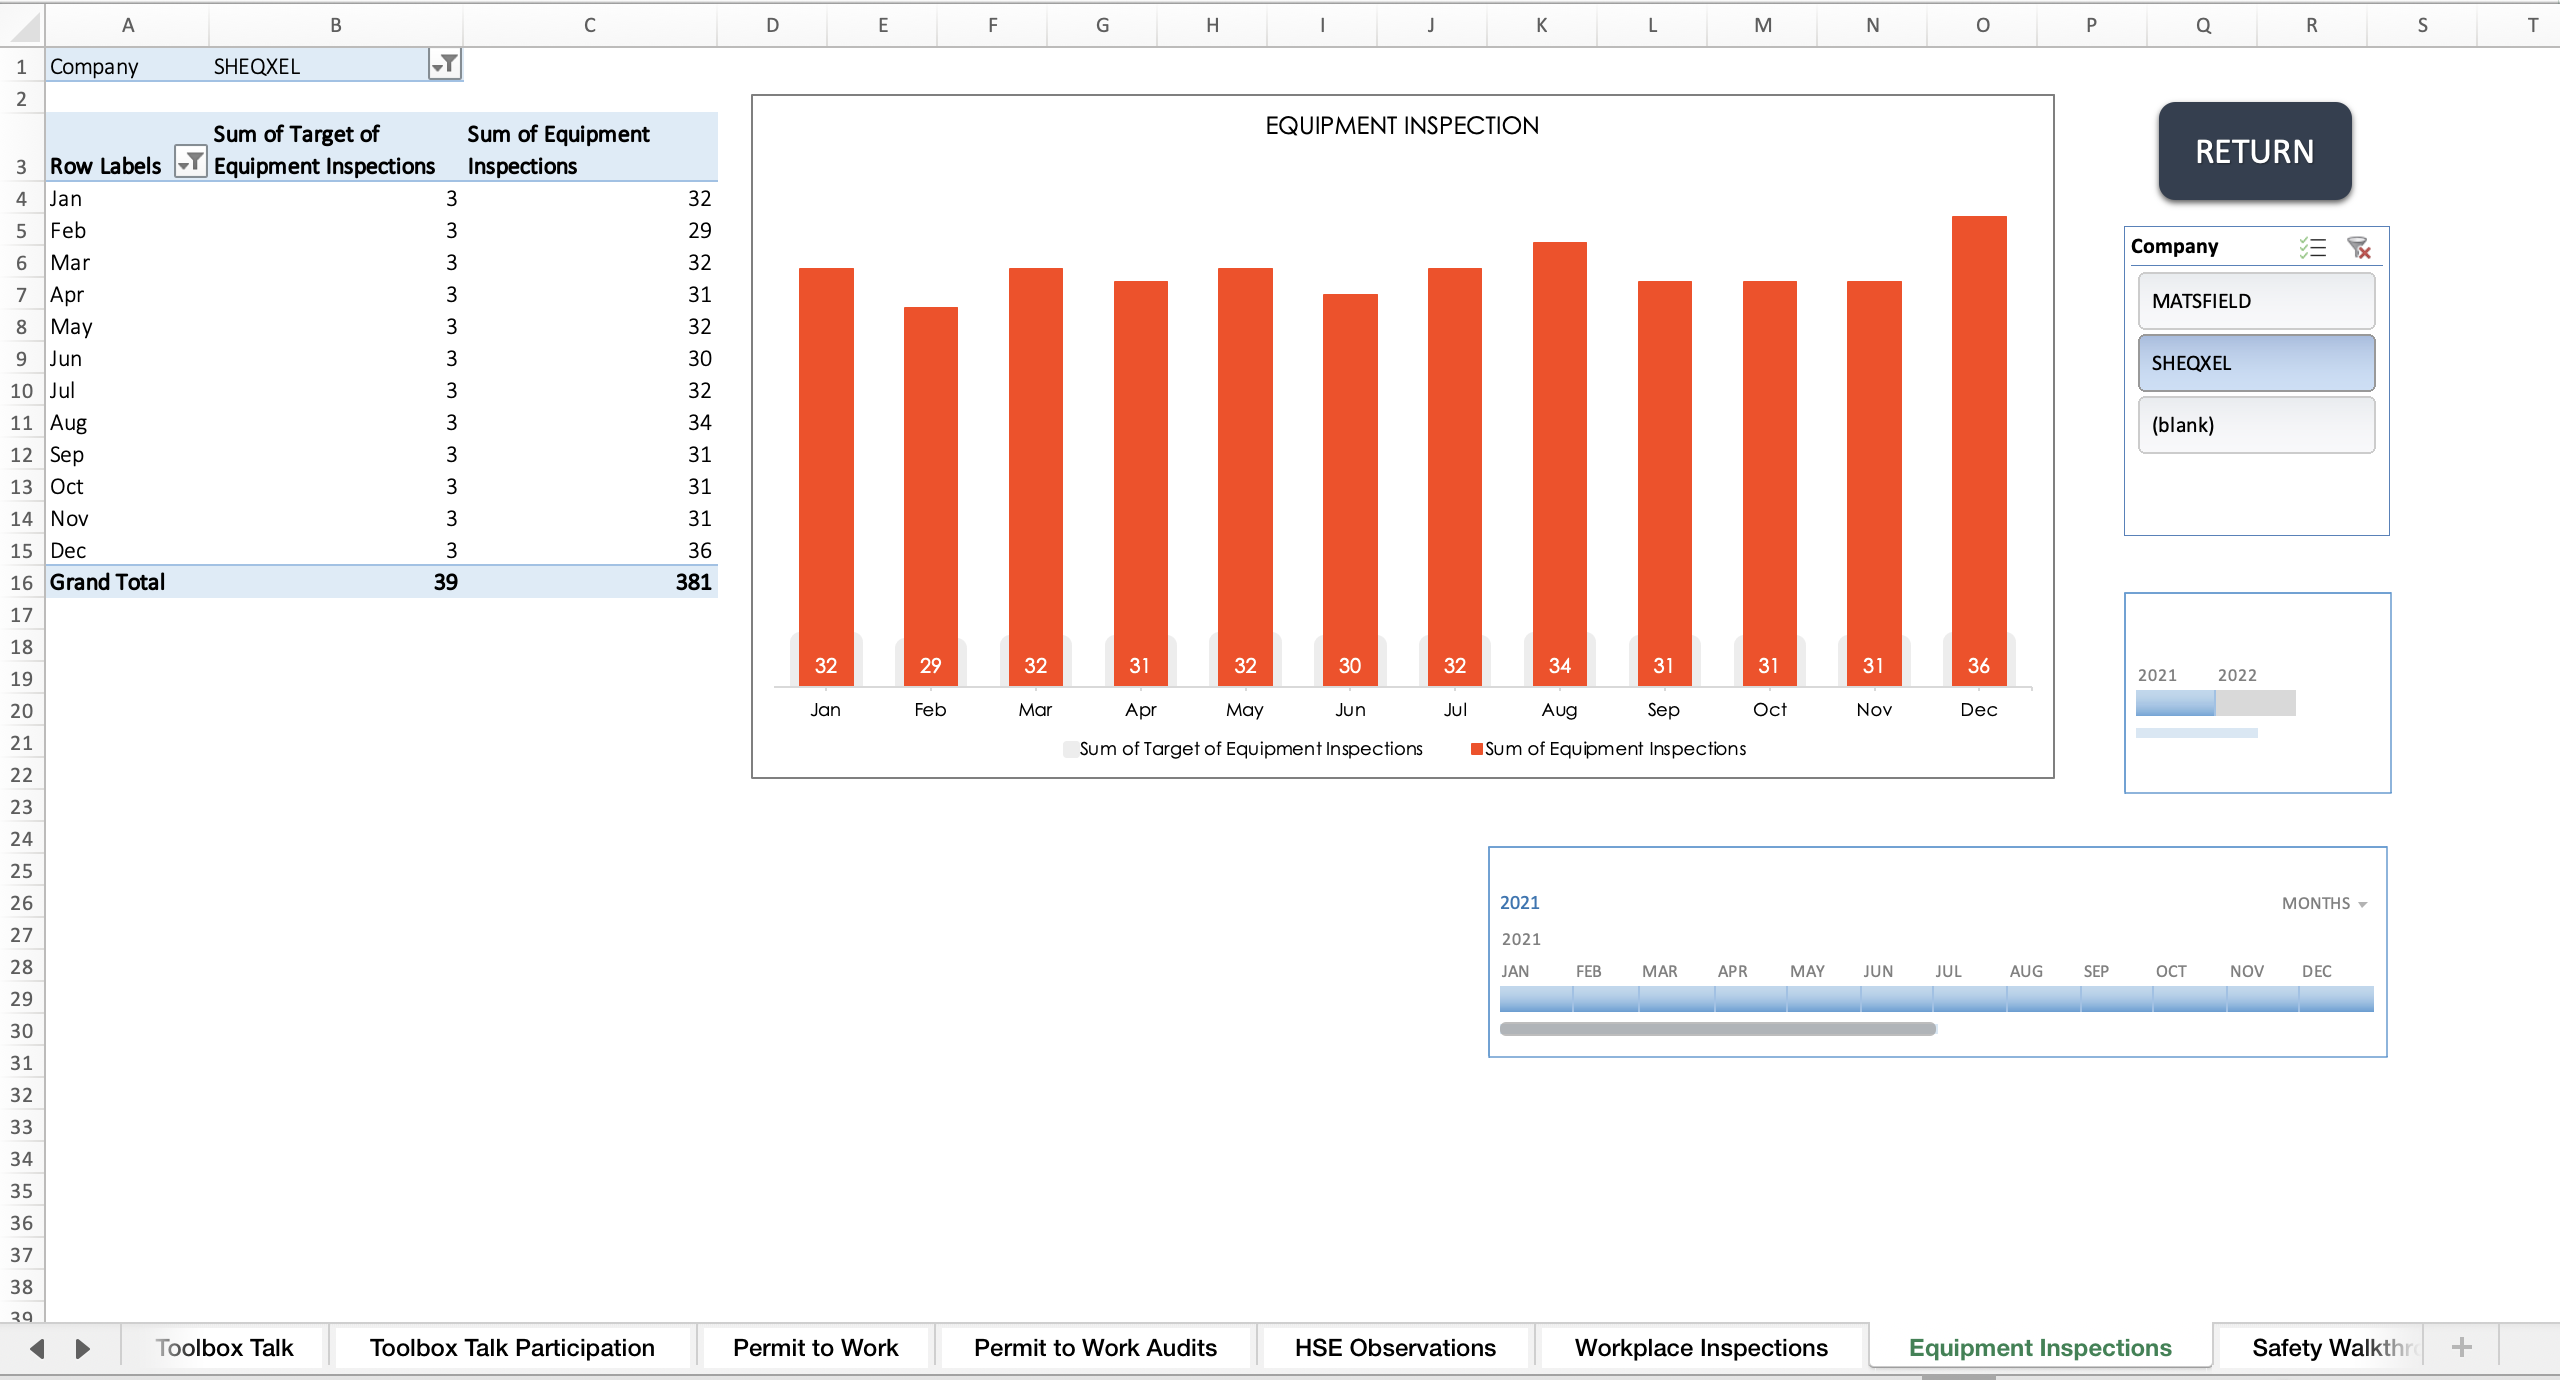
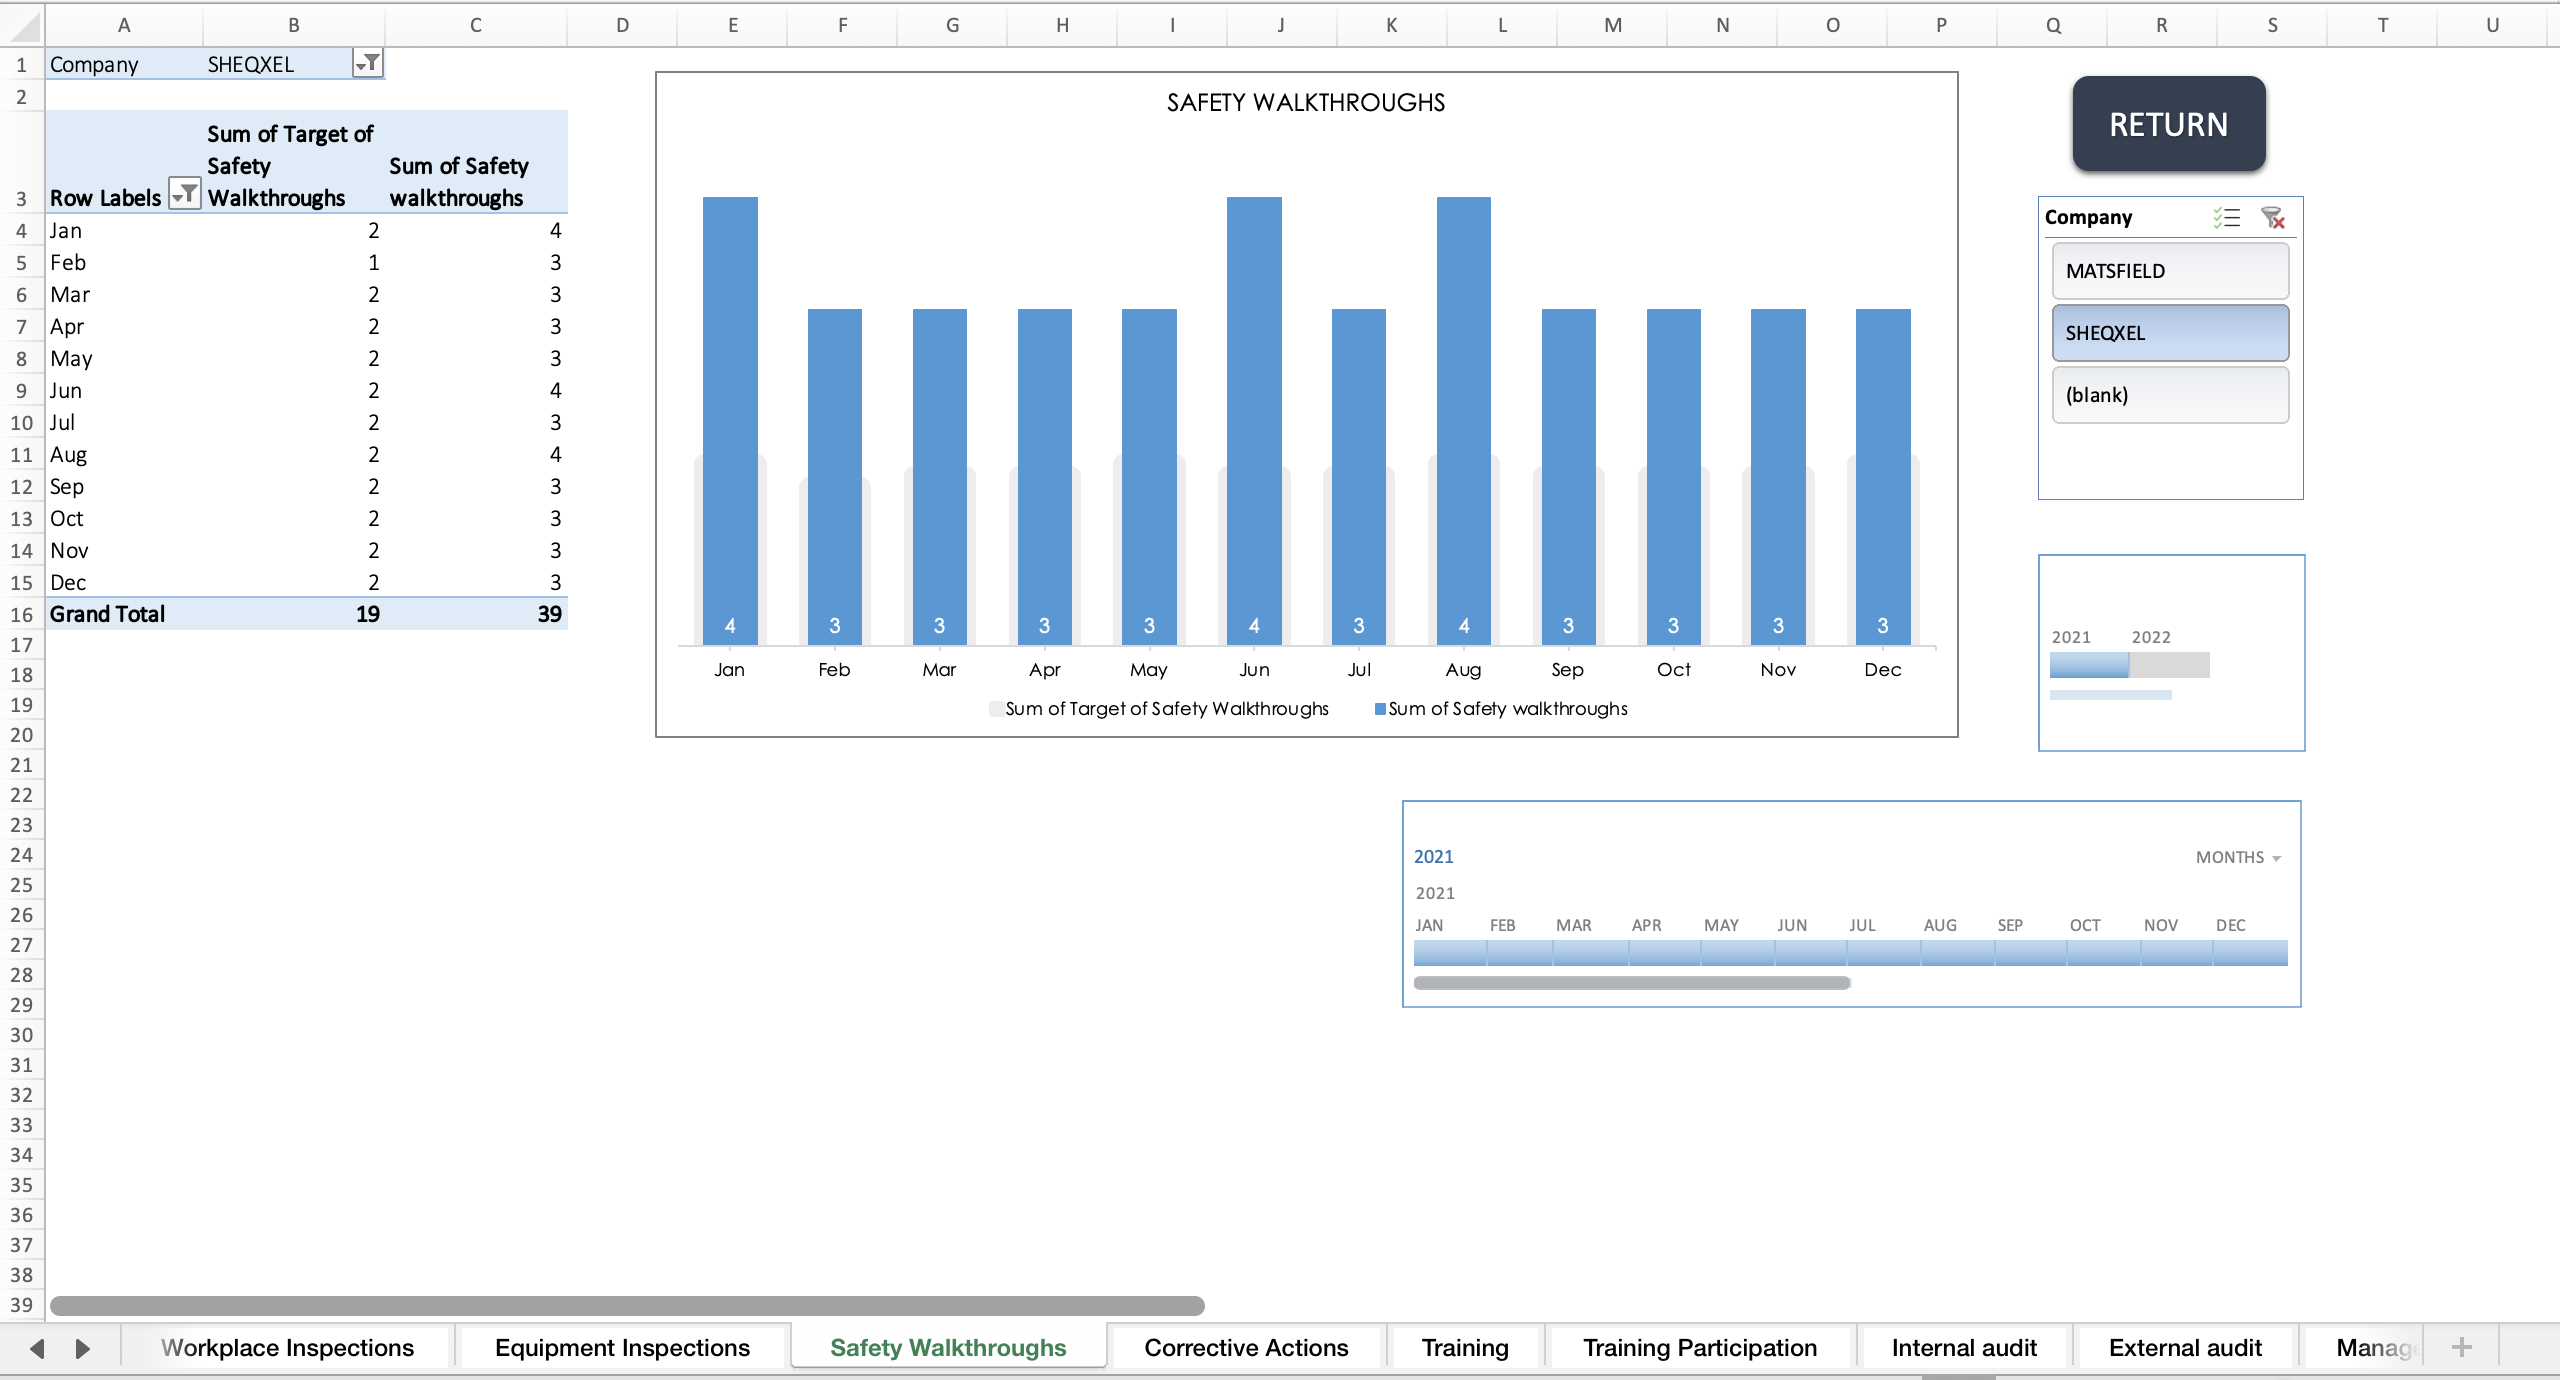
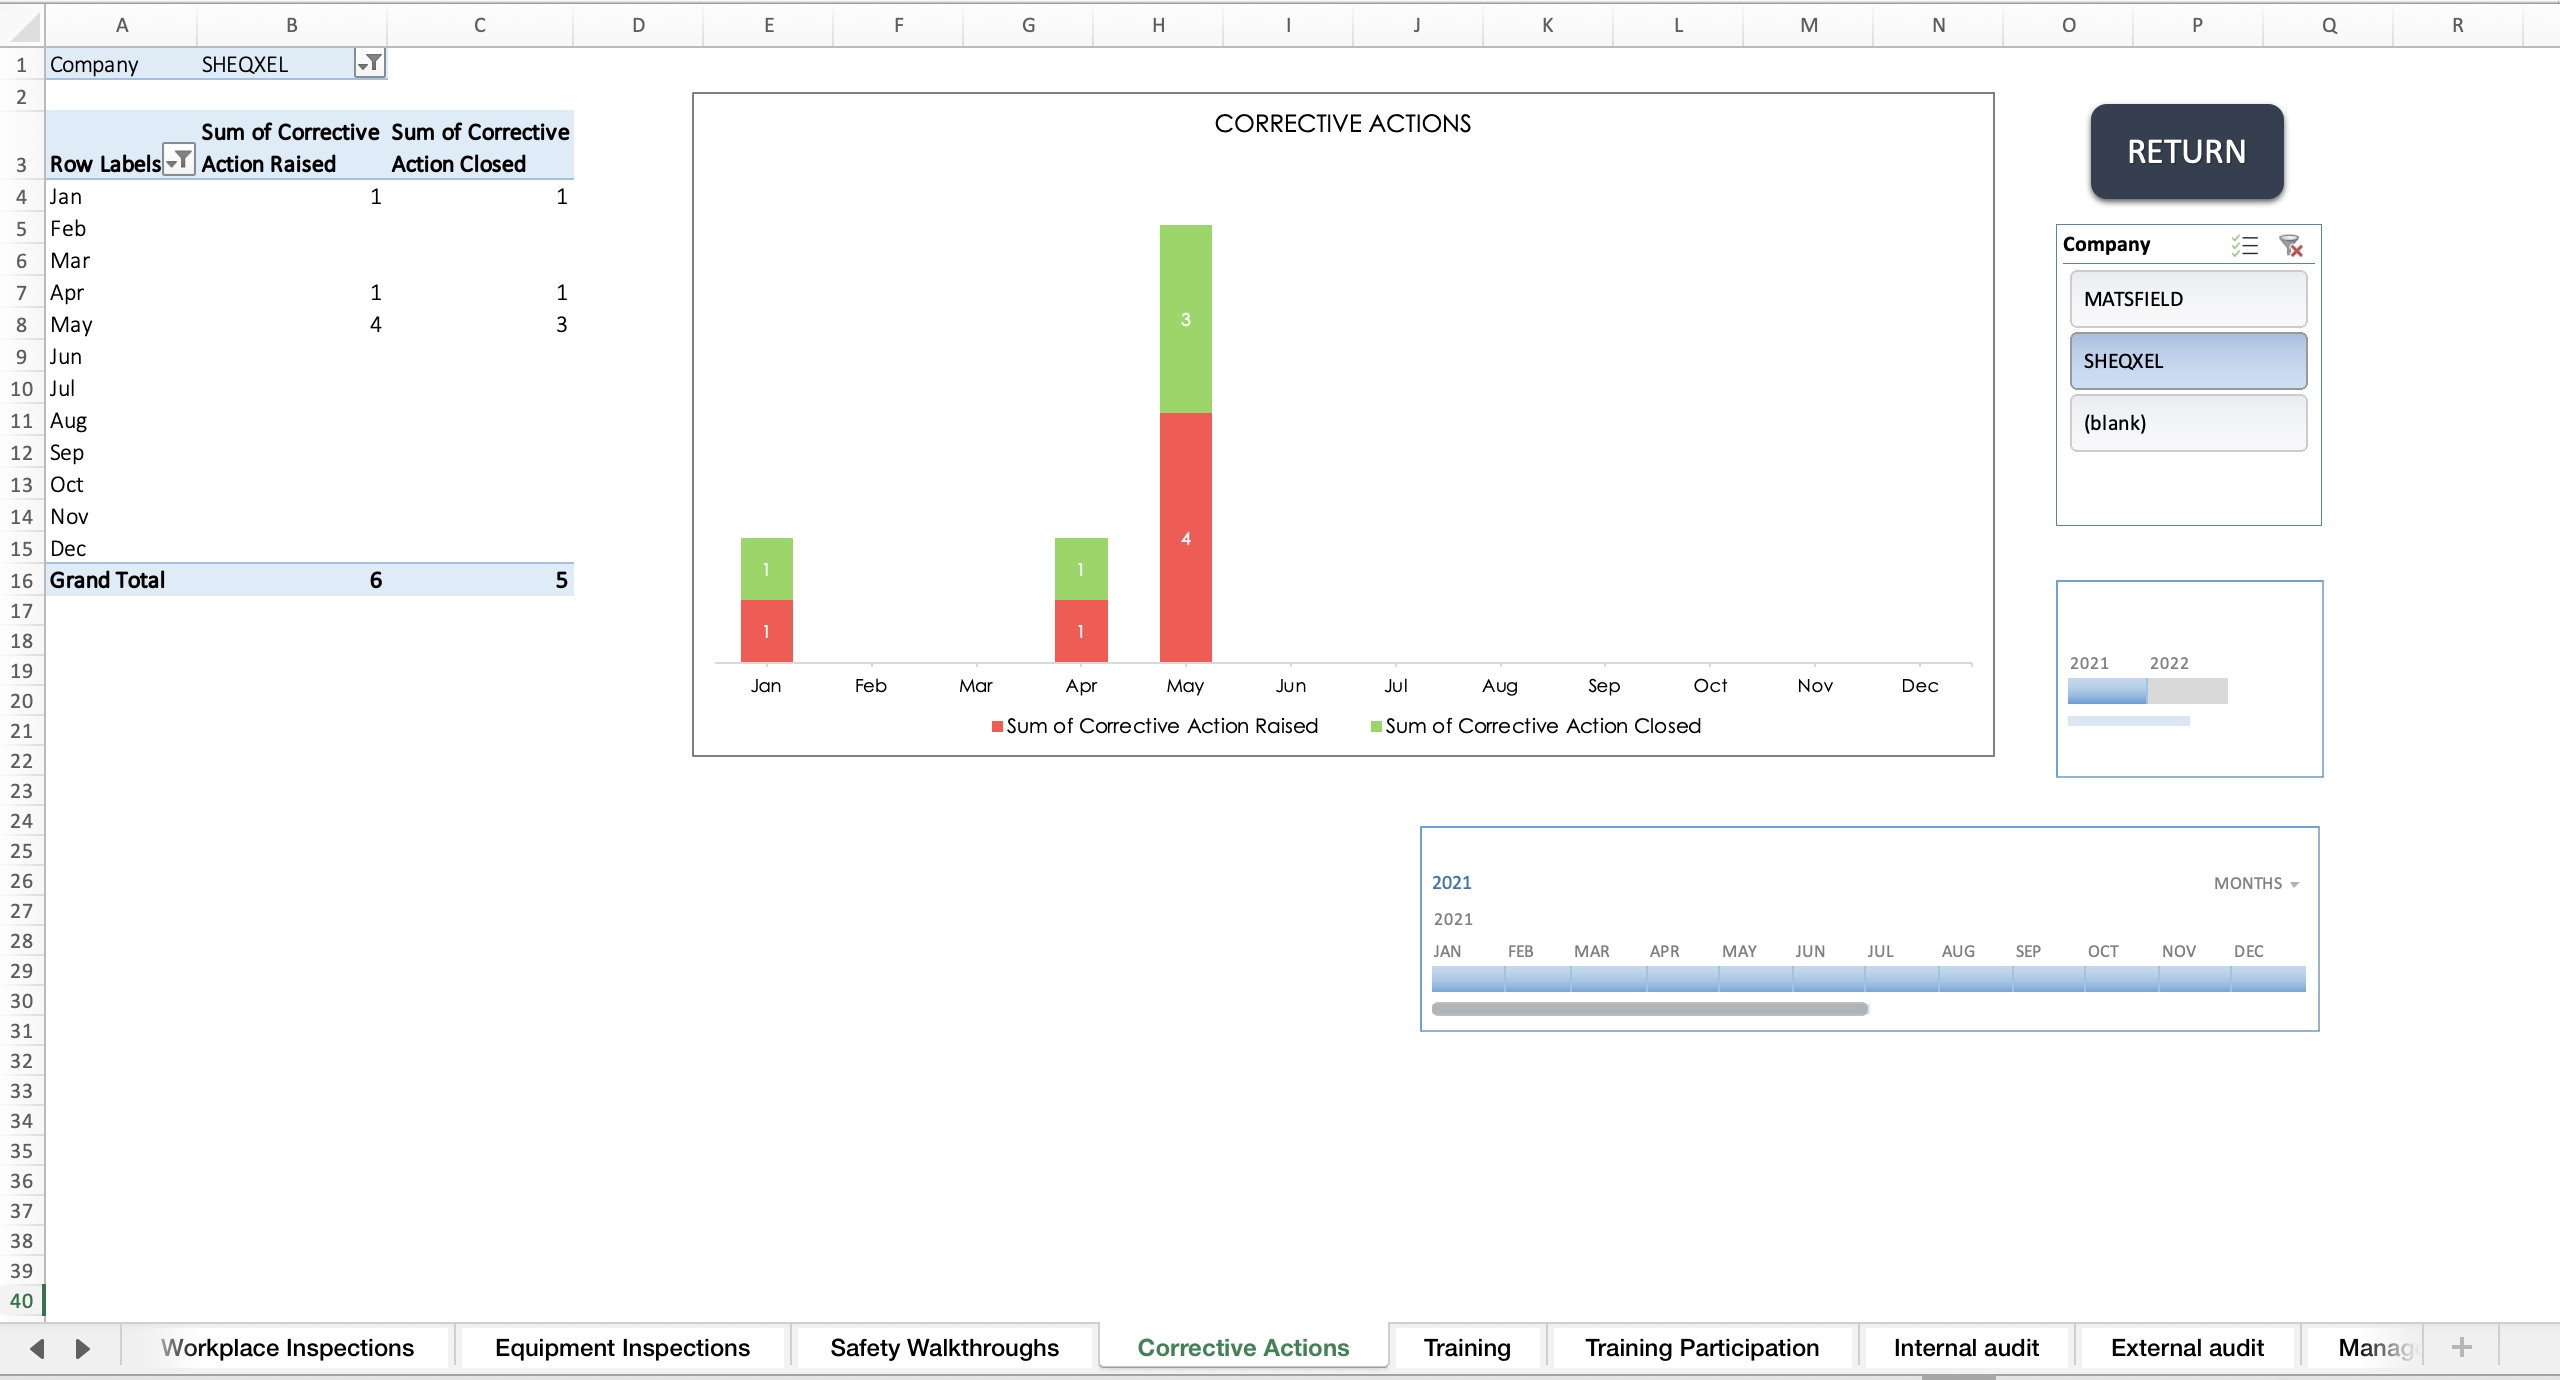
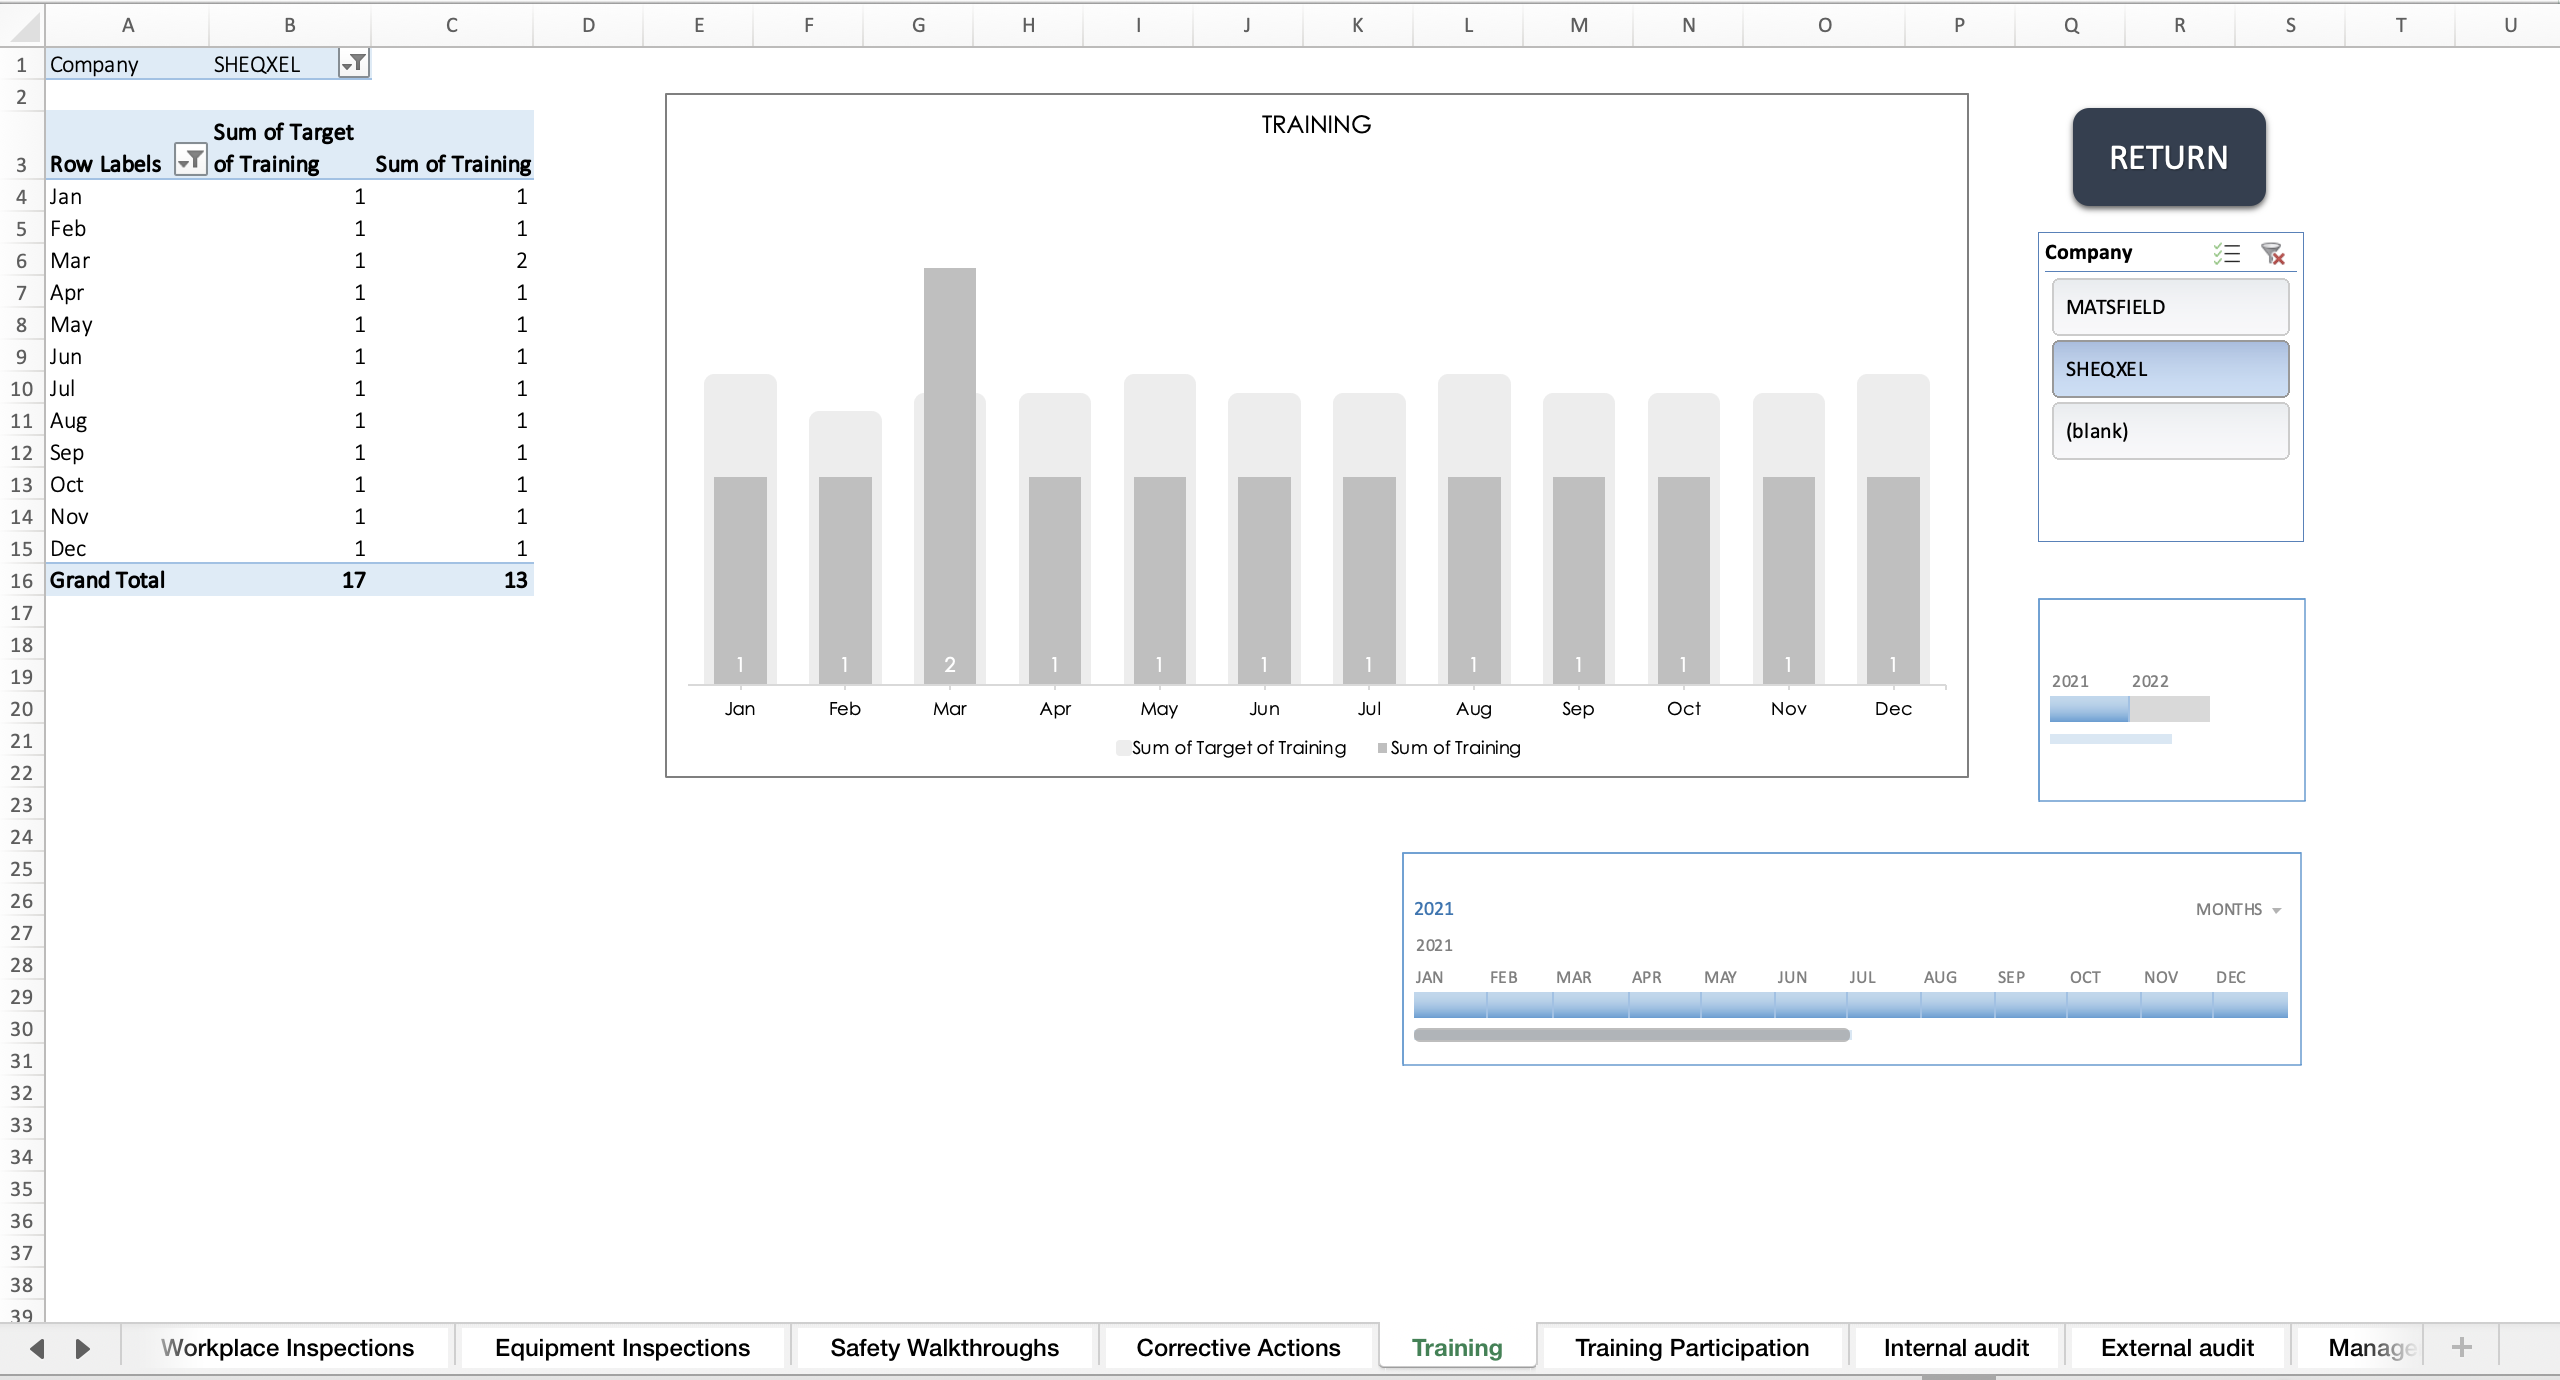
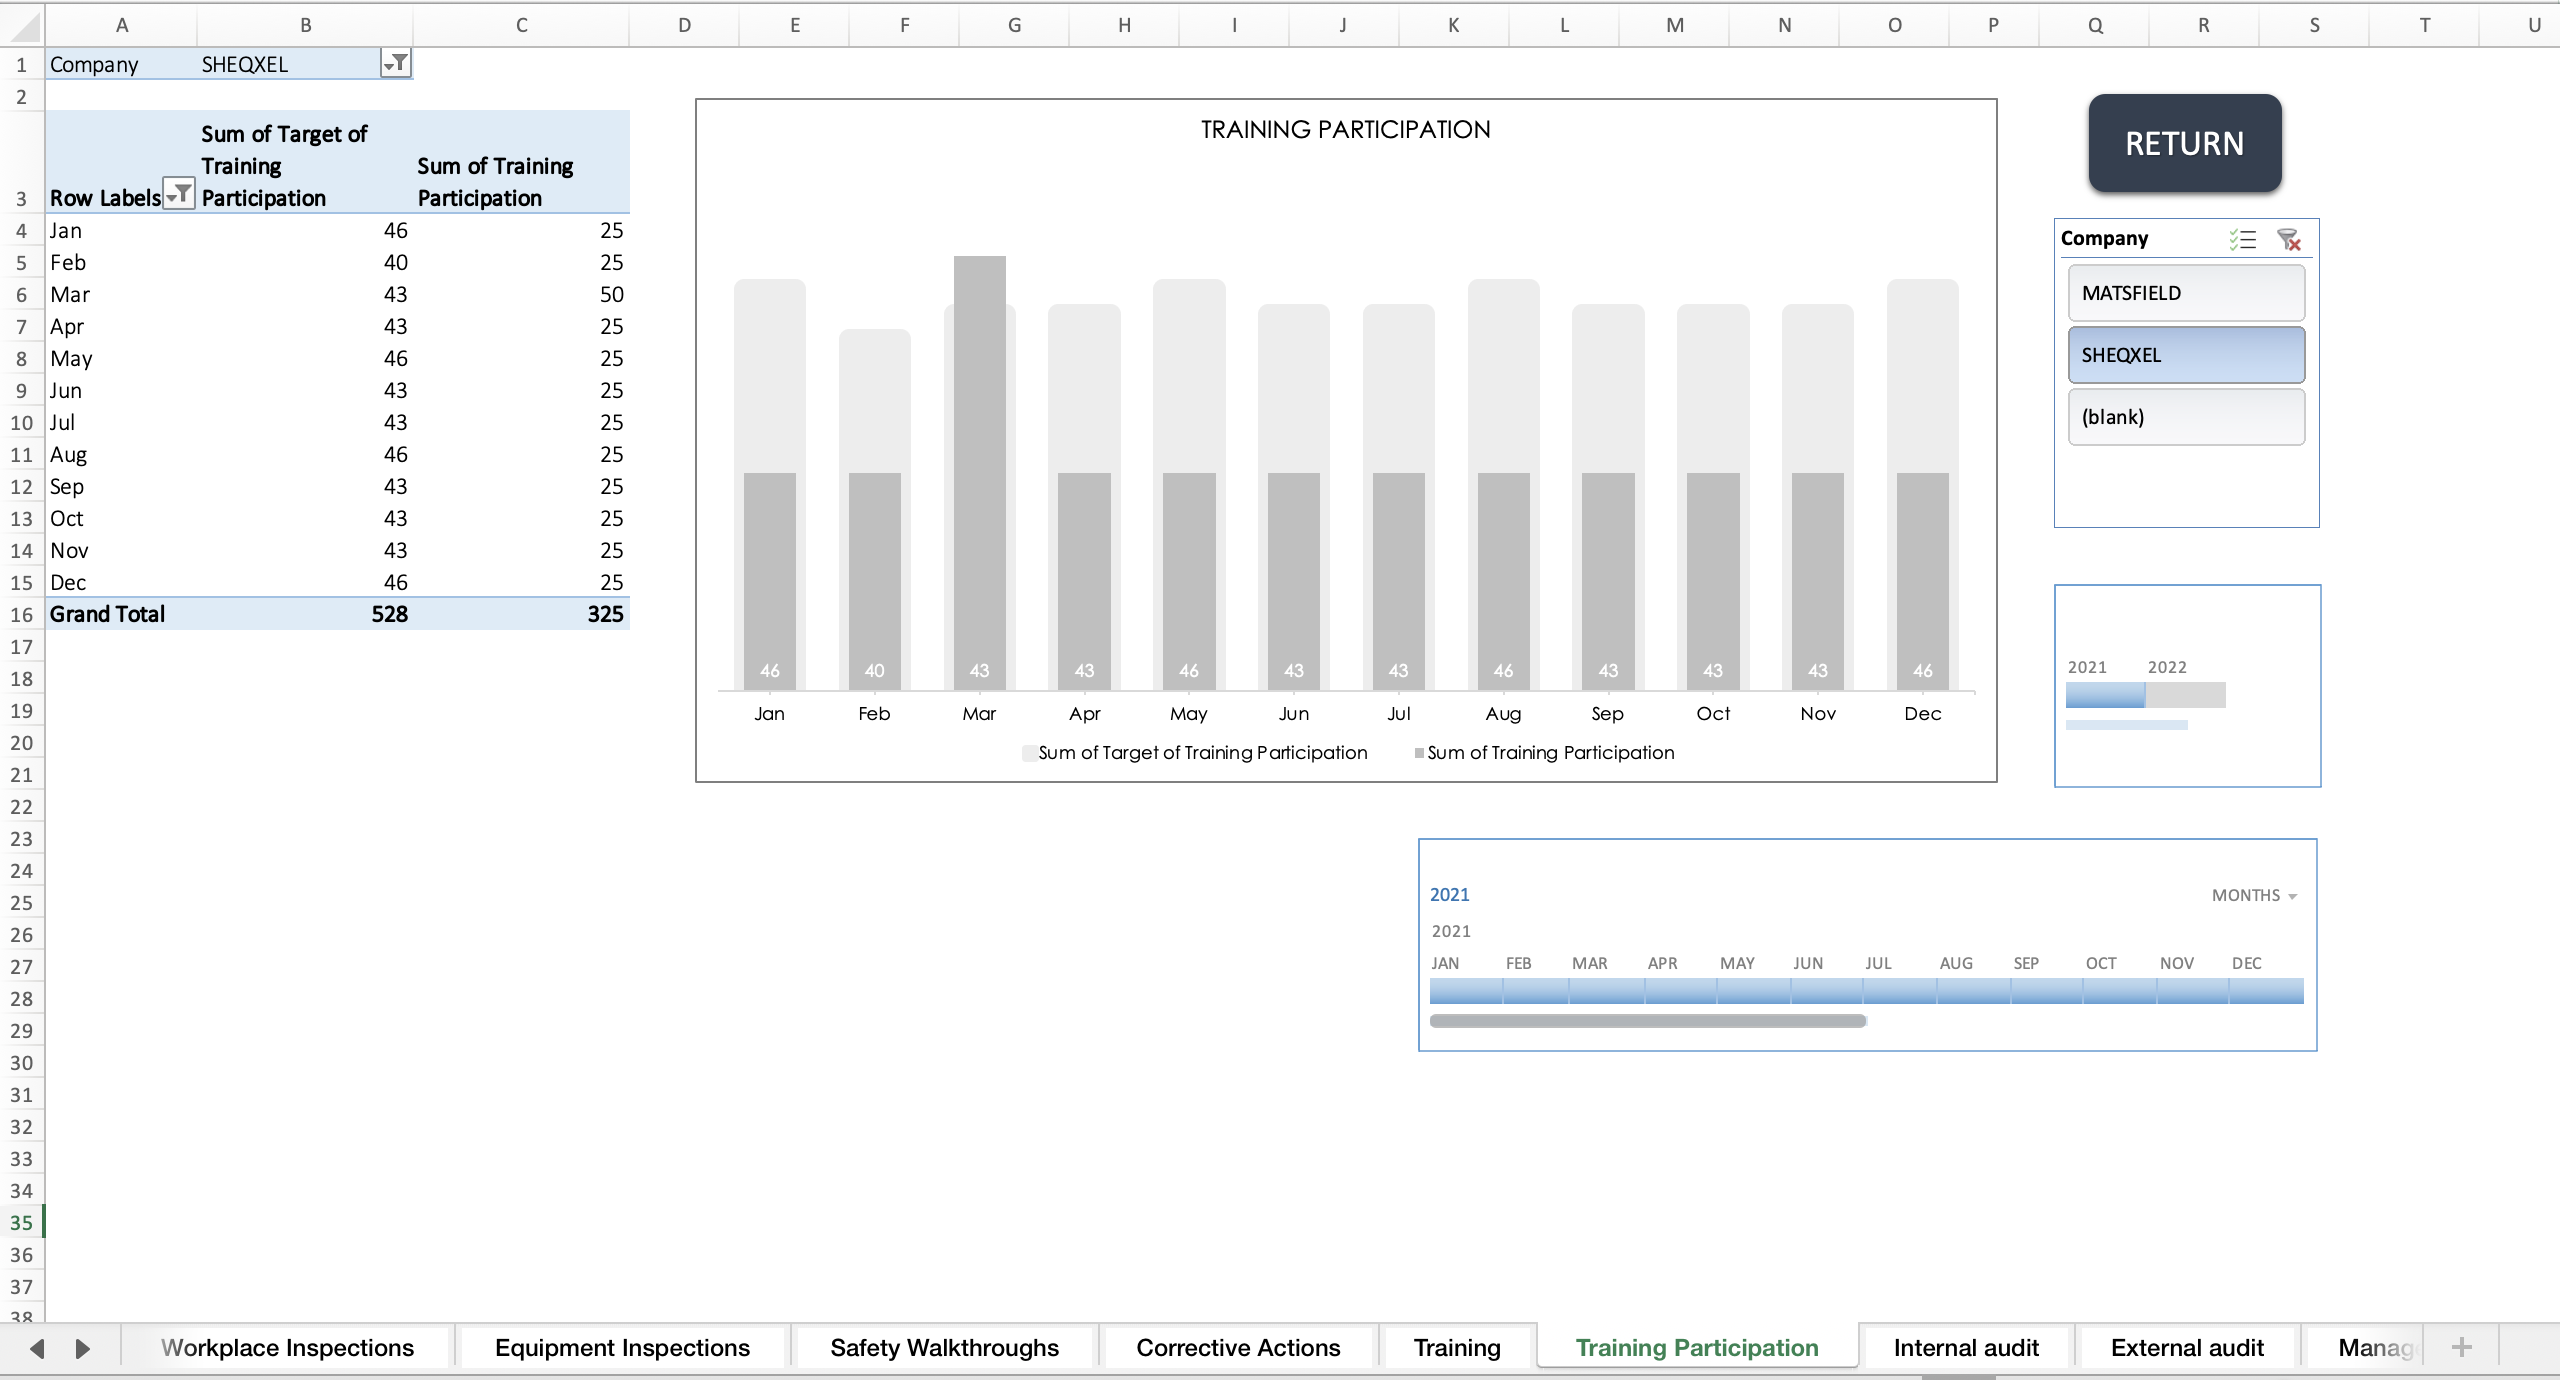
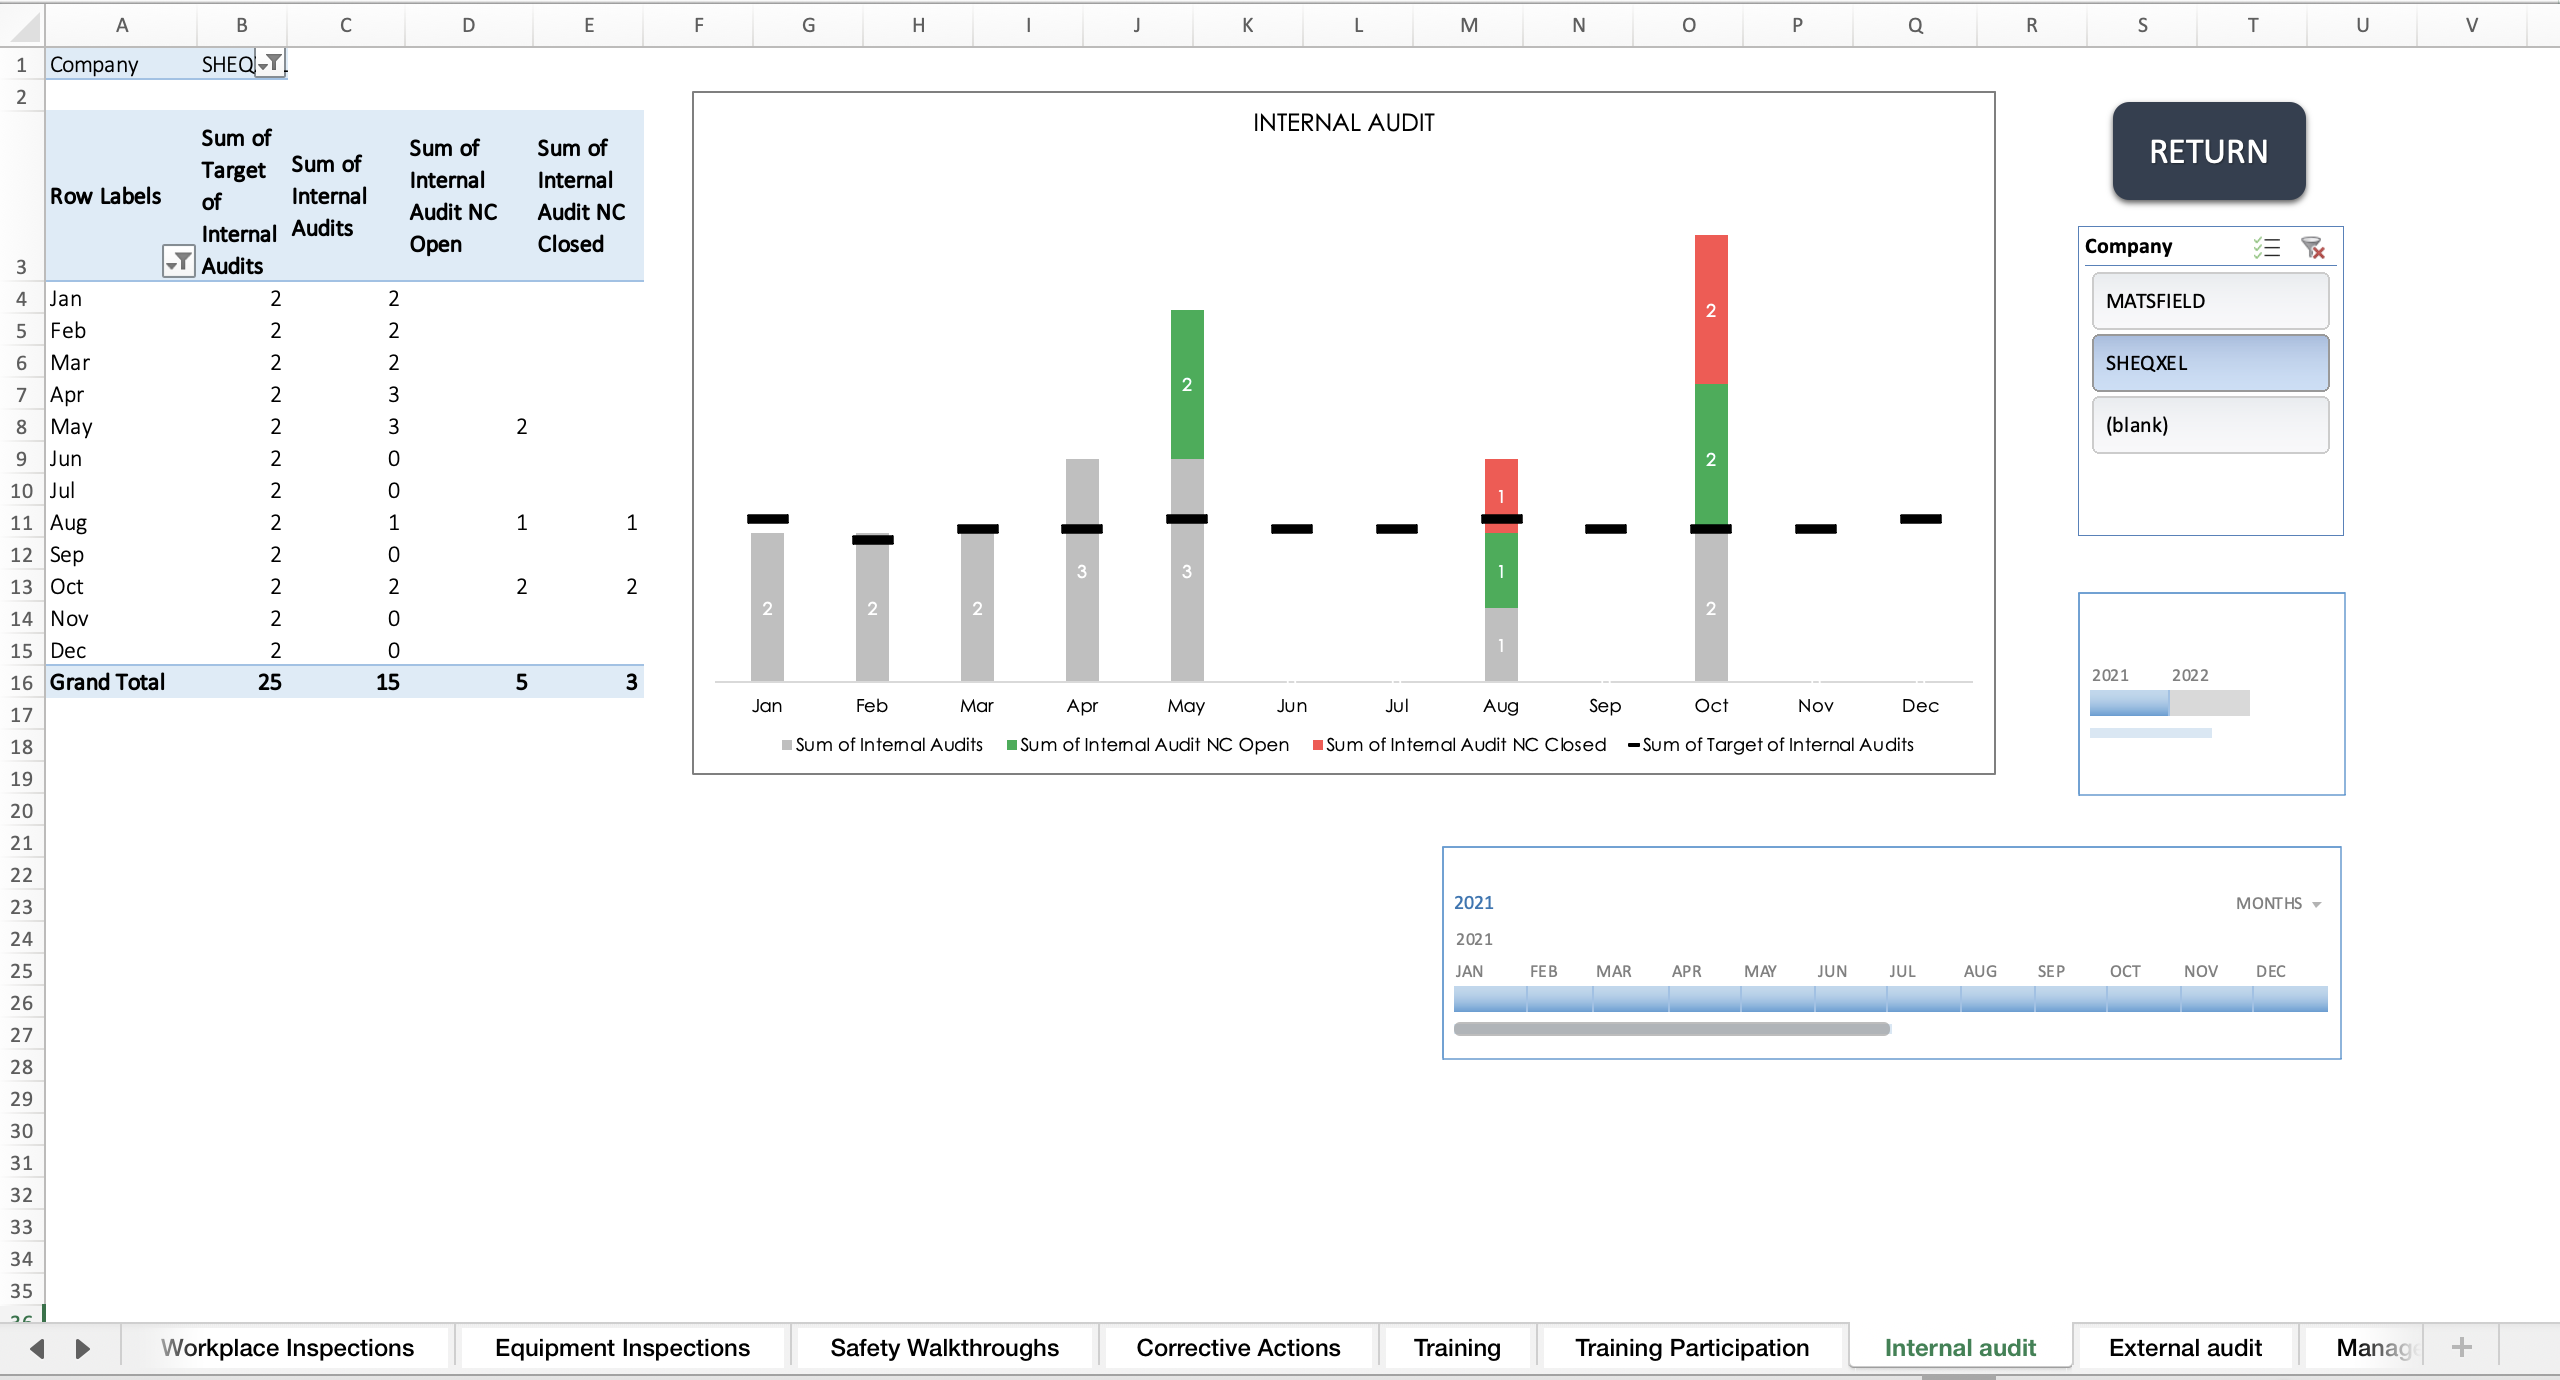
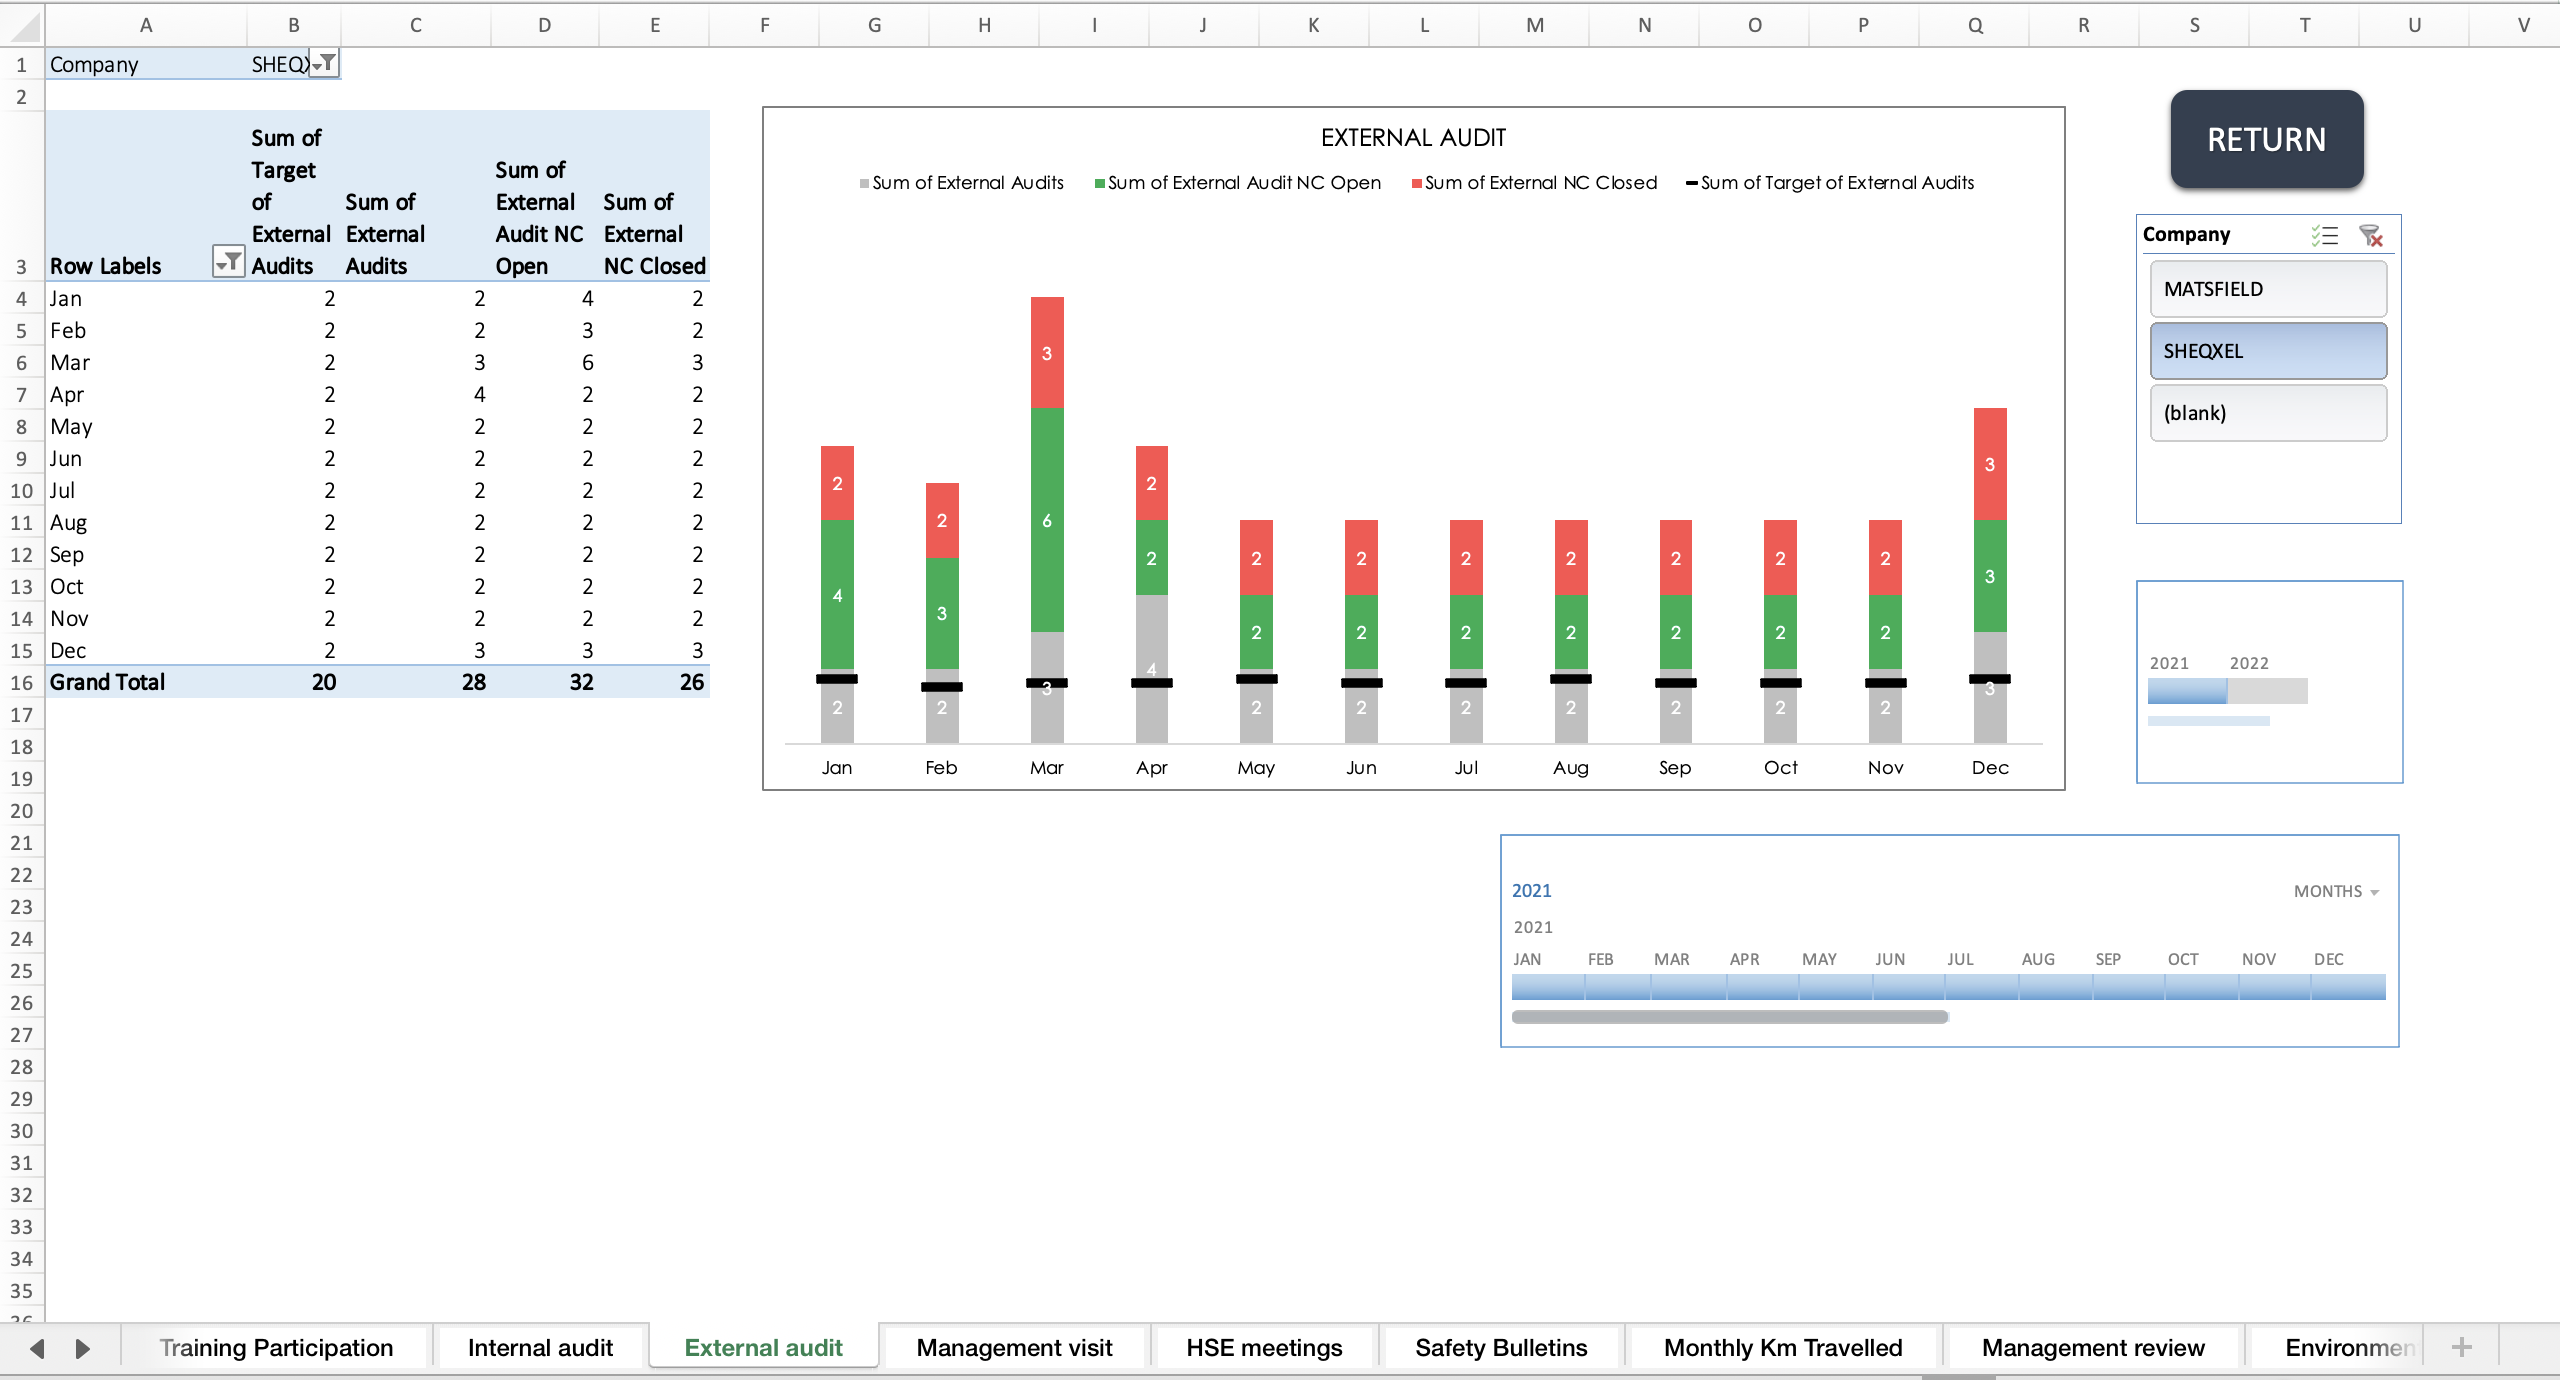
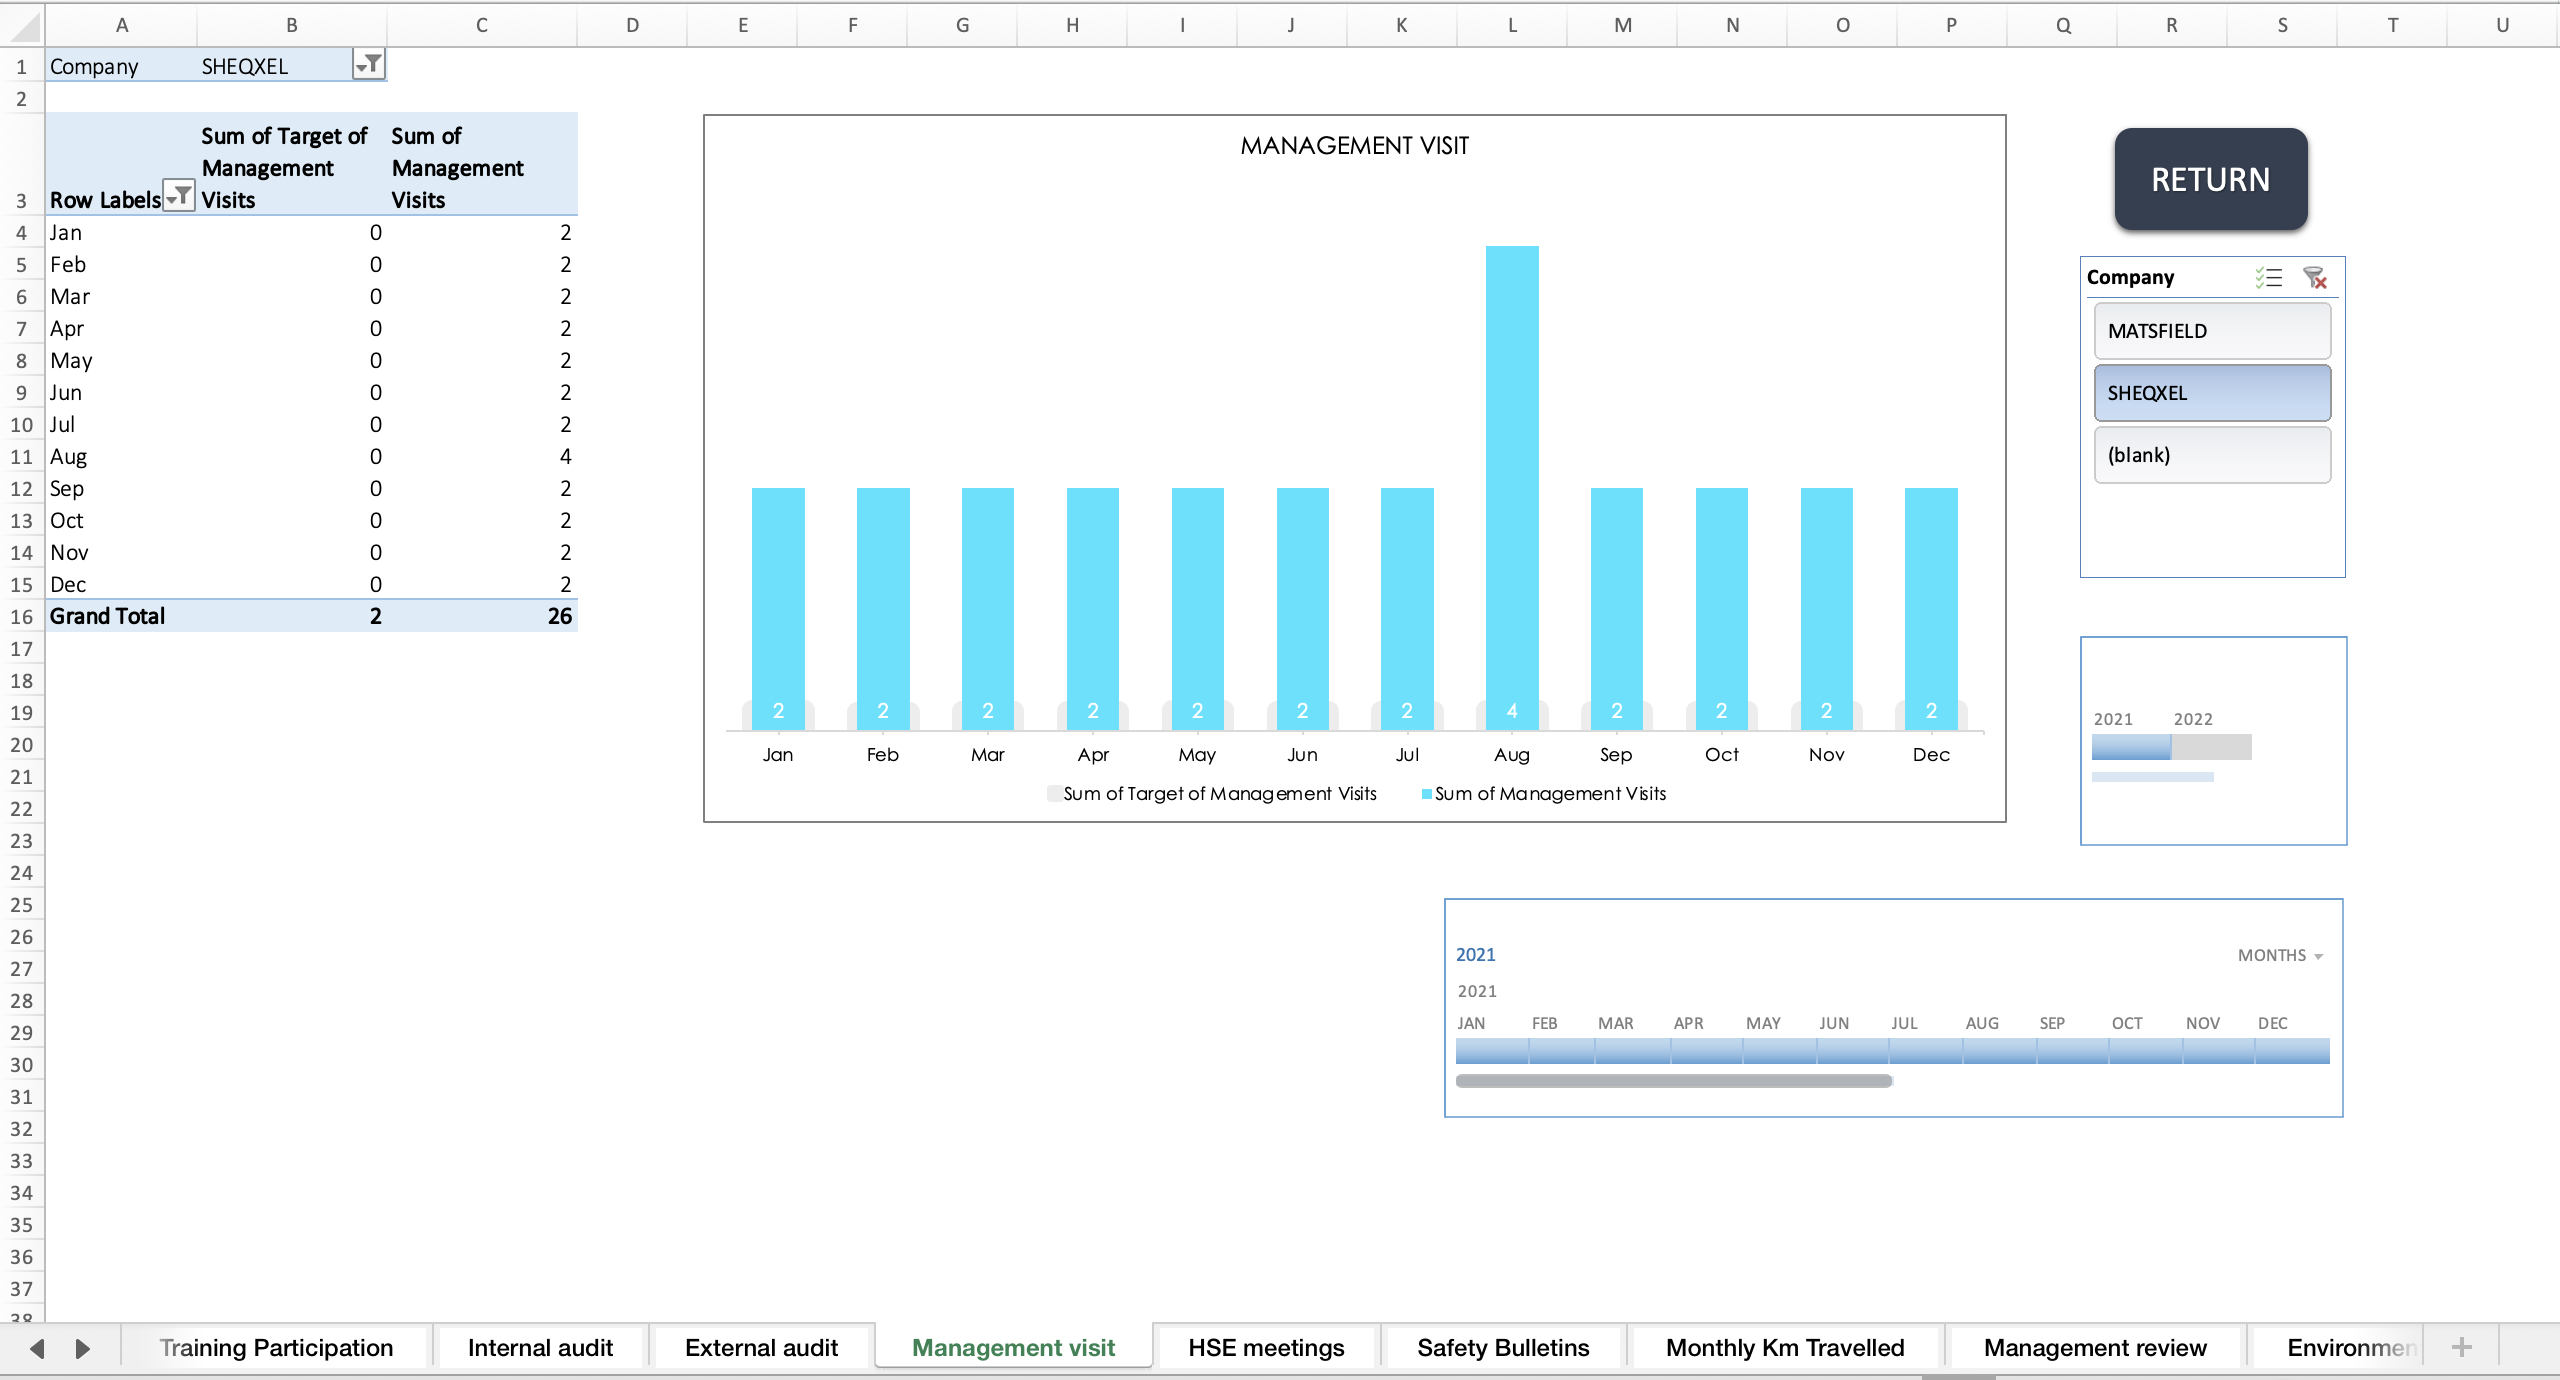
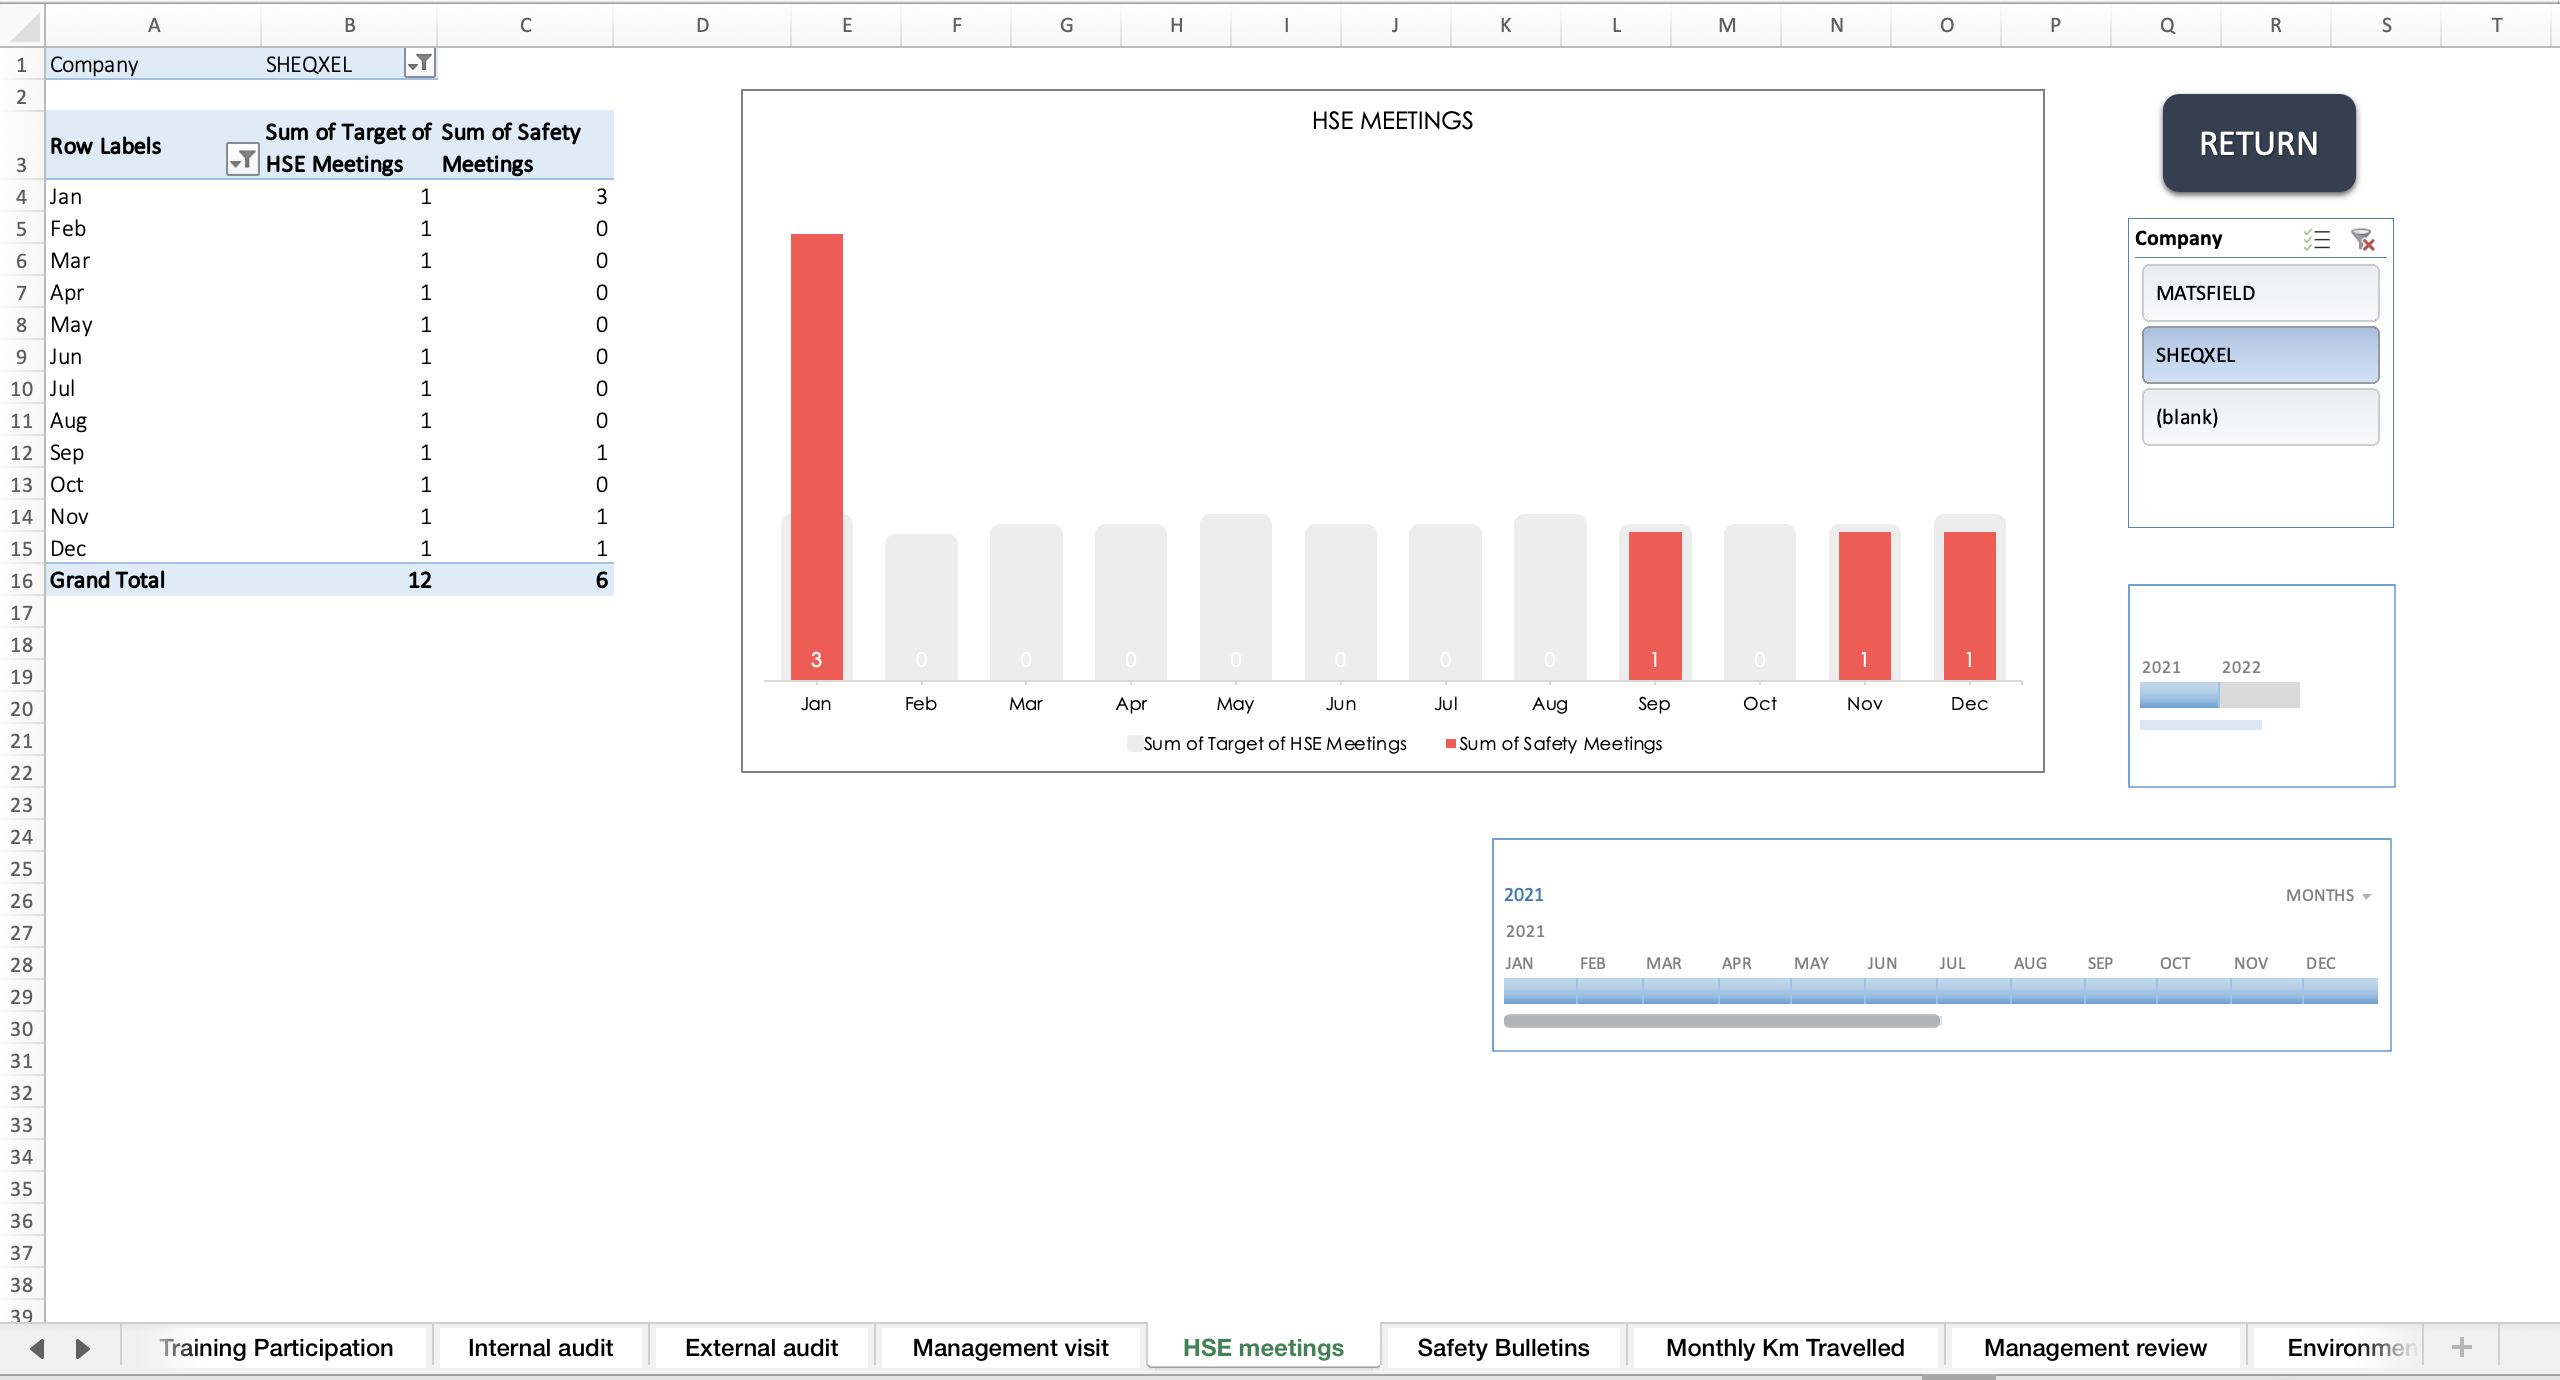
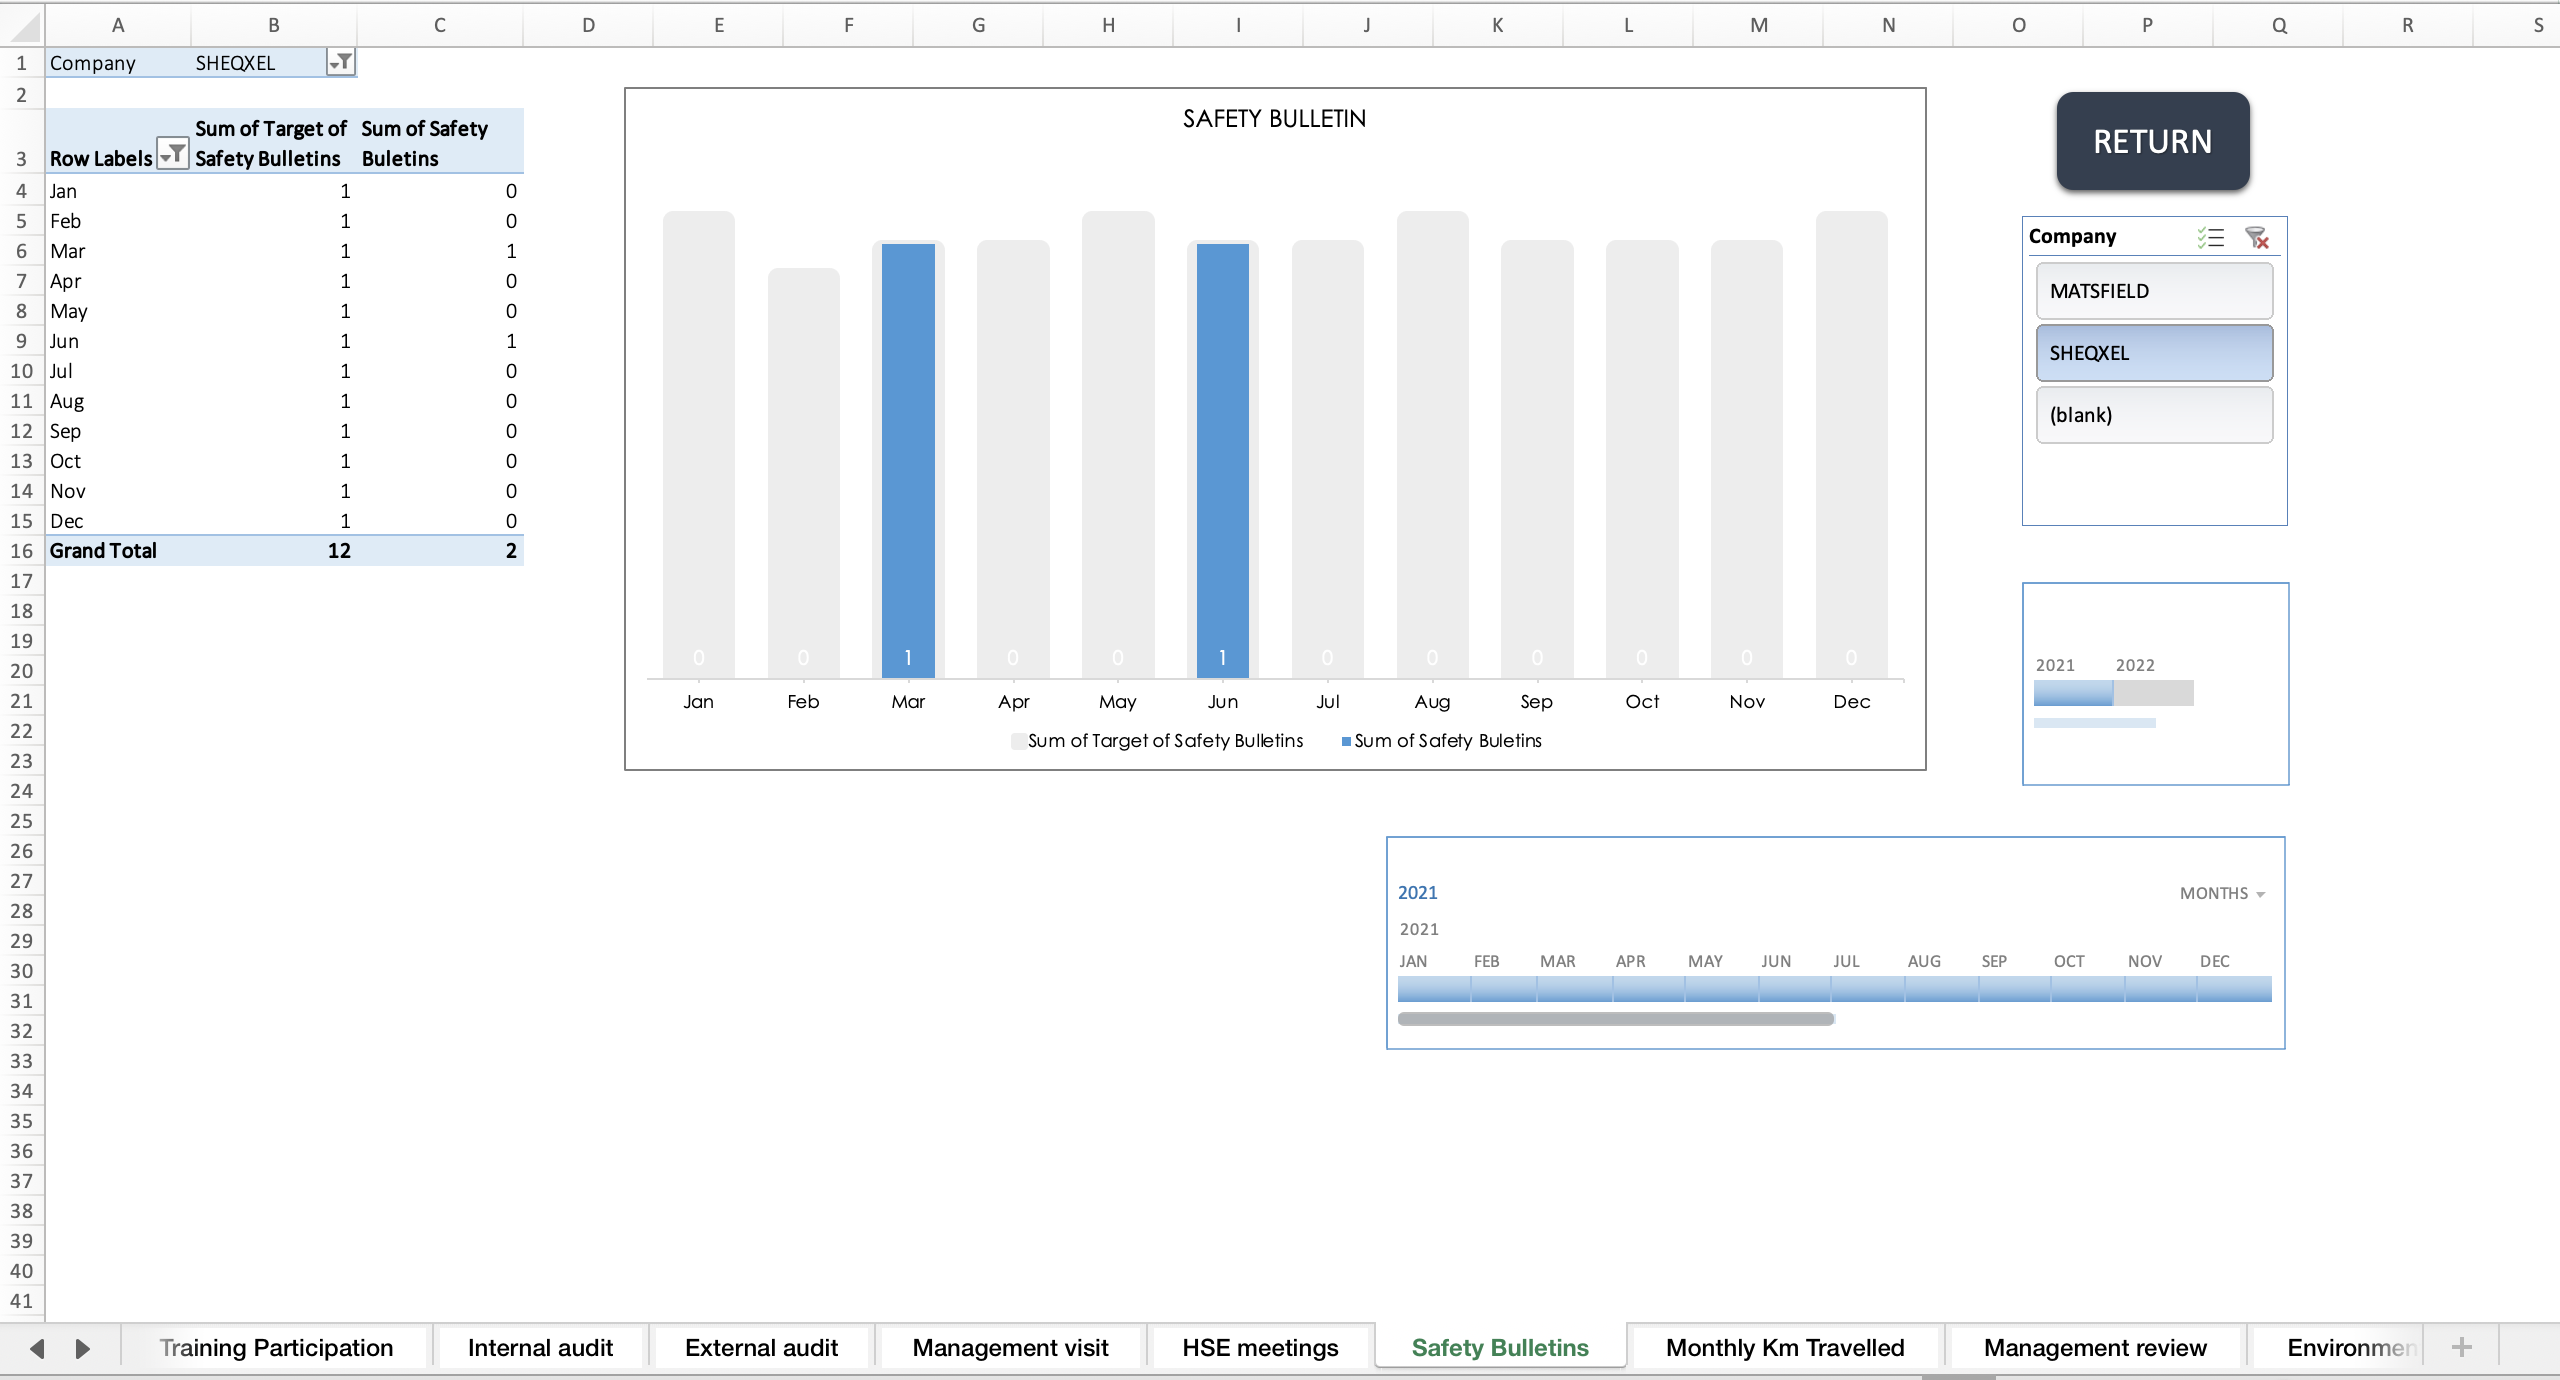
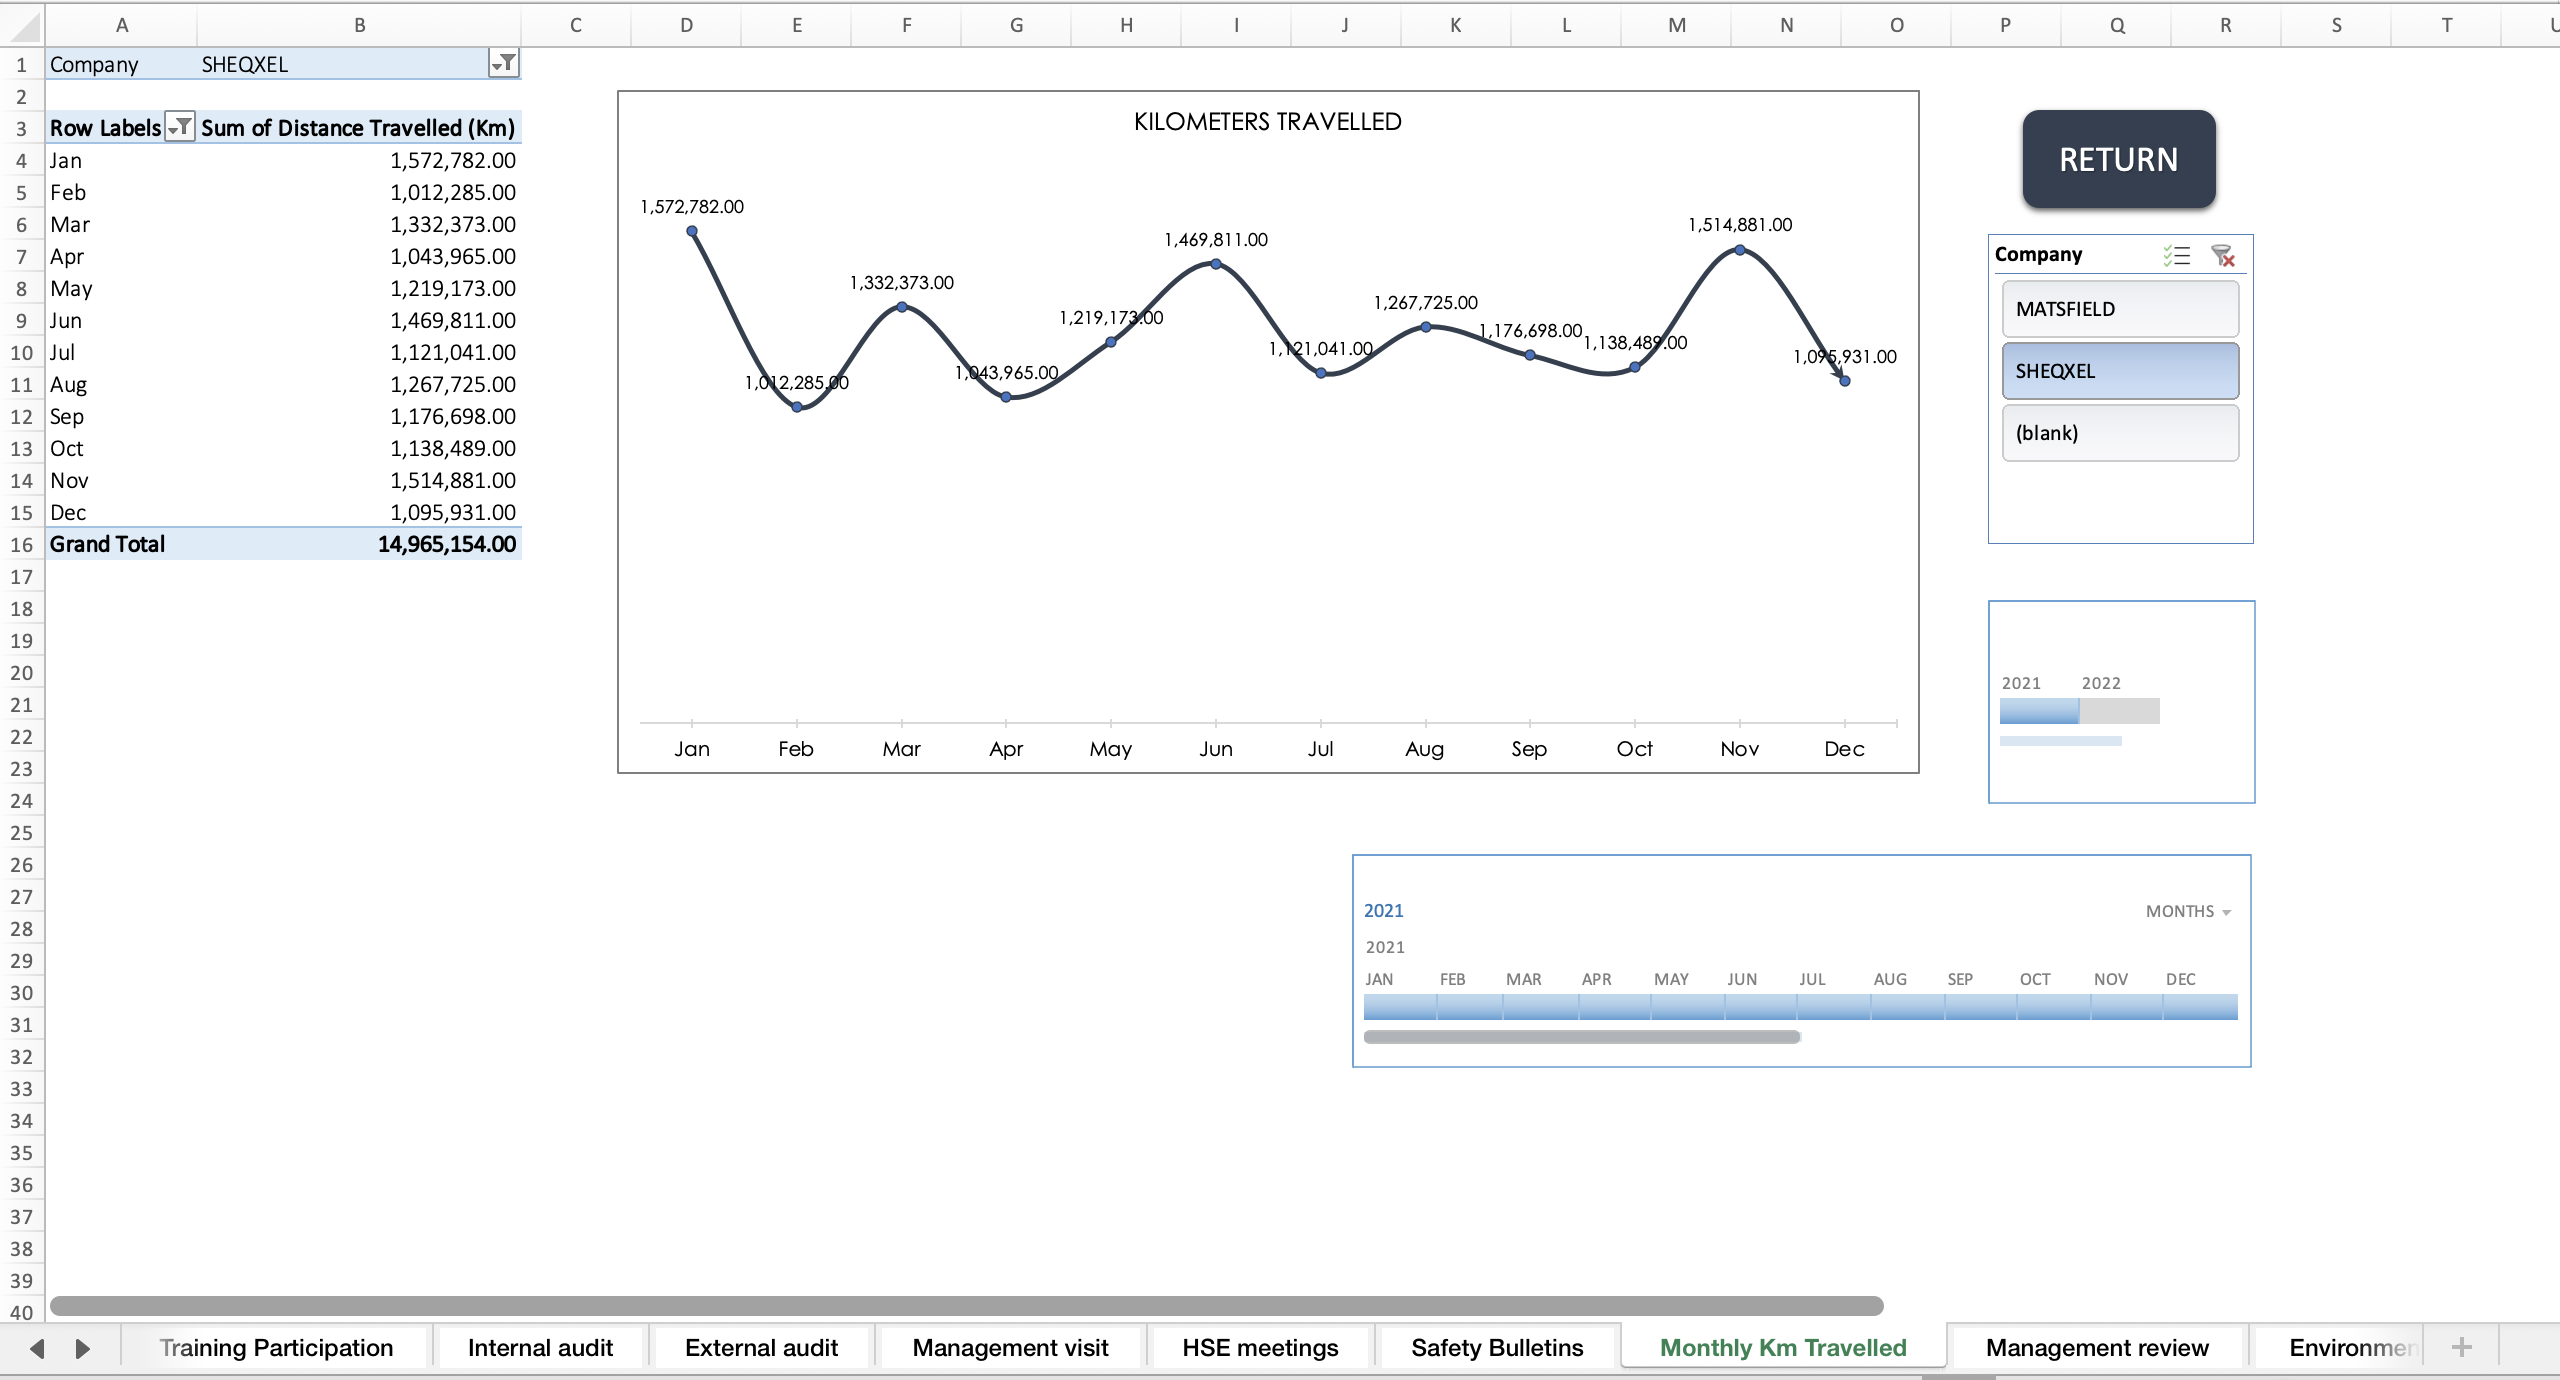
45 detailed sheets of tables and graphs for each KPI in the Source Data Sheet
Provides in-depth analysis for Annual HSE Performance Reports
Exclusively allows only daily data entries
Ideal for HSE professionals who need to:
Closely track KPIs
Manage performance analysis on a day-to-day basis
Includes pre-defined KPIs and report templates
Users only need to build the database — all reports generate automatically with one click
Ideal for organizations without a proprietary HSE management system
Delivered as a Microsoft Excel file — no installation required
Runs on Windows and Mac
Compatible with Microsoft Excel 2013 and later versions
This Best Practice includes
1 excel file, 3 PDFs
Further information
Designed to generate HSE Performance Reports.
