

Originally published: 19/04/2024 06:27
Last version published: 03/02/2025 08:54
Publication number: ELQ-28458-2
View all versions & Certificate
Last version published: 03/02/2025 08:54
Publication number: ELQ-28458-2
View all versions & Certificate

Fintech Mobile App Financial Model
A comprehensive editable, 3-statement MS Excel spreadsheet for tracking Fintech Mobile App finances.
AllFinancialModels offer a curated selection of high-quality yet financial model templates designed to support a wide range of business needs.Follow
Description
3-Statement Financial Model for a Fintech App that covers the Income Statement, Cash Flow Statement, and Balance Sheet while incorporating multiple revenue streams.
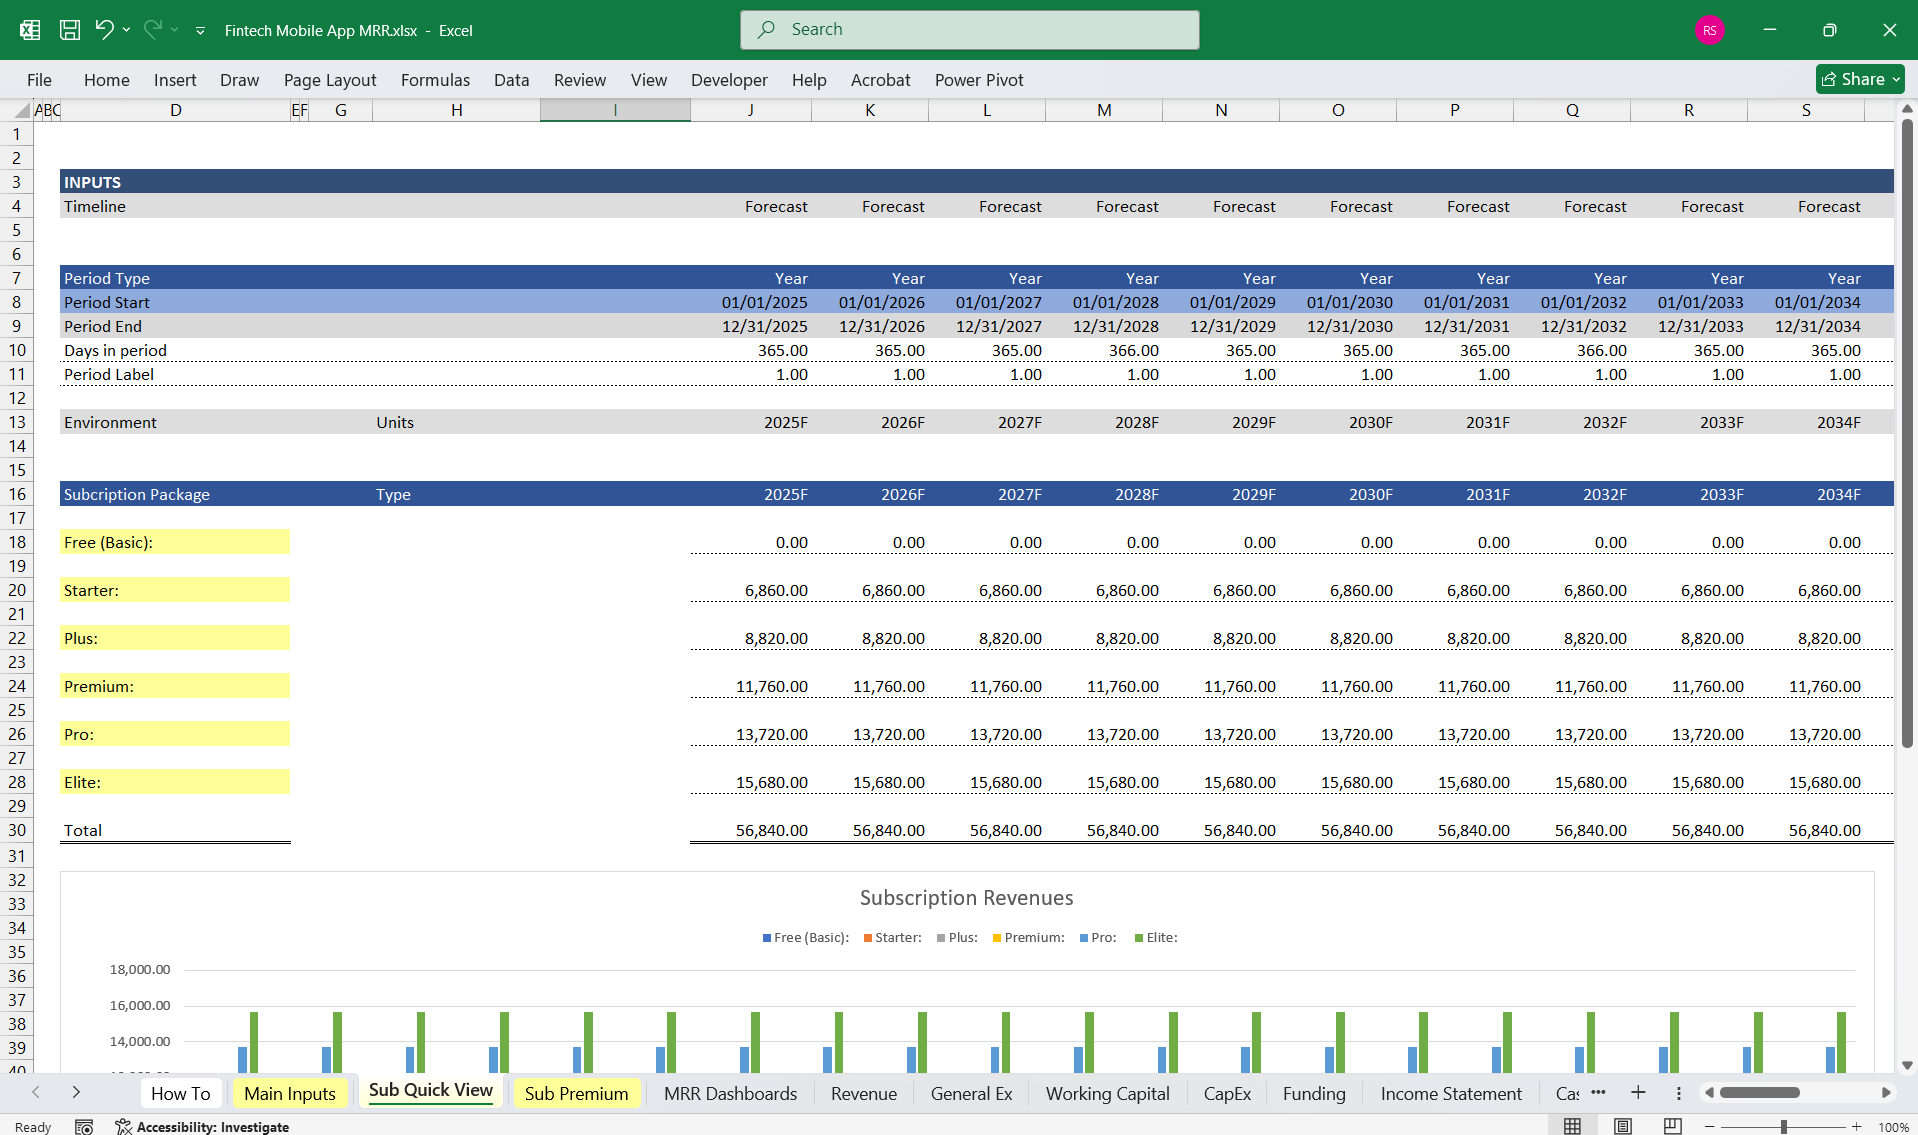
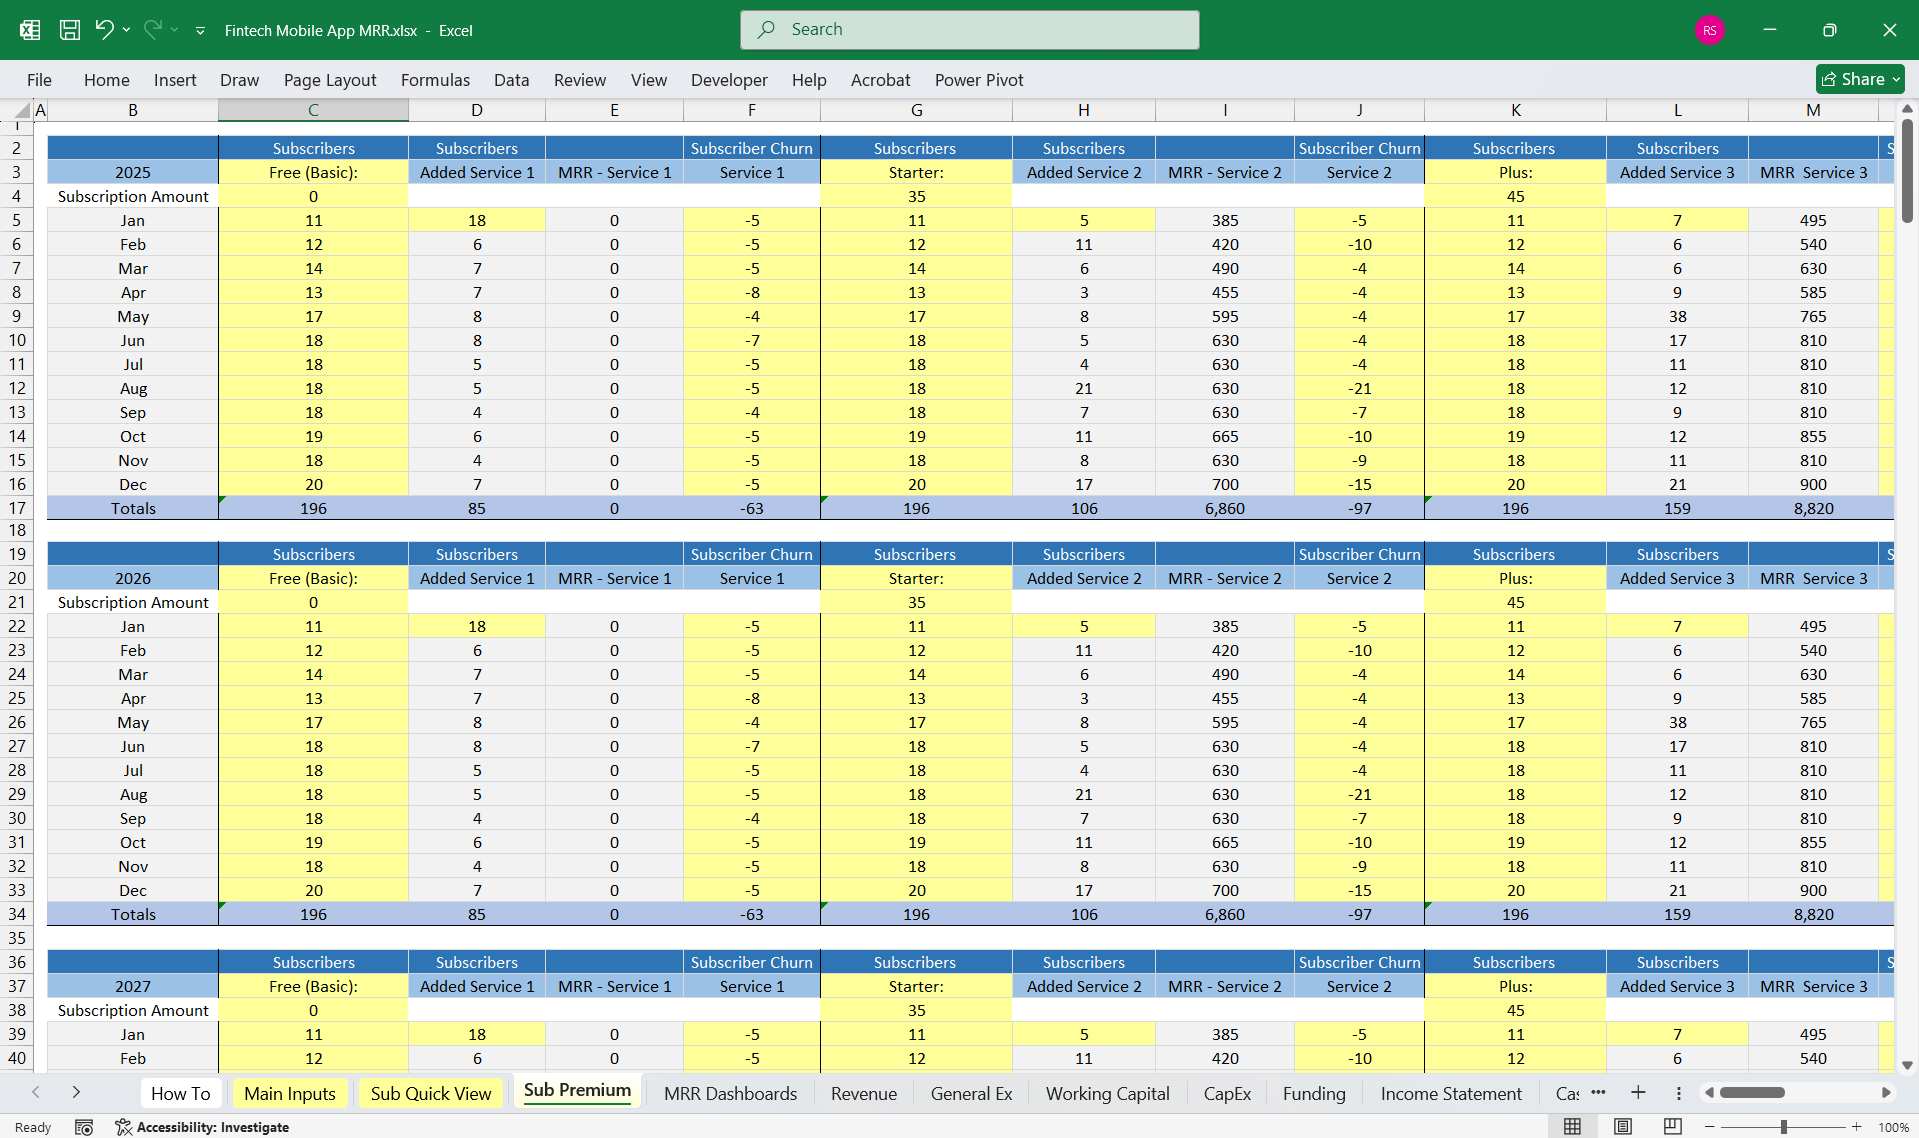
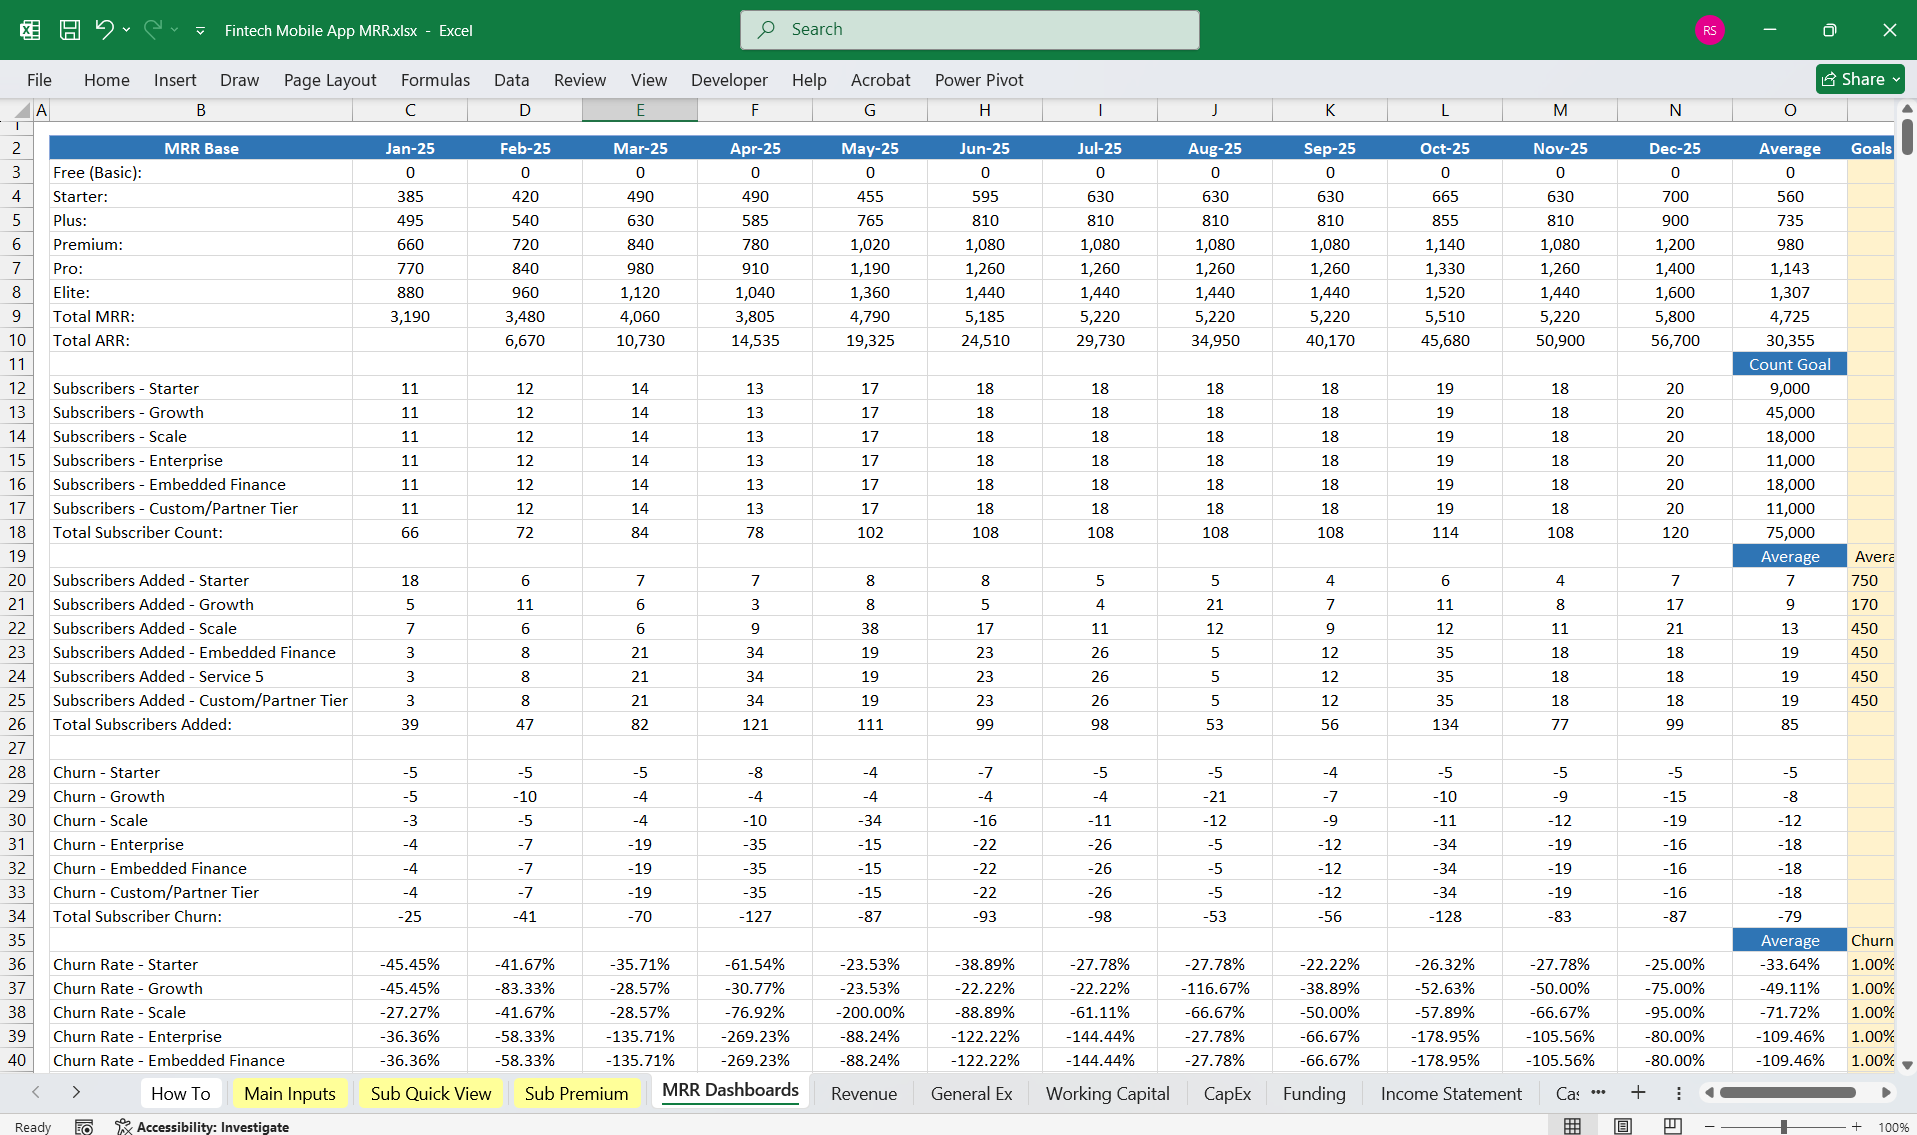
Here’s a structured 6-tier subscription model for your Fintech Mobile App, designed to cater to different customer needs:
1. Free Tier (Basic)
- Features:
- View account balances
- Transaction history (last 30 days)
- Basic budgeting tools
- Limited customer support (email only)
- Ads displayed
- Target Audience: Casual users, students, or those exploring the app.
2. Starter Tier
- Everything in Free Tier +
- Unlimited transaction history
- Custom budget categories
- Basic financial insights & alerts
- Priority email support
- Remove ads
- Target Audience:** Individuals looking for basic money management tools.
3. Plus Tier
- Everything in Starter Tier +
- AI-powered financial insights
- Credit score tracking
- Bill reminders & automated savings suggestions
- Limited investment tracking
- Chat-based customer support
- Target Audience:** Users seeking a more advanced personal finance experience.
4. Premium Tier
- Everything in Plus Tier +
- Advanced investment tracking (stocks, crypto, real estate)
- Multi-account aggregation (connect multiple banks, PayPal, etc.)
- Fraud detection & alerts
- Smart financial goal-setting tools
- Phone support with financial advisors (limited to 2 sessions/month)
- Target Audience:** Serious budgeters & early investors.
5. Pro Tier
- Everything in Premium Tier +
- Personalized AI-driven investment recommendations
- Tax optimization insights
- Advanced credit analysis & improvement tips
- International currency tracking
- Unlimited access to financial advisors (via chat & phone)
- Target Audience:** High-income professionals & investors.
6. Elite Tier
- Everything in Pro Tier +
- Dedicated financial advisor (1:1 support)
- Exclusive investment opportunities (private equity, pre-IPOs, etc.)
- Advanced tax planning with CPA integration
- Custom financial reports & wealth management tools
- Priority 24/7 concierge support
- Target Audience:** High-net-worth individuals & financial power users.
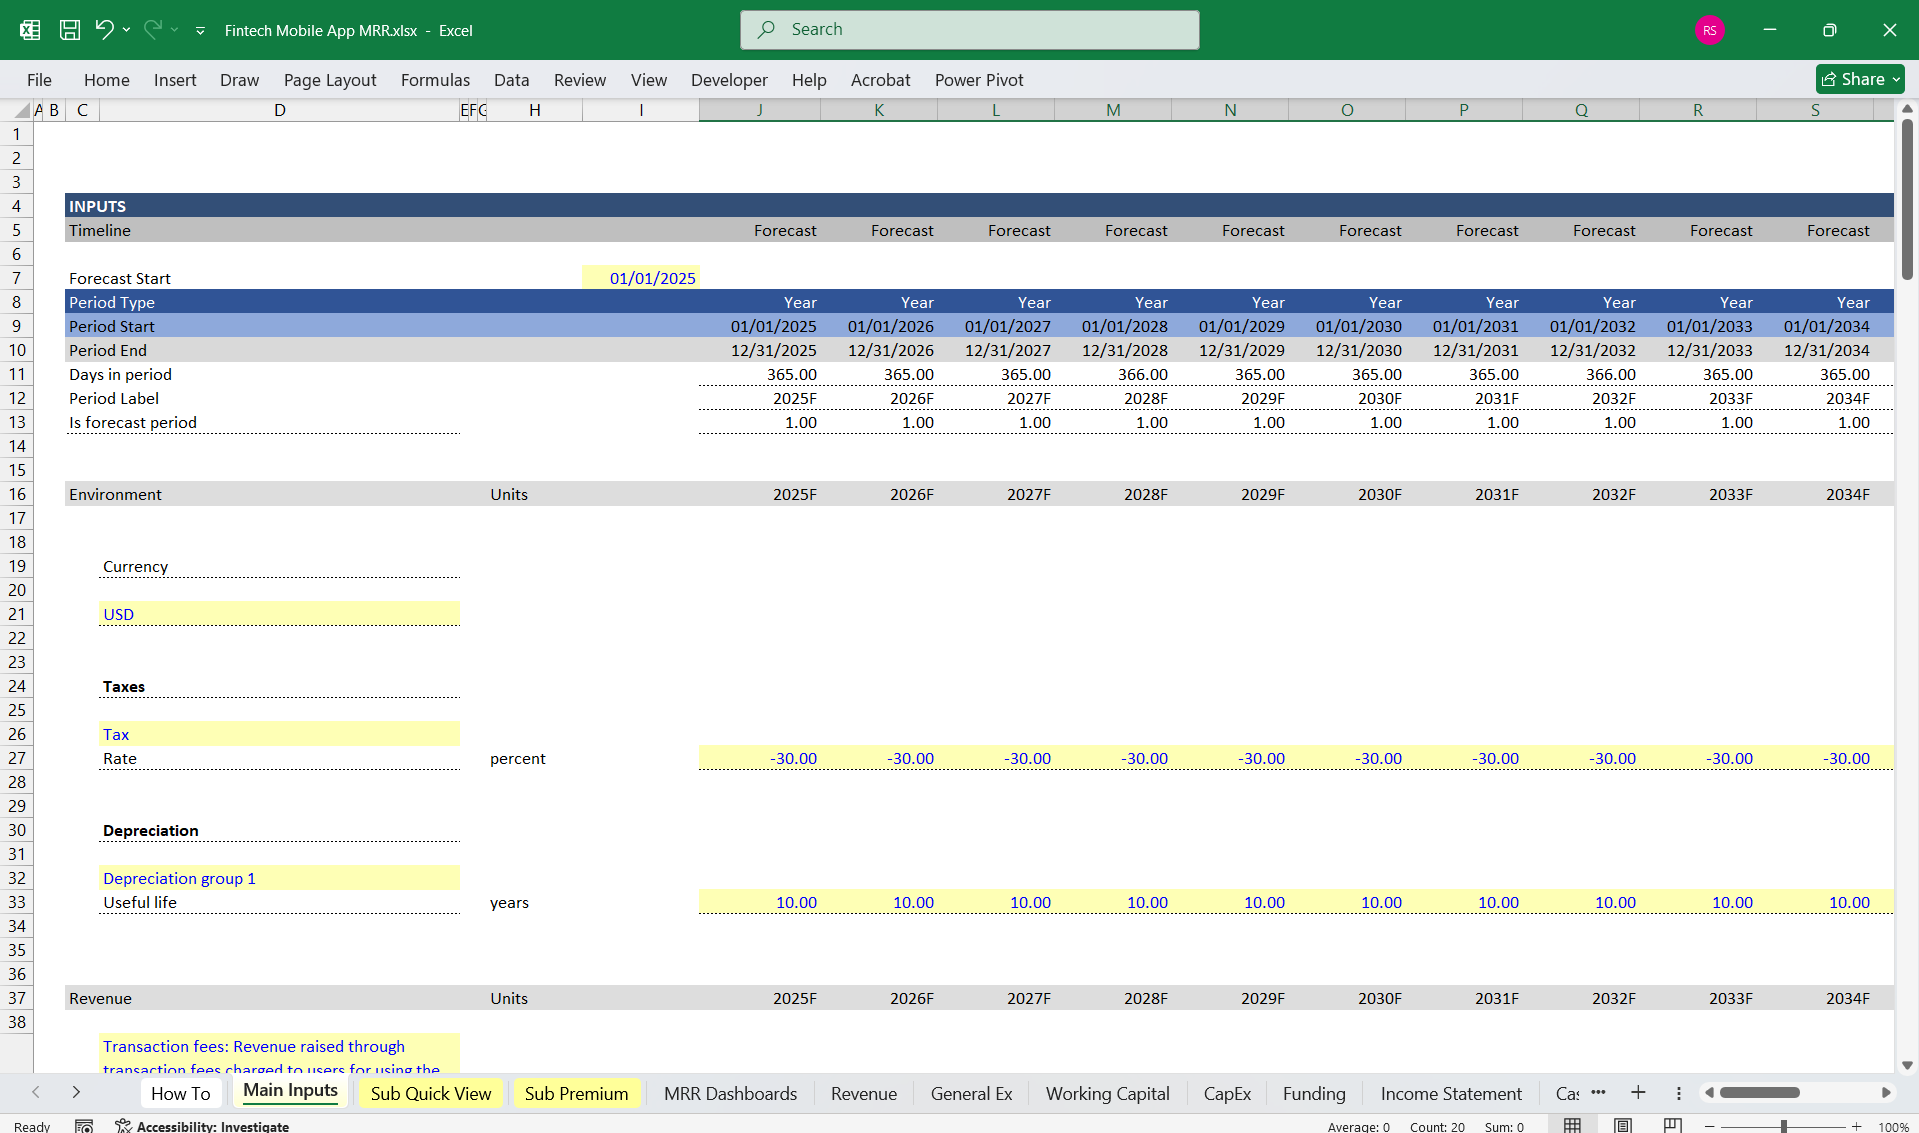
1. Income StatementThe income statement outlines the company's financial performance, focusing on revenue, expenses, and profitability.
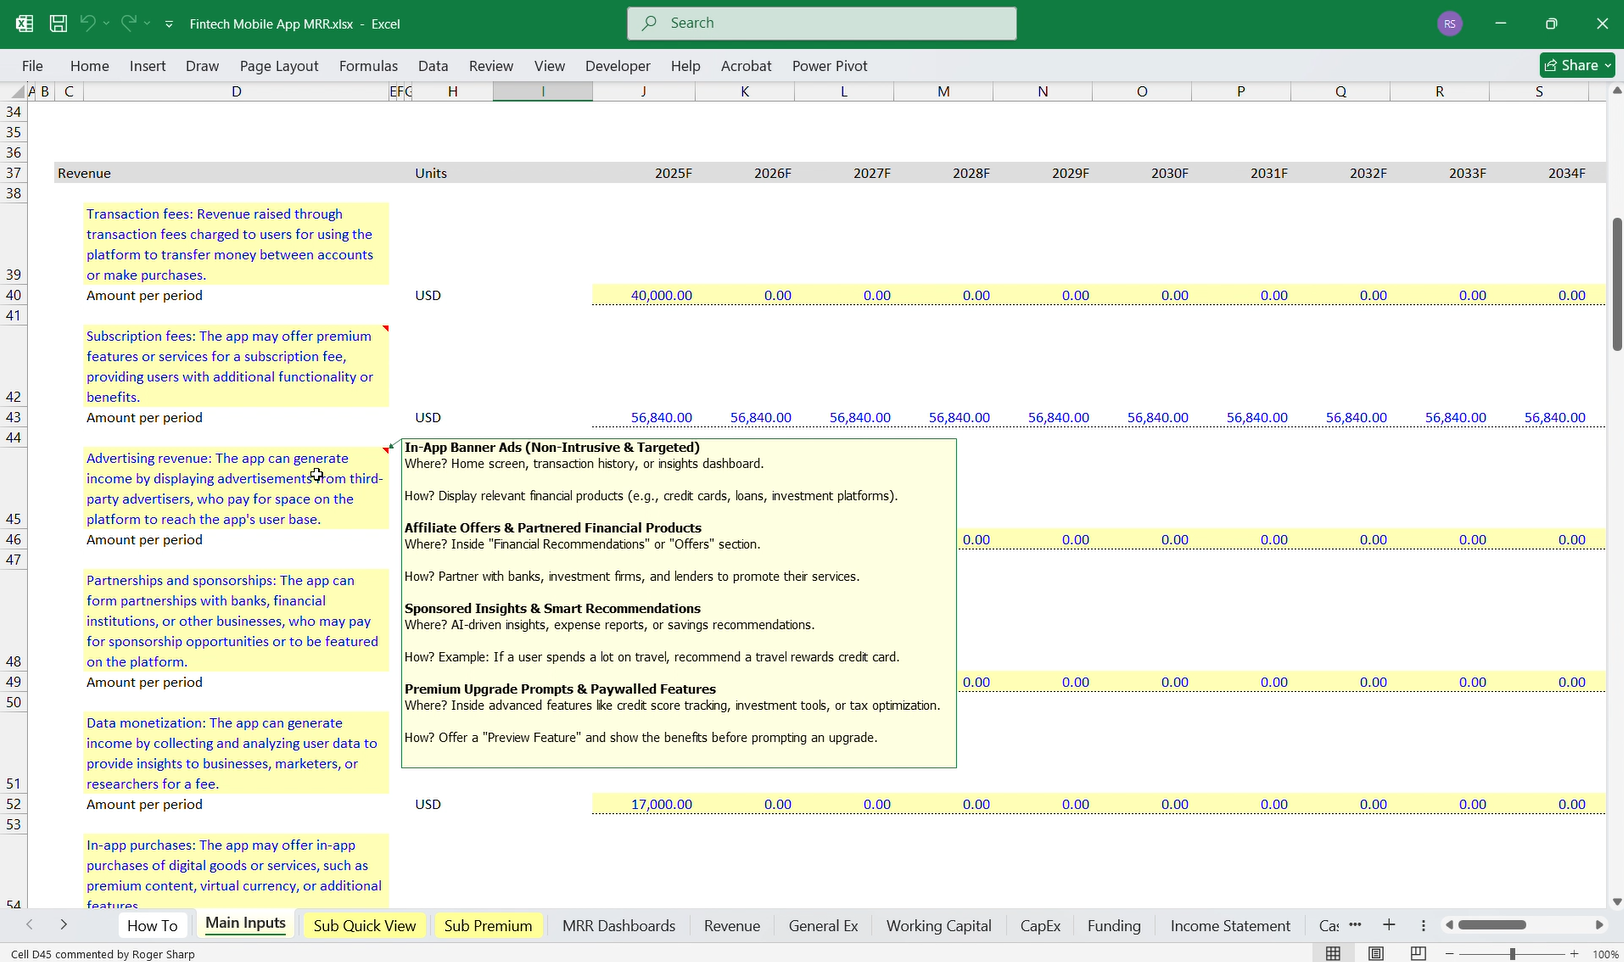
Revenue Streams
Operating Expenses
Non-Operating Items
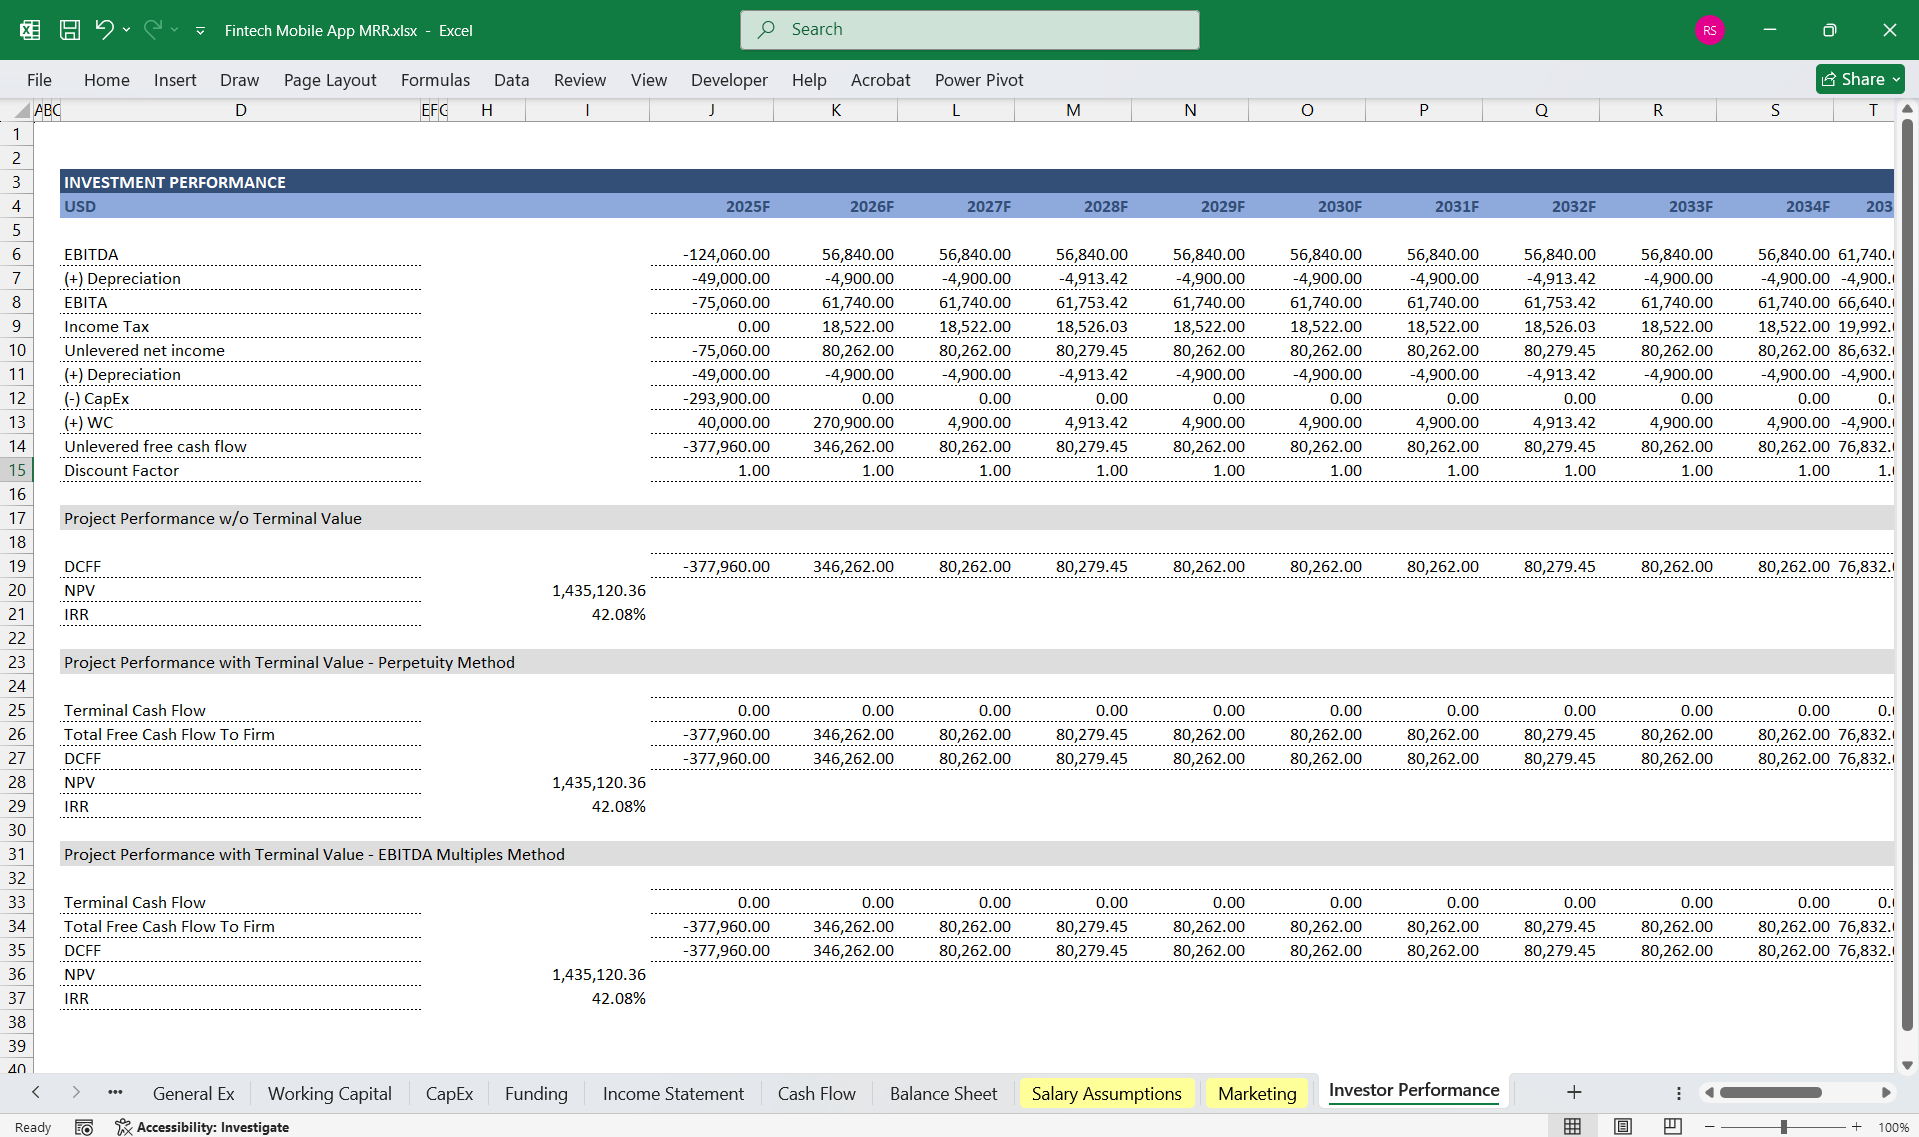
2. Cash Flow StatementThe cash flow statement categorizes cash movements into operating, investing, and financing activities.
Operating Cash Flow
Investing Cash Flow
Financing Cash Flow
Ending Cash Balance = Net Operating Cash Flow + Net Investing Cash Flow + Net Financing Cash Flow + Beginning Cash Balance
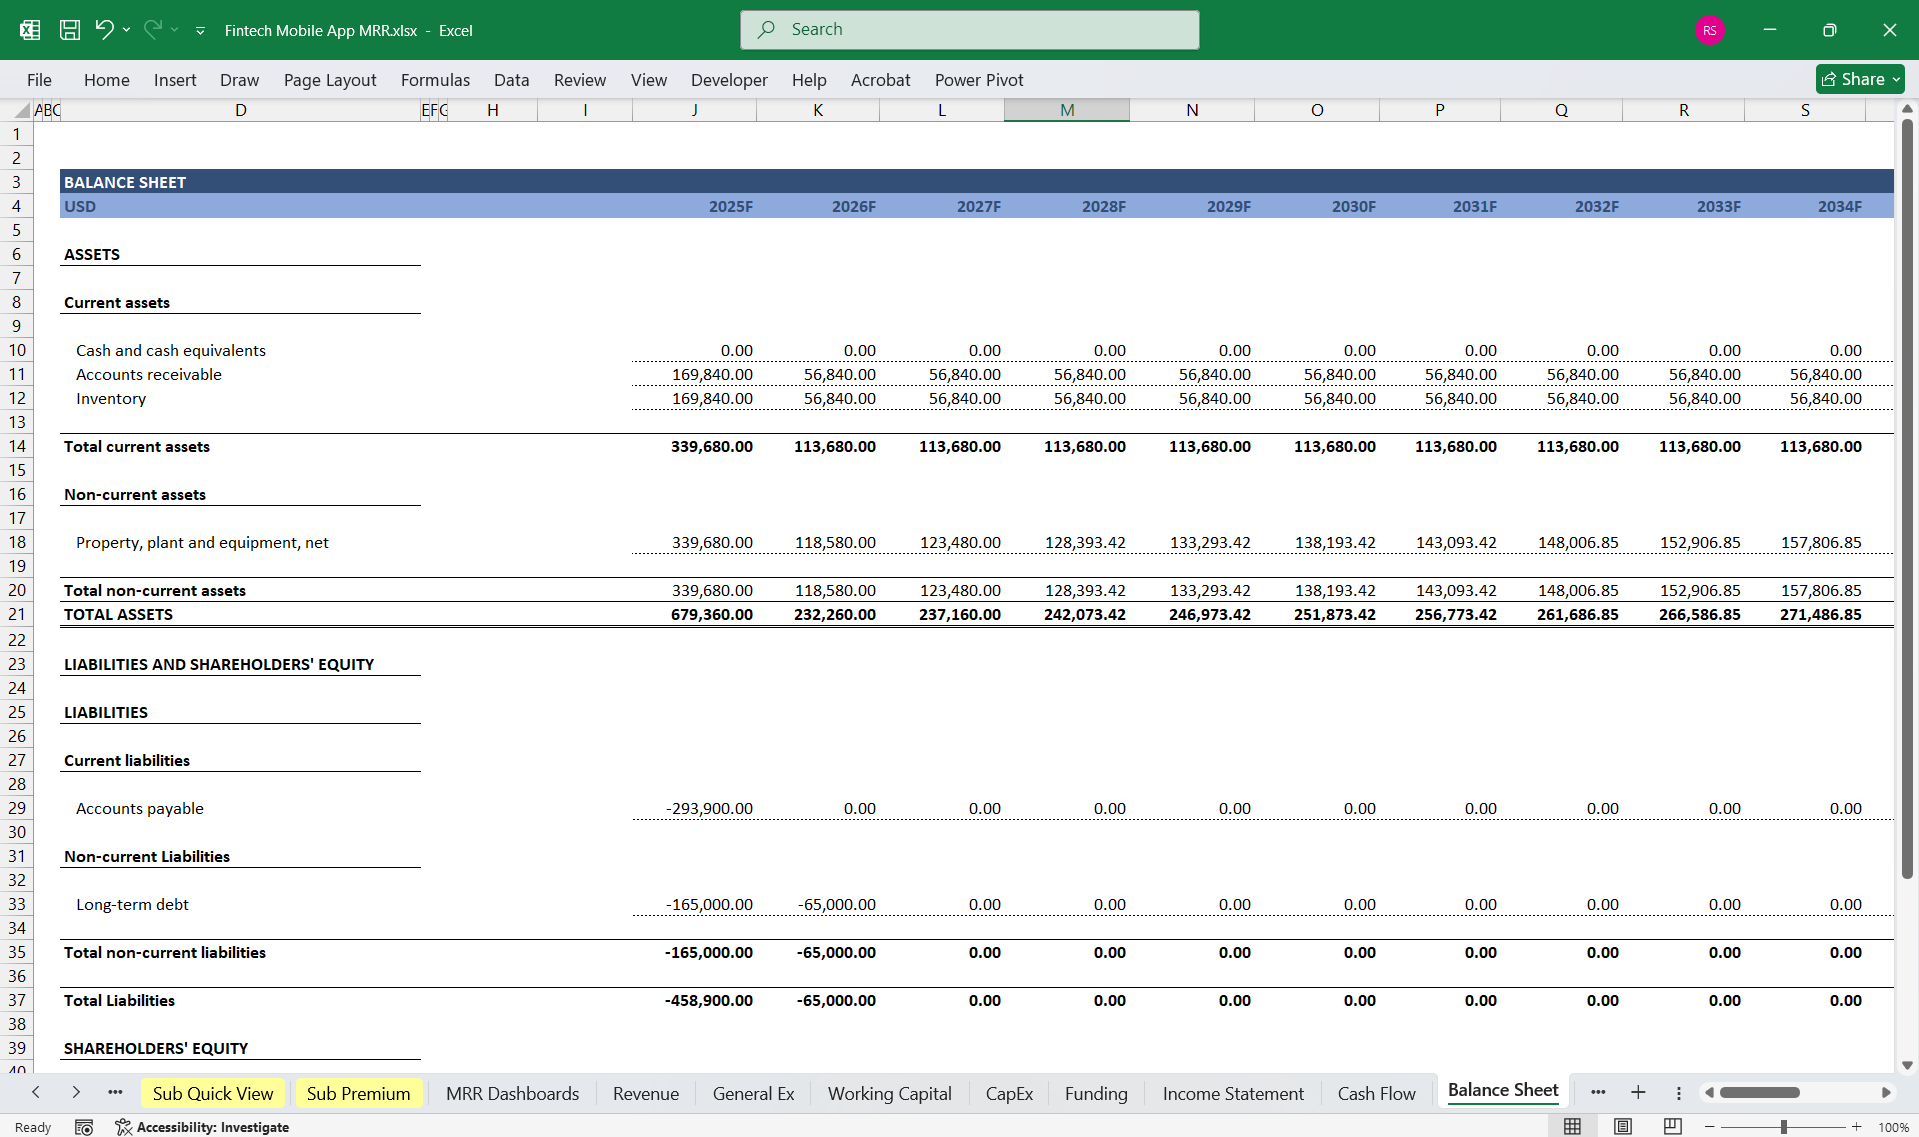
3. Balance SheetThe balance sheet provides a snapshot of the company's financial position.
AssetsCurrent Assets
Assets = Liabilities + Equity
Key Takeaways
3-Statement Financial Model for a Fintech App that covers the Income Statement, Cash Flow Statement, and Balance Sheet while incorporating multiple revenue streams.
Here’s a structured 6-tier subscription model for your Fintech Mobile App, designed to cater to different customer needs:
1. Free Tier (Basic)
- Features:
- View account balances
- Transaction history (last 30 days)
- Basic budgeting tools
- Limited customer support (email only)
- Ads displayed
- Target Audience: Casual users, students, or those exploring the app.
2. Starter Tier
- Everything in Free Tier +
- Unlimited transaction history
- Custom budget categories
- Basic financial insights & alerts
- Priority email support
- Remove ads
- Target Audience:** Individuals looking for basic money management tools.
3. Plus Tier
- Everything in Starter Tier +
- AI-powered financial insights
- Credit score tracking
- Bill reminders & automated savings suggestions
- Limited investment tracking
- Chat-based customer support
- Target Audience:** Users seeking a more advanced personal finance experience.
4. Premium Tier
- Everything in Plus Tier +
- Advanced investment tracking (stocks, crypto, real estate)
- Multi-account aggregation (connect multiple banks, PayPal, etc.)
- Fraud detection & alerts
- Smart financial goal-setting tools
- Phone support with financial advisors (limited to 2 sessions/month)
- Target Audience:** Serious budgeters & early investors.
5. Pro Tier
- Everything in Premium Tier +
- Personalized AI-driven investment recommendations
- Tax optimization insights
- Advanced credit analysis & improvement tips
- International currency tracking
- Unlimited access to financial advisors (via chat & phone)
- Target Audience:** High-income professionals & investors.
6. Elite Tier
- Everything in Pro Tier +
- Dedicated financial advisor (1:1 support)
- Exclusive investment opportunities (private equity, pre-IPOs, etc.)
- Advanced tax planning with CPA integration
- Custom financial reports & wealth management tools
- Priority 24/7 concierge support
- Target Audience:** High-net-worth individuals & financial power users.
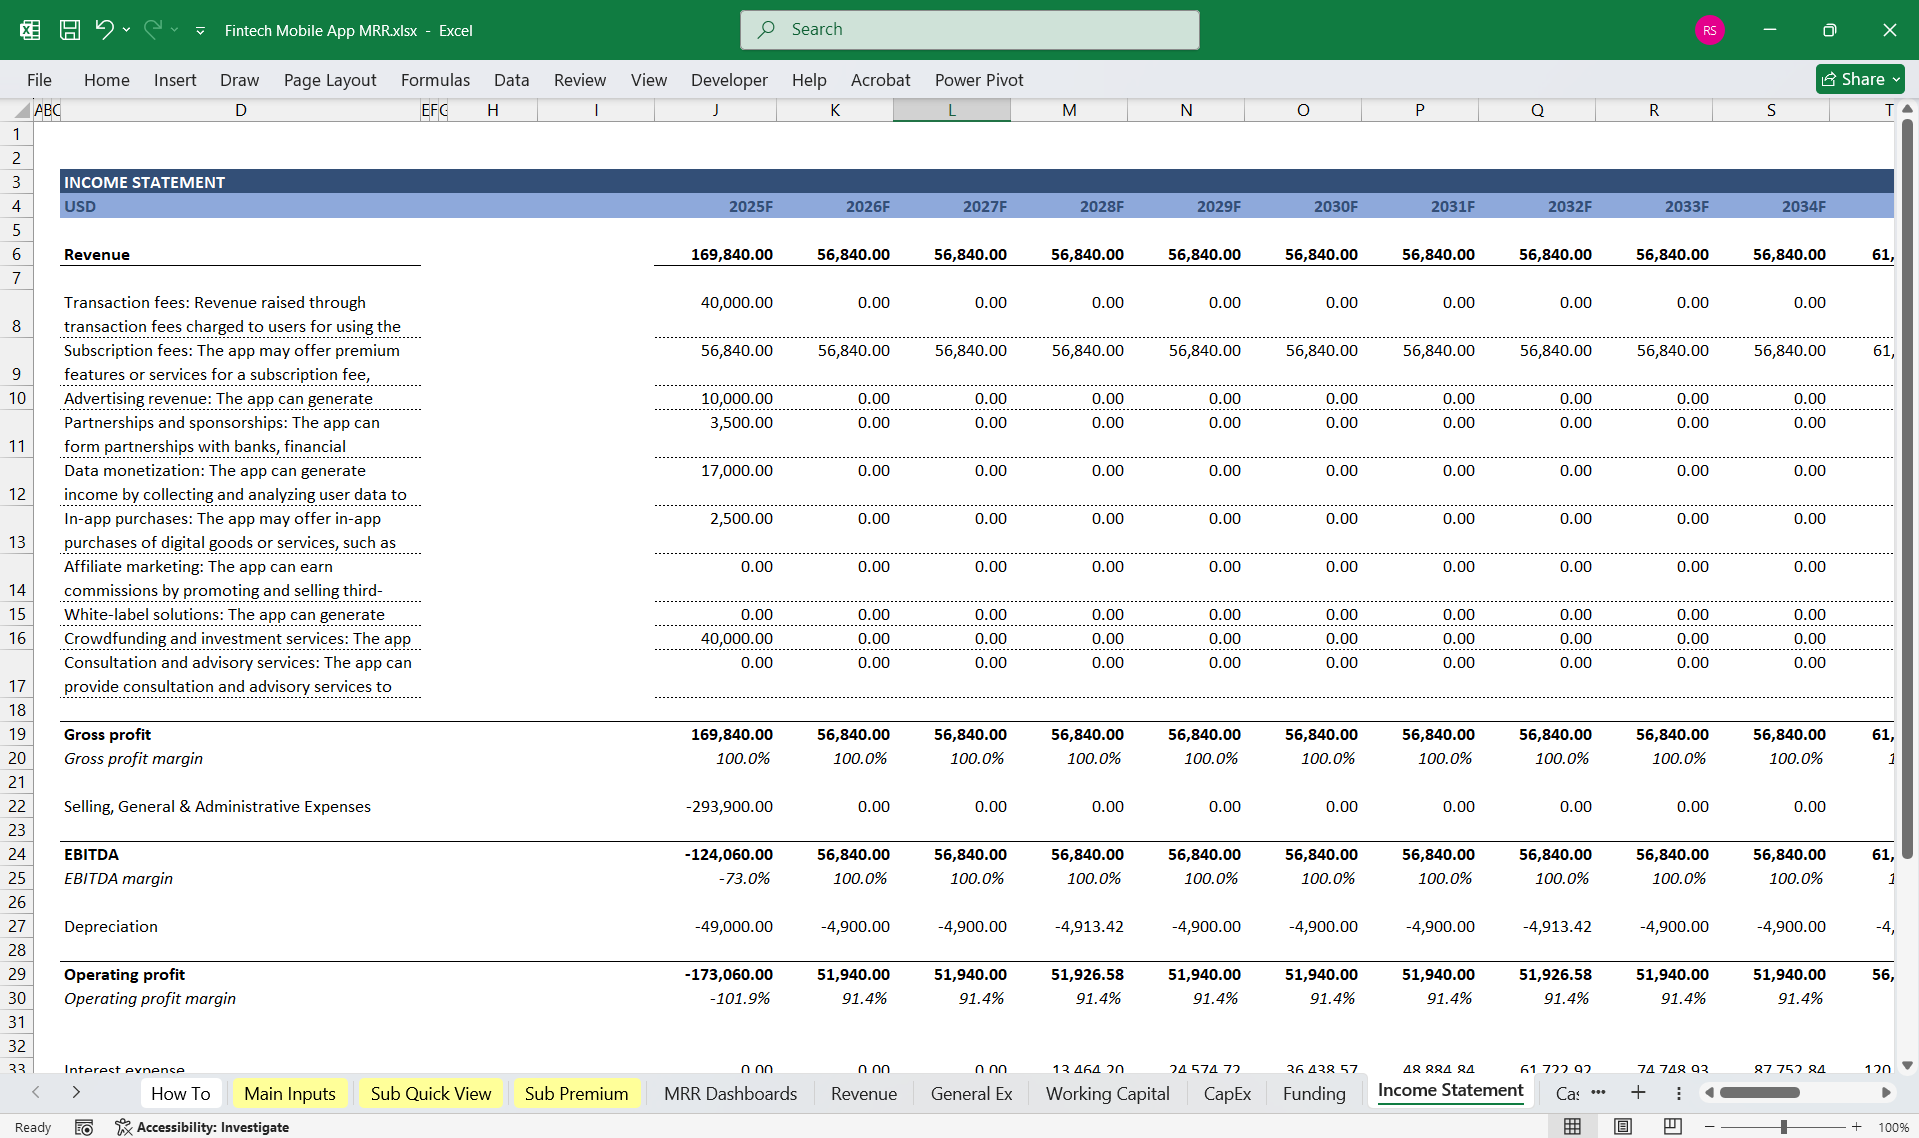
1. Income StatementThe income statement outlines the company's financial performance, focusing on revenue, expenses, and profitability.
Revenue Streams
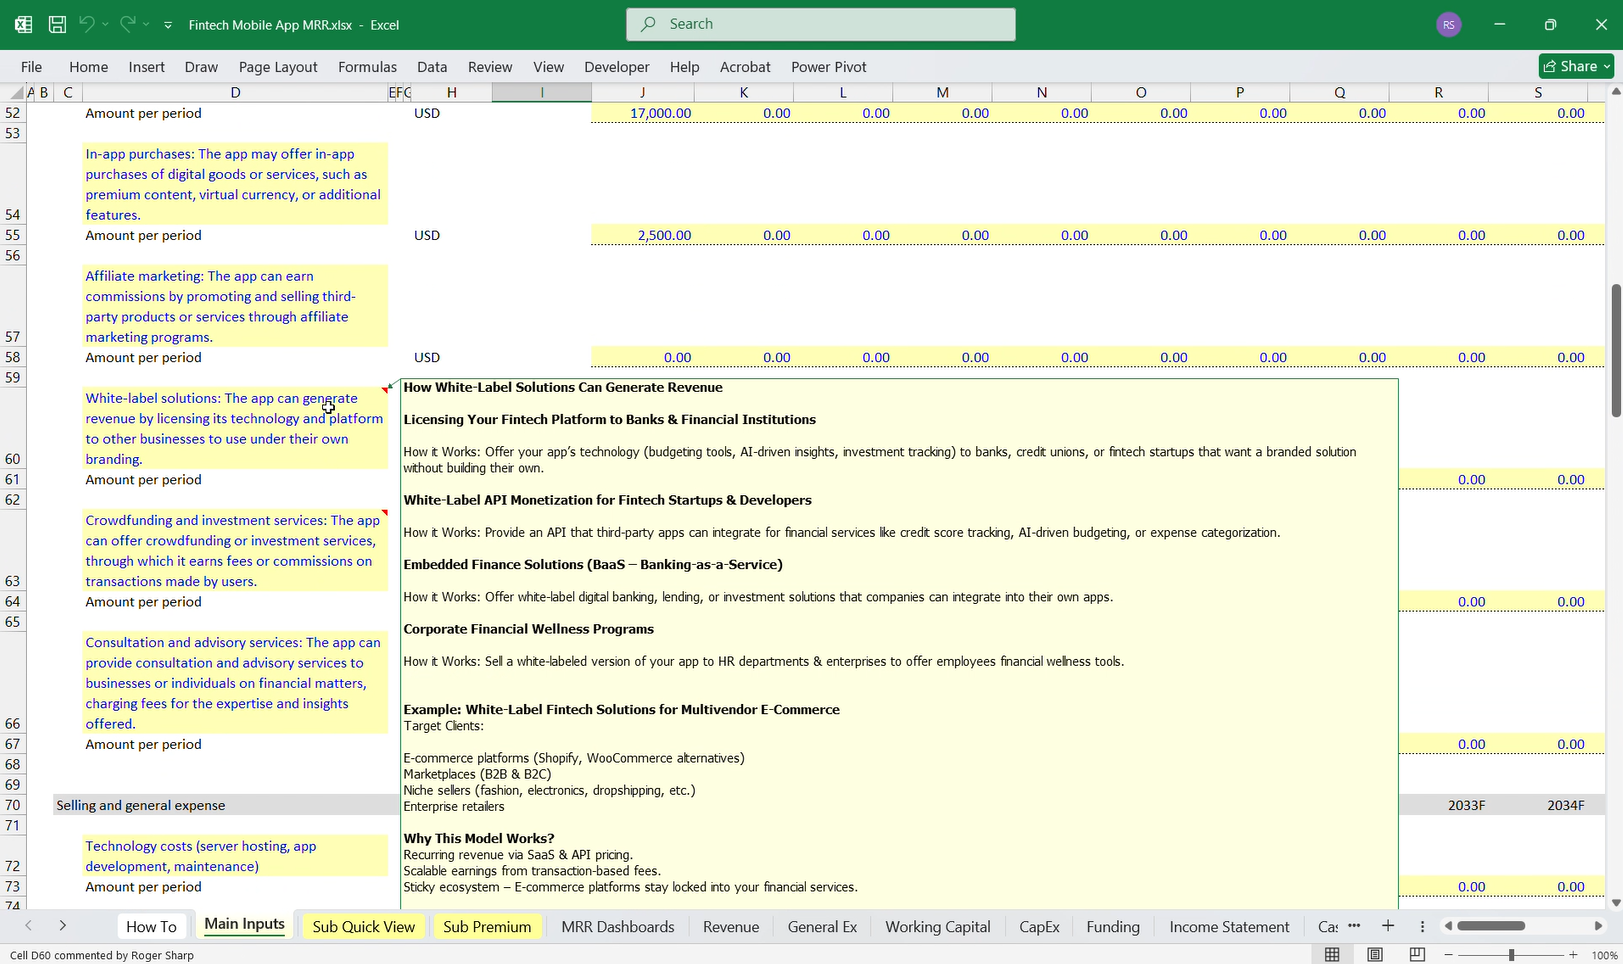
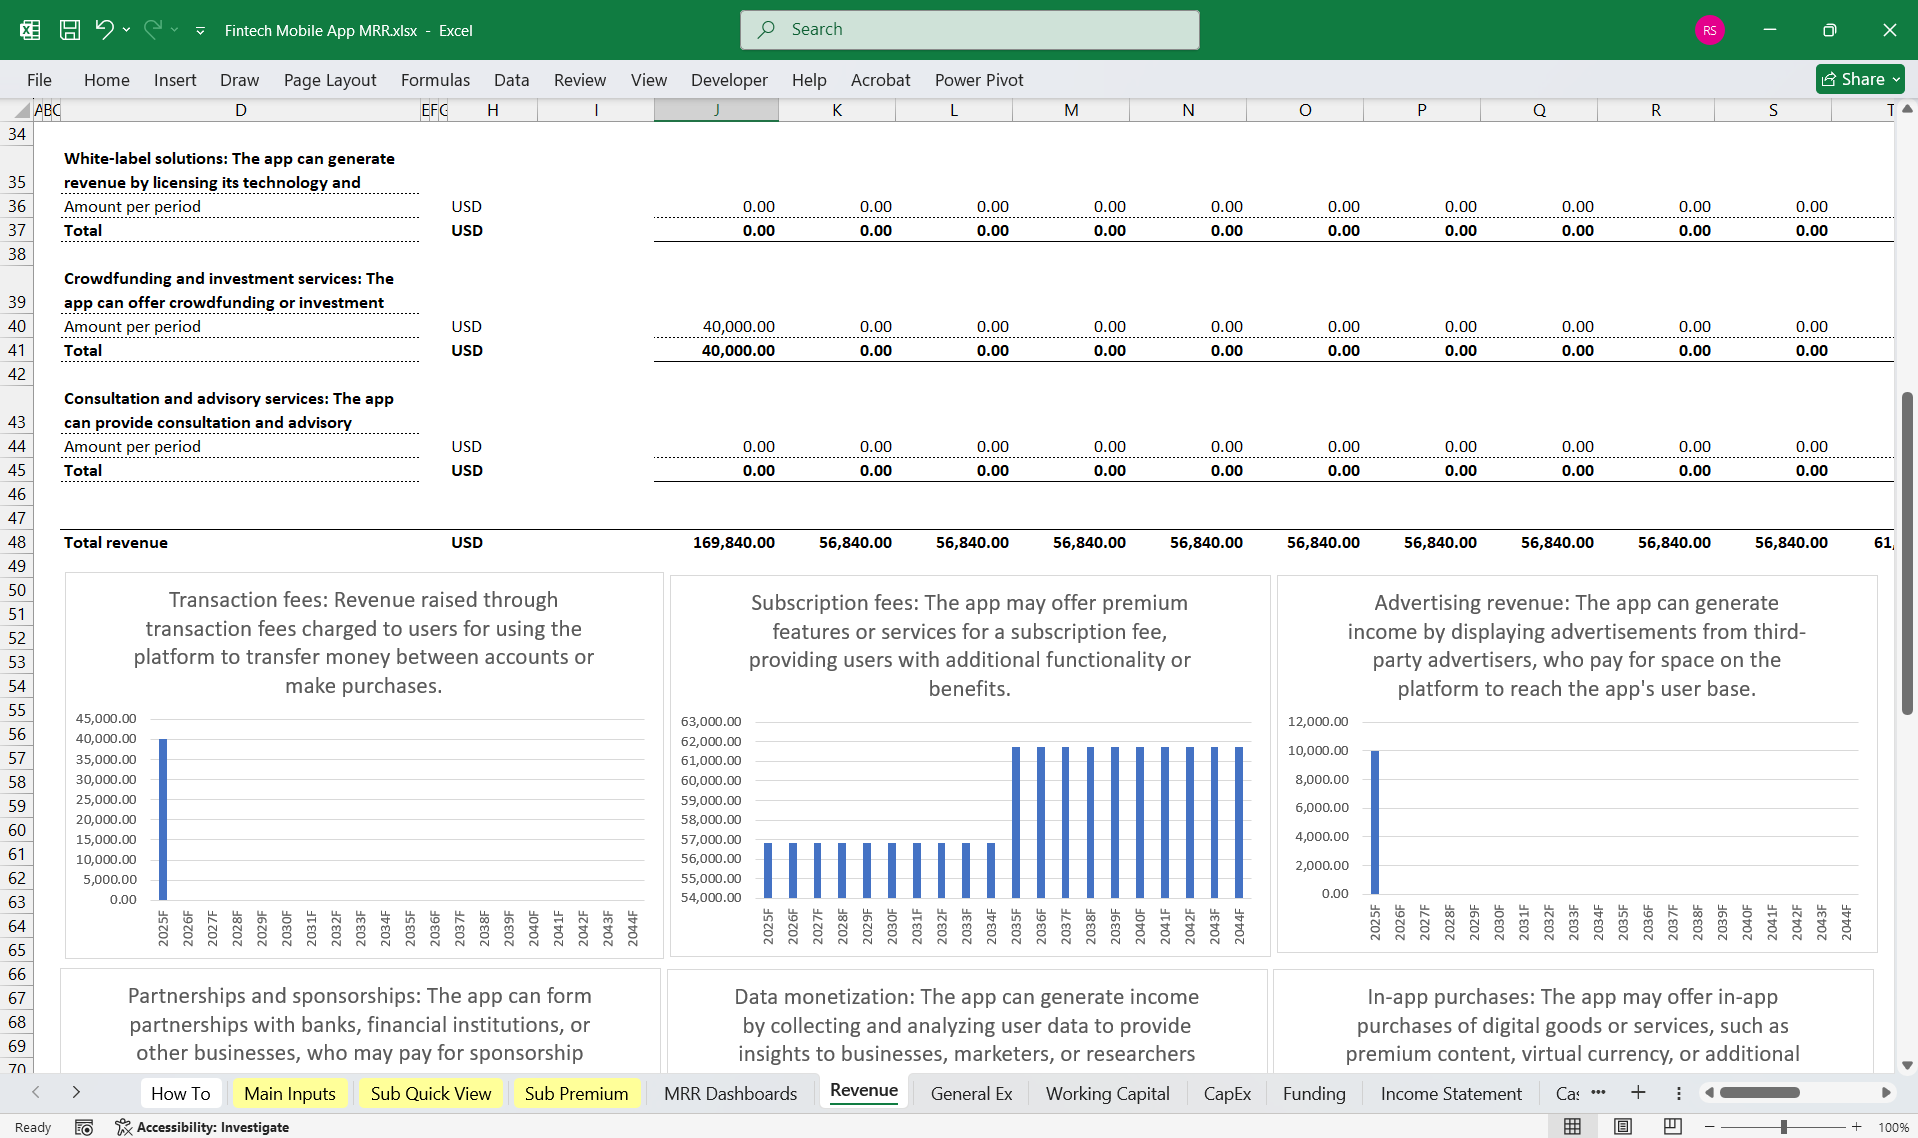
- Subscription Fees – Recurring revenue from users subscribing to the app for premium features or access.
- Transaction Revenue Sharing – A percentage of fees from financial transactions processed through the platform.
- Advertising Revenue – Income from ads displayed within the app (e.g., banners, sponsored content).
- Partnerships & Sponsorships – Revenue from collaborations with financial institutions, brands, or other fintech firms.
- Data Monetization – Revenue from anonymized user data insights sold to third parties.
- Affiliate Marketing – Commissions earned by directing users to partner financial products (e.g., credit cards, loans).
- White-Label Solutions – Revenue from selling the app’s technology to other businesses under a different brand.
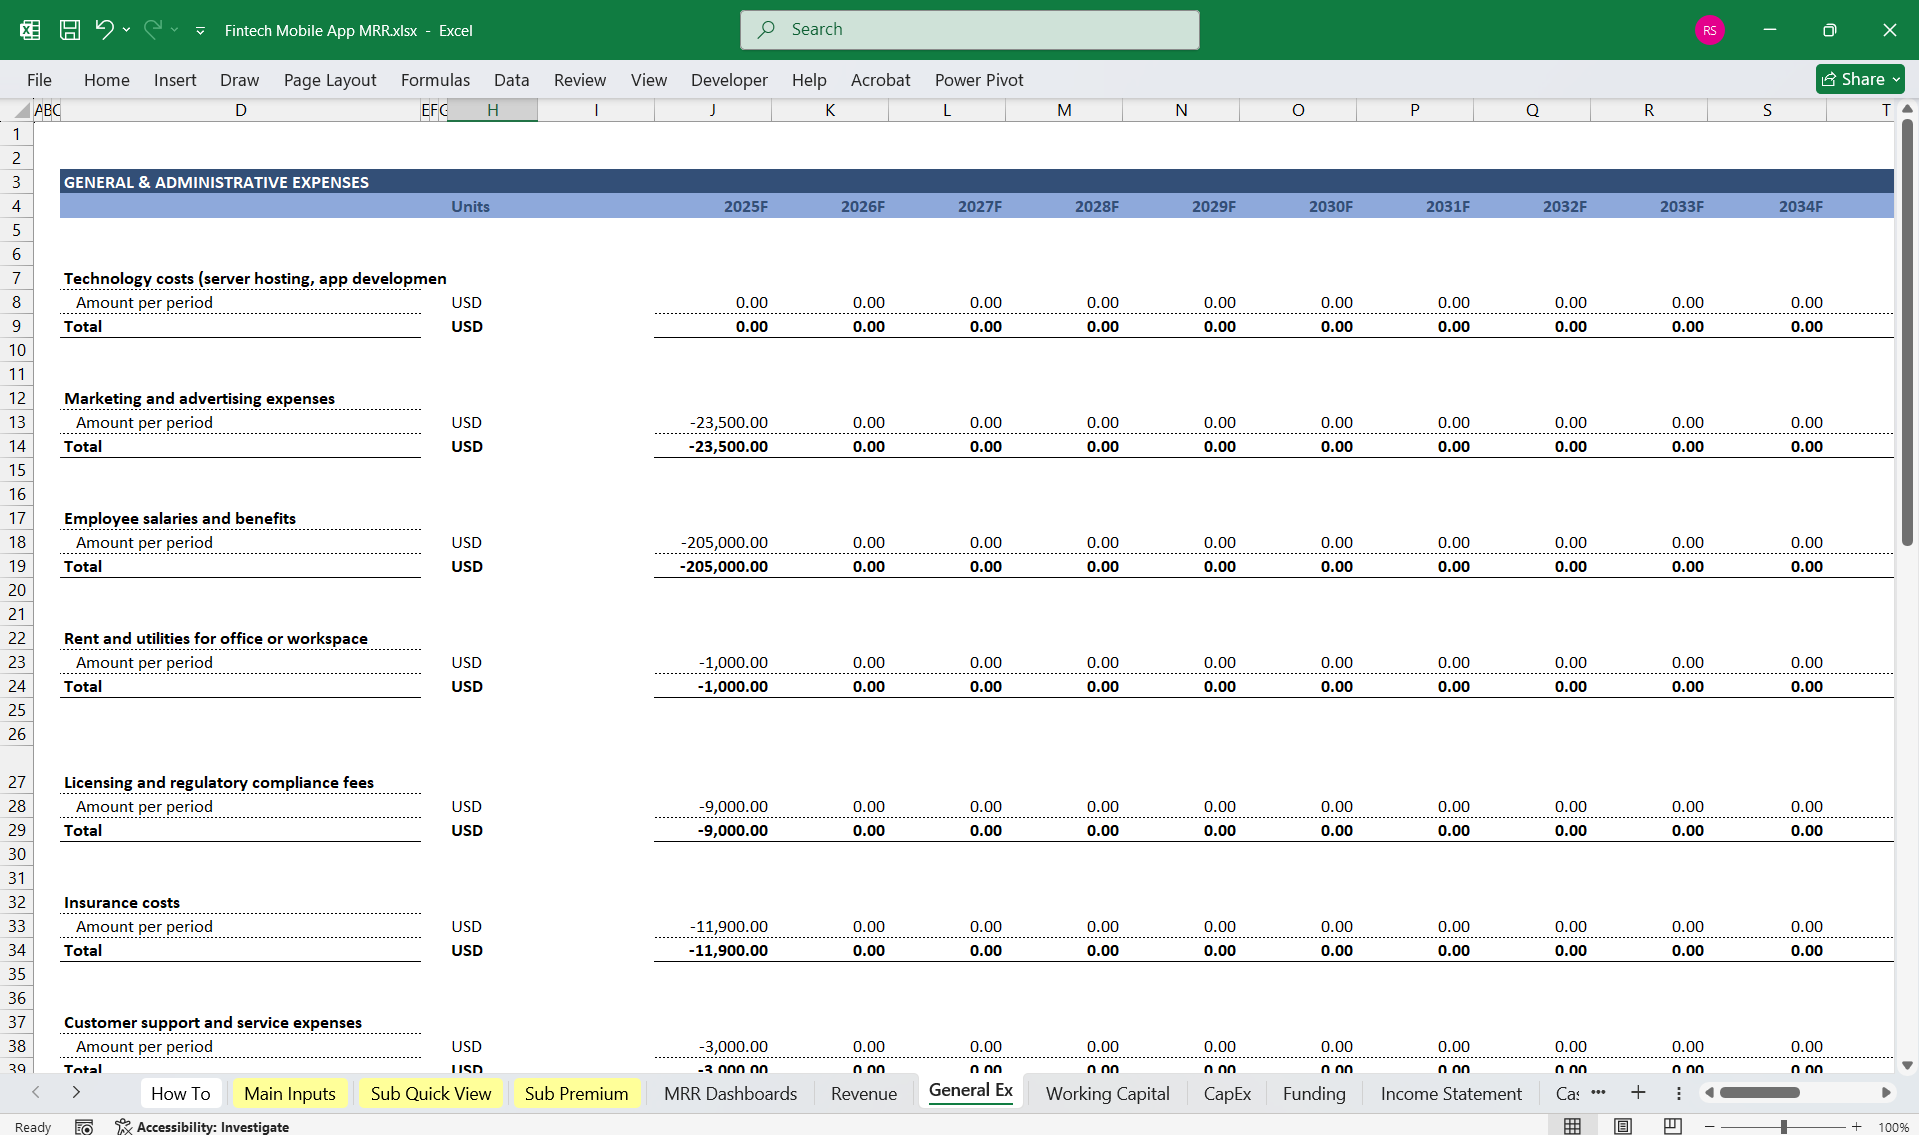
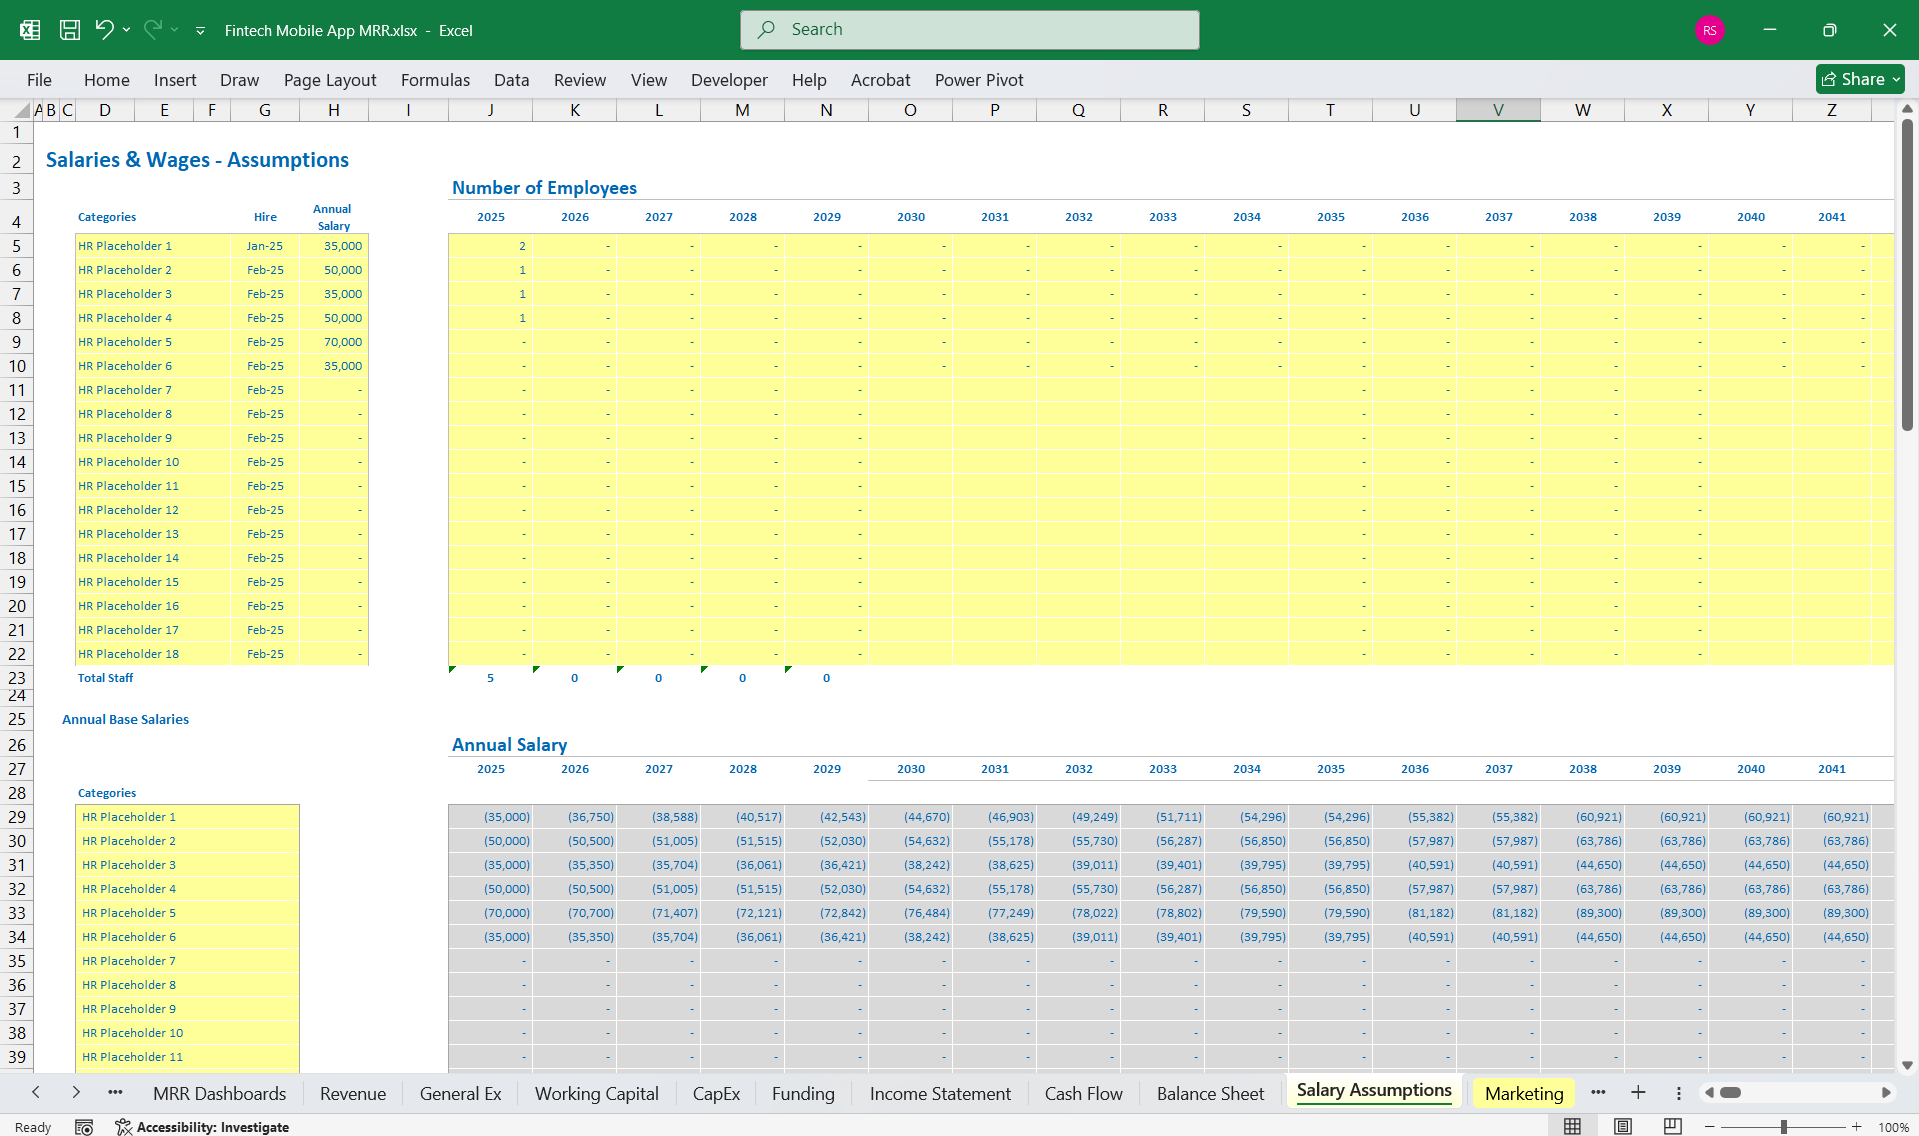
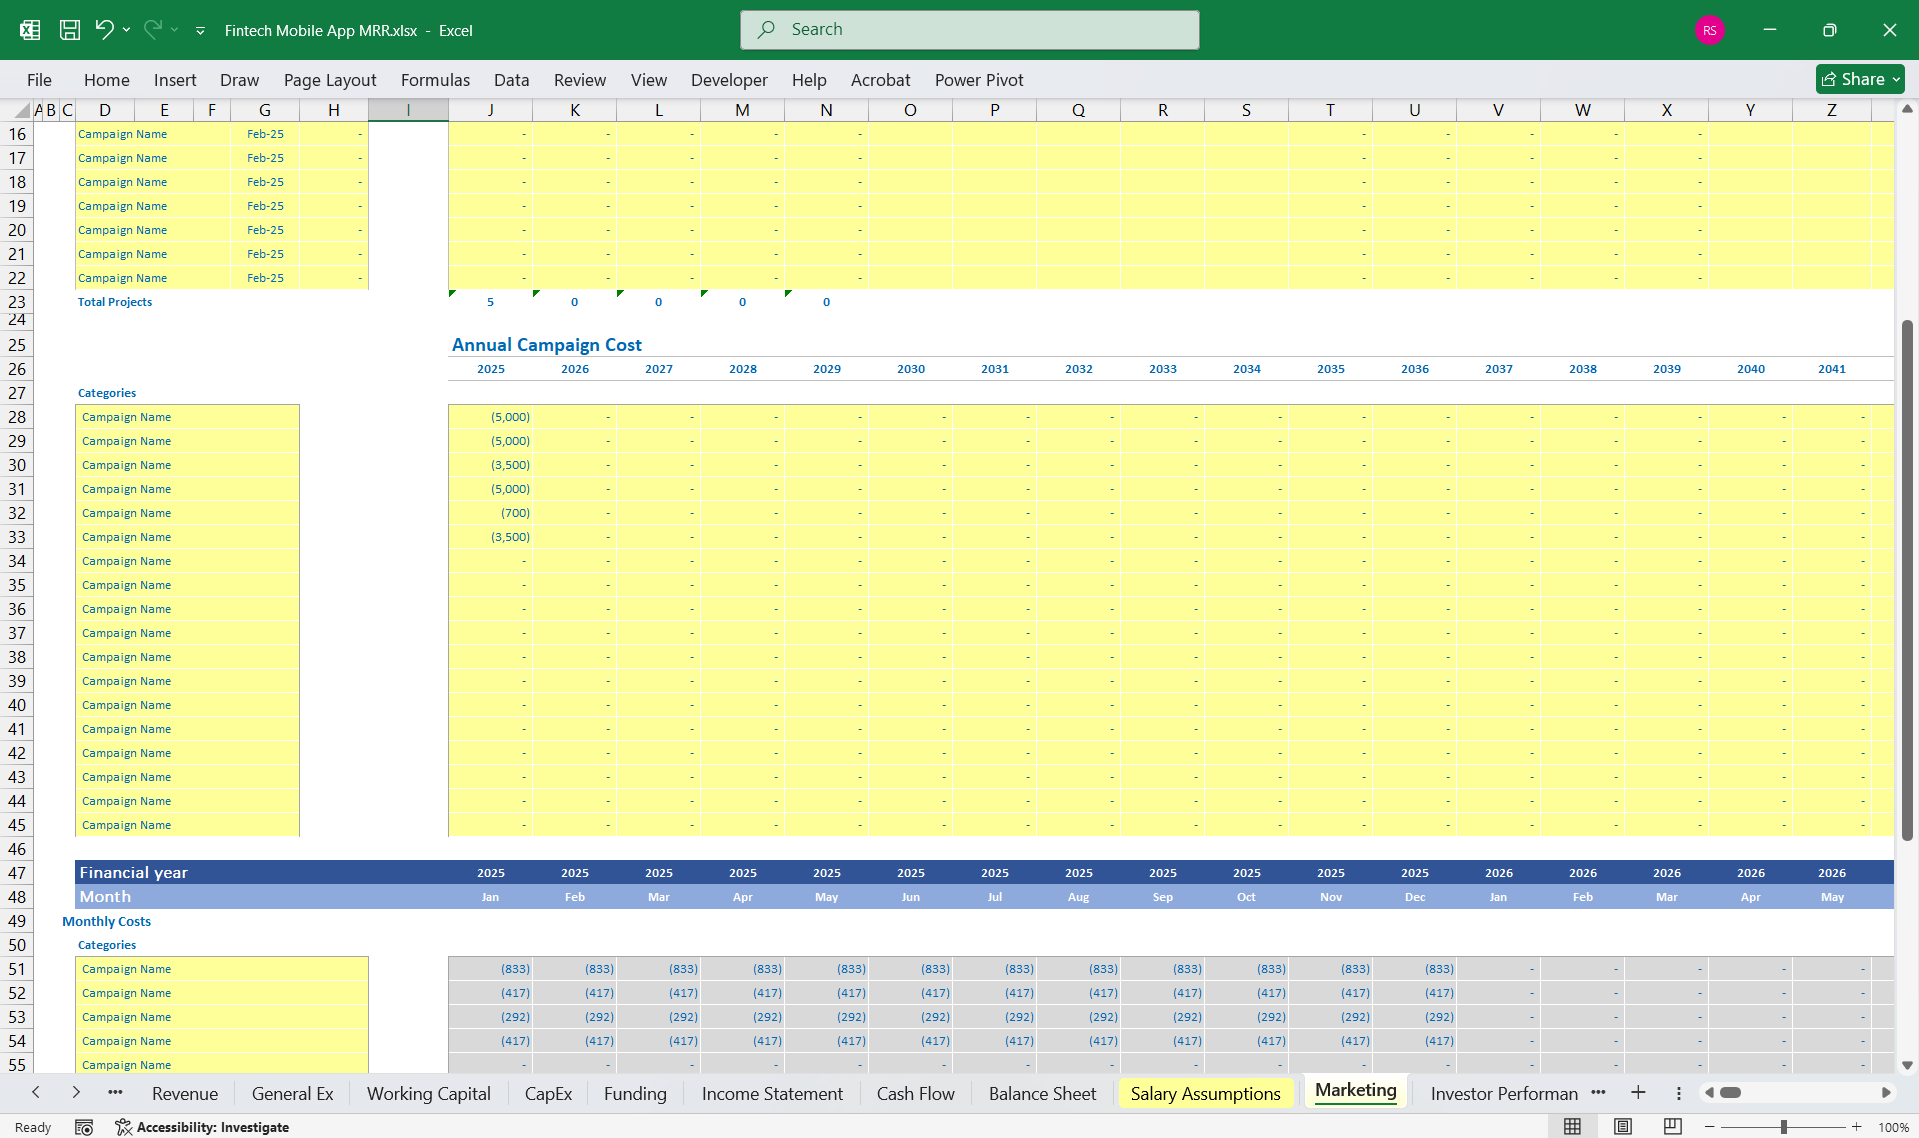
Operating Expenses
- Cost of Goods Sold (COGS) – Direct costs related to payment processing and third-party API fees.
- Sales & Marketing Expenses – User acquisition costs, advertising, influencer partnerships.
- Research & Development (R&D) – Software development, AI enhancements, security improvements.
- General & Administrative (G&A) – Salaries, office expenses, legal, compliance costs.
- Technology & Infrastructure – Cloud hosting, data storage, cybersecurity costs.
- Customer Support & Compliance – Call centers, regulatory compliance team expenses.
Non-Operating Items
- Depreciation & Amortization – Software development cost amortization.
- Interest Expenses – Loans or financing costs.
- Taxes – Corporate income tax.
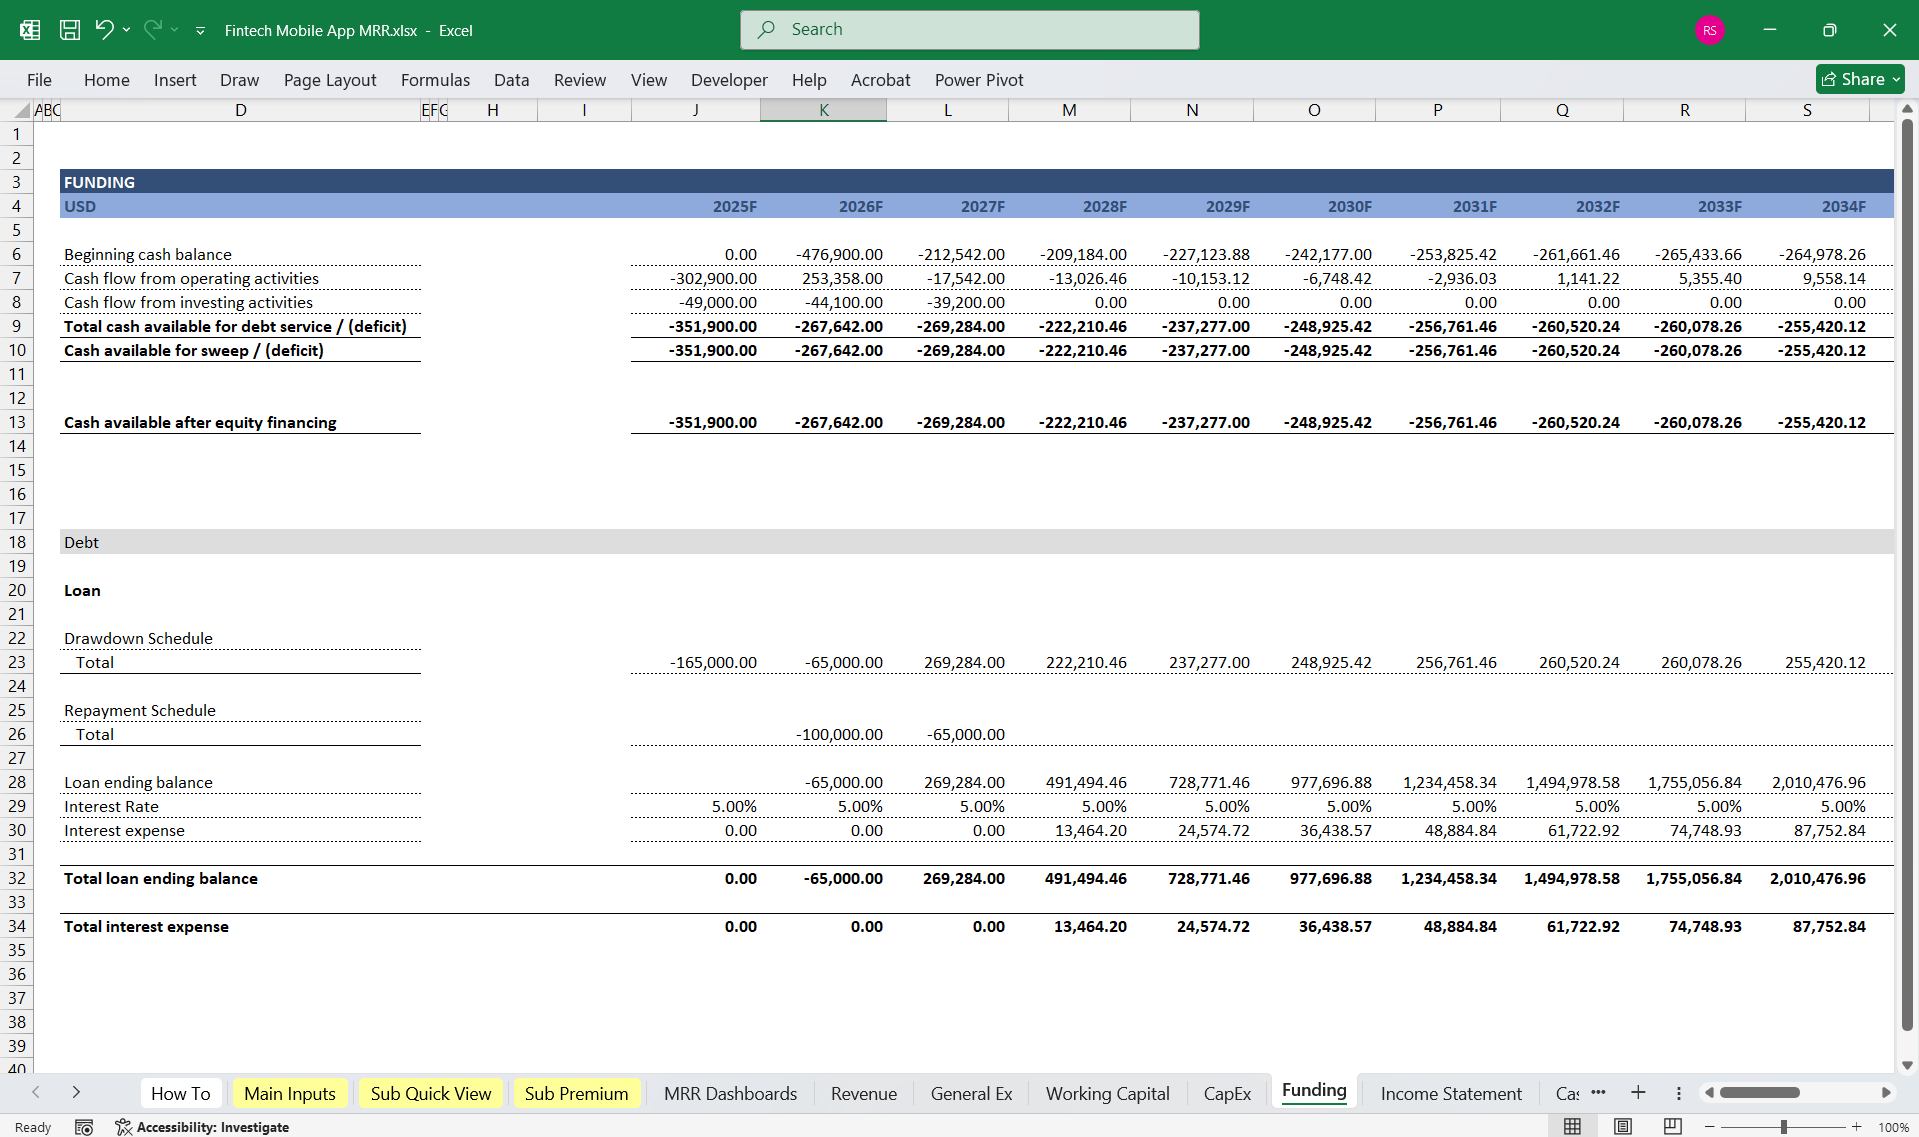
2. Cash Flow StatementThe cash flow statement categorizes cash movements into operating, investing, and financing activities.
Operating Cash Flow
- Cash Receipts from Revenue Streams (subscriptions, transactions, ads, partnerships).
- Cash Payments for Operating Expenses (marketing, salaries, infrastructure).
- Adjustments for Non-Cash Items (depreciation, stock-based compensation).
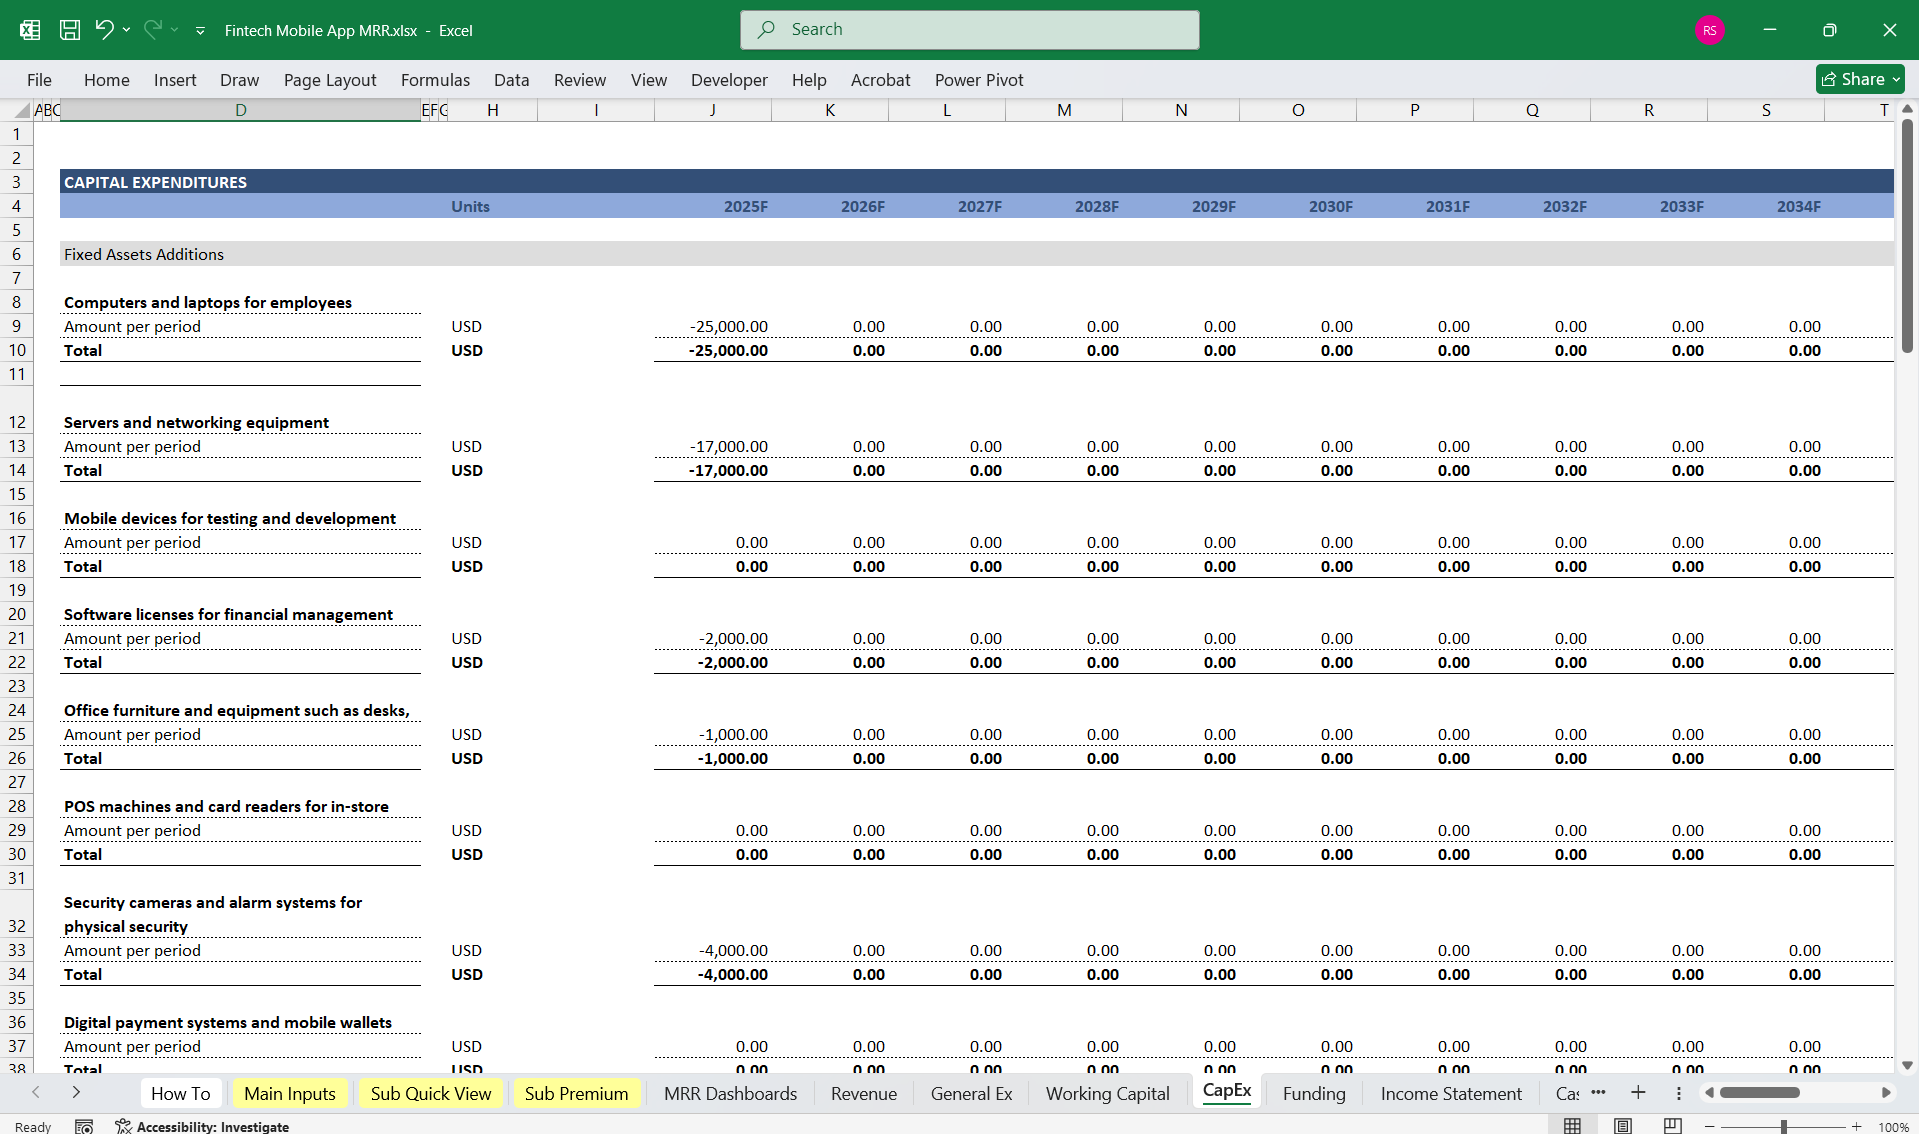
Investing Cash Flow
- Capital Expenditures (CapEx) – Development of app features, and security enhancements.
- Acquisitions or Investments – Purchasing complementary fintech startups or assets.
- Investment in R&D – AI-powered features, fraud detection.
Financing Cash Flow
- Equity Financing – Funds raised from investors.
- Debt Financing – Loans or credit lines.
- Dividends/Buybacks – Payments to shareholders if applicable.
Ending Cash Balance = Net Operating Cash Flow + Net Investing Cash Flow + Net Financing Cash Flow + Beginning Cash Balance
3. Balance SheetThe balance sheet provides a snapshot of the company's financial position.
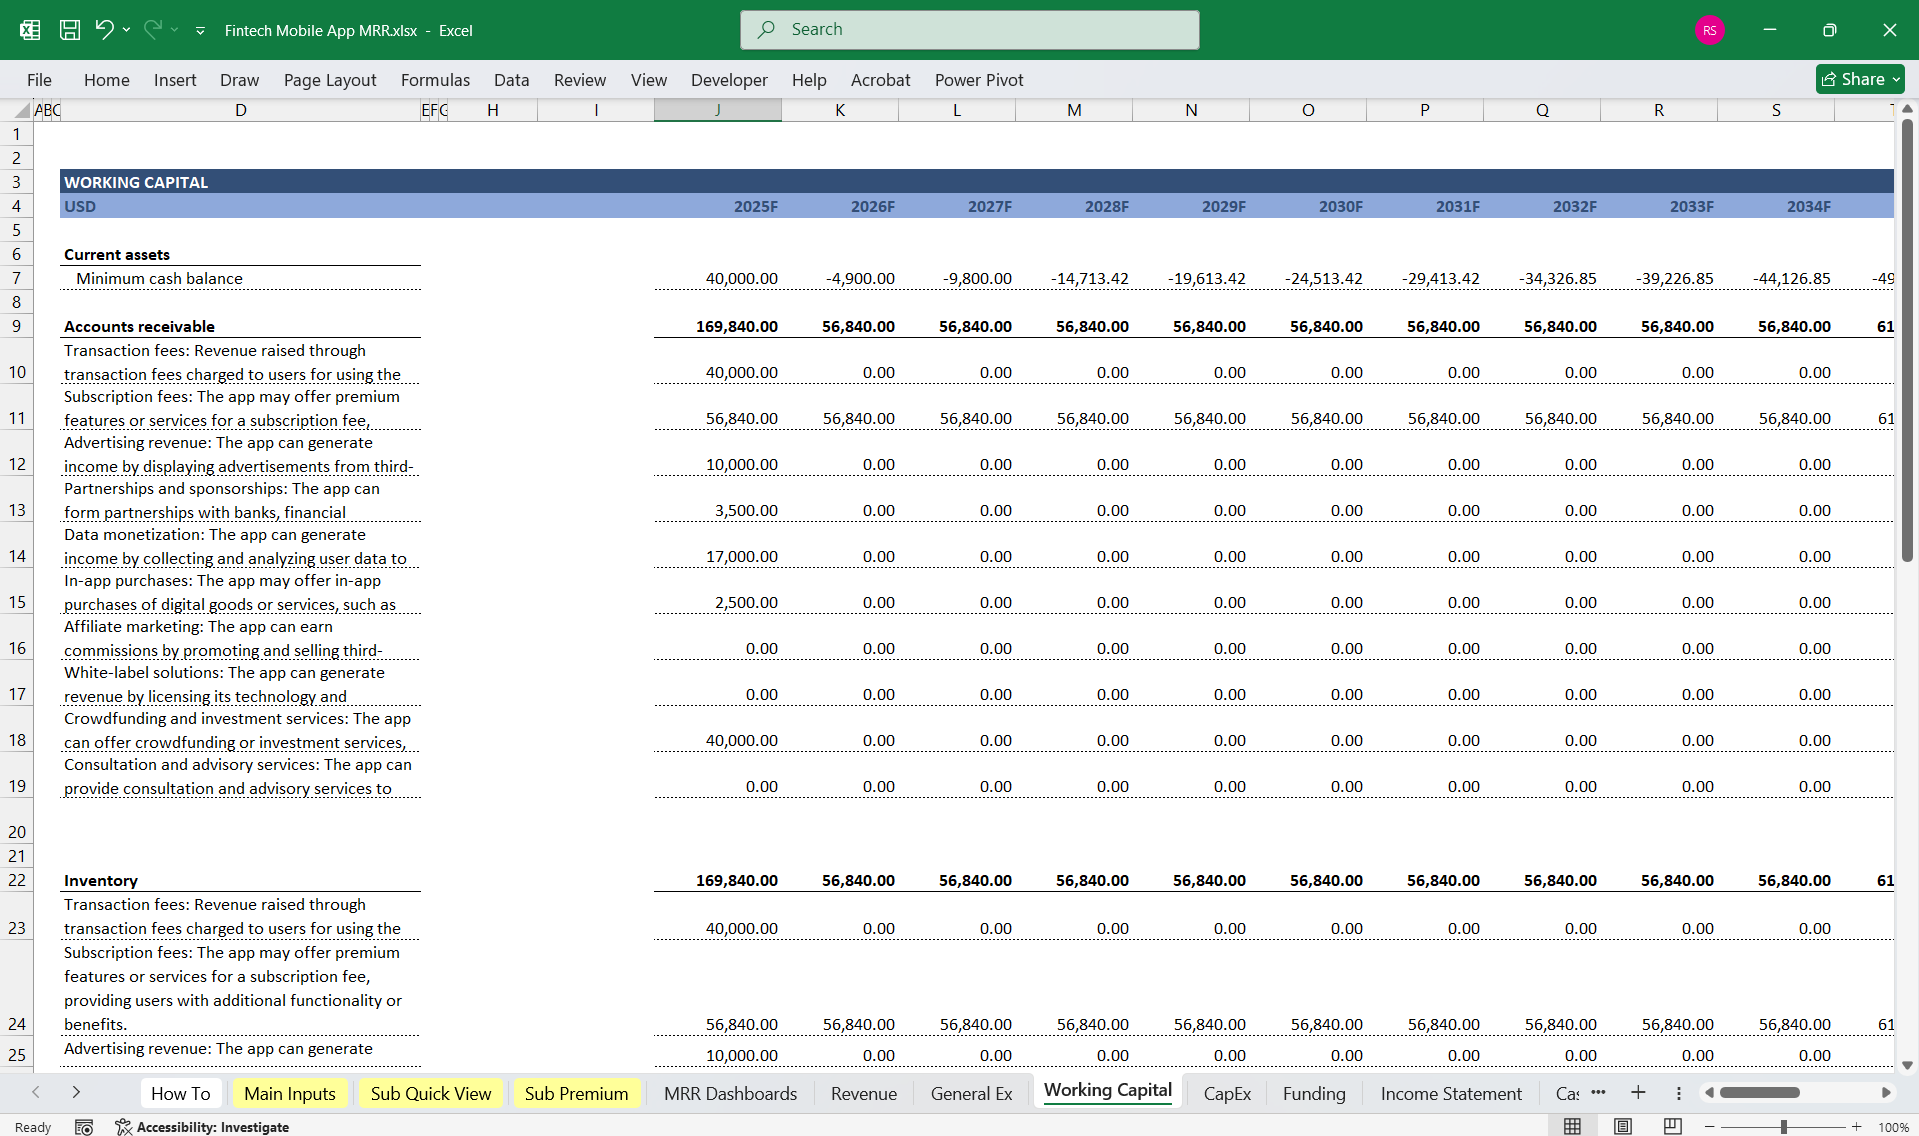
AssetsCurrent Assets
- Cash & Cash Equivalents – Money in the bank.
- Accounts Receivable – Outstanding revenue from partnerships and subscriptions.
- Prepaid Expenses – Paid but not yet incurred costs (e.g., prepaid software licenses).
- Intangible Assets – Software development costs, patents.
- Property, Plant & Equipment (PP&E) – Server infrastructure, office equipment.
- Accounts Payable – Unpaid operating expenses.
- Deferred Revenue – Subscription fees received in advance.
- Short-Term Debt – Loan repayments due within 12 months.
- Long-Term Debt – Loans or bonds payable beyond one year.
- Common Stock – Investor funding.
- Retained Earnings – Profits reinvested into the business.
Assets = Liabilities + Equity
Key Takeaways
- The Income Statement shows revenue growth and profitability.
- The Cash Flow Statement tracks liquidity and cash movements.
- The Balance Sheet reflects financial health and company value.
This Best Practice includes
1 Excel File
Further information
Provides thorough oversight, tracking, and reporting of Fintech Mobile App finances, including budget utilisation and projections updates.
