
Originally published: 16/01/2025 13:47
Publication number: ELQ-51315-1
View all versions & Certificate
Publication number: ELQ-51315-1
View all versions & Certificate

Agricultural (Farming) & Forestry Machinery Manufacturer Finance Model
Comprehensive editable, 5-year 3-statement MS Excel spreadsheet for tracking an Agricultural & Forestry Machinery Manufacturer's finances.
AllFinancialModels offer a curated selection of high-quality yet financial model templates designed to support a wide range of business needs.Follow
agricultureforestry machineryfarmingmanufacturermachineryexcelfinancefinancial modelagriculturalmanufacturing
Description
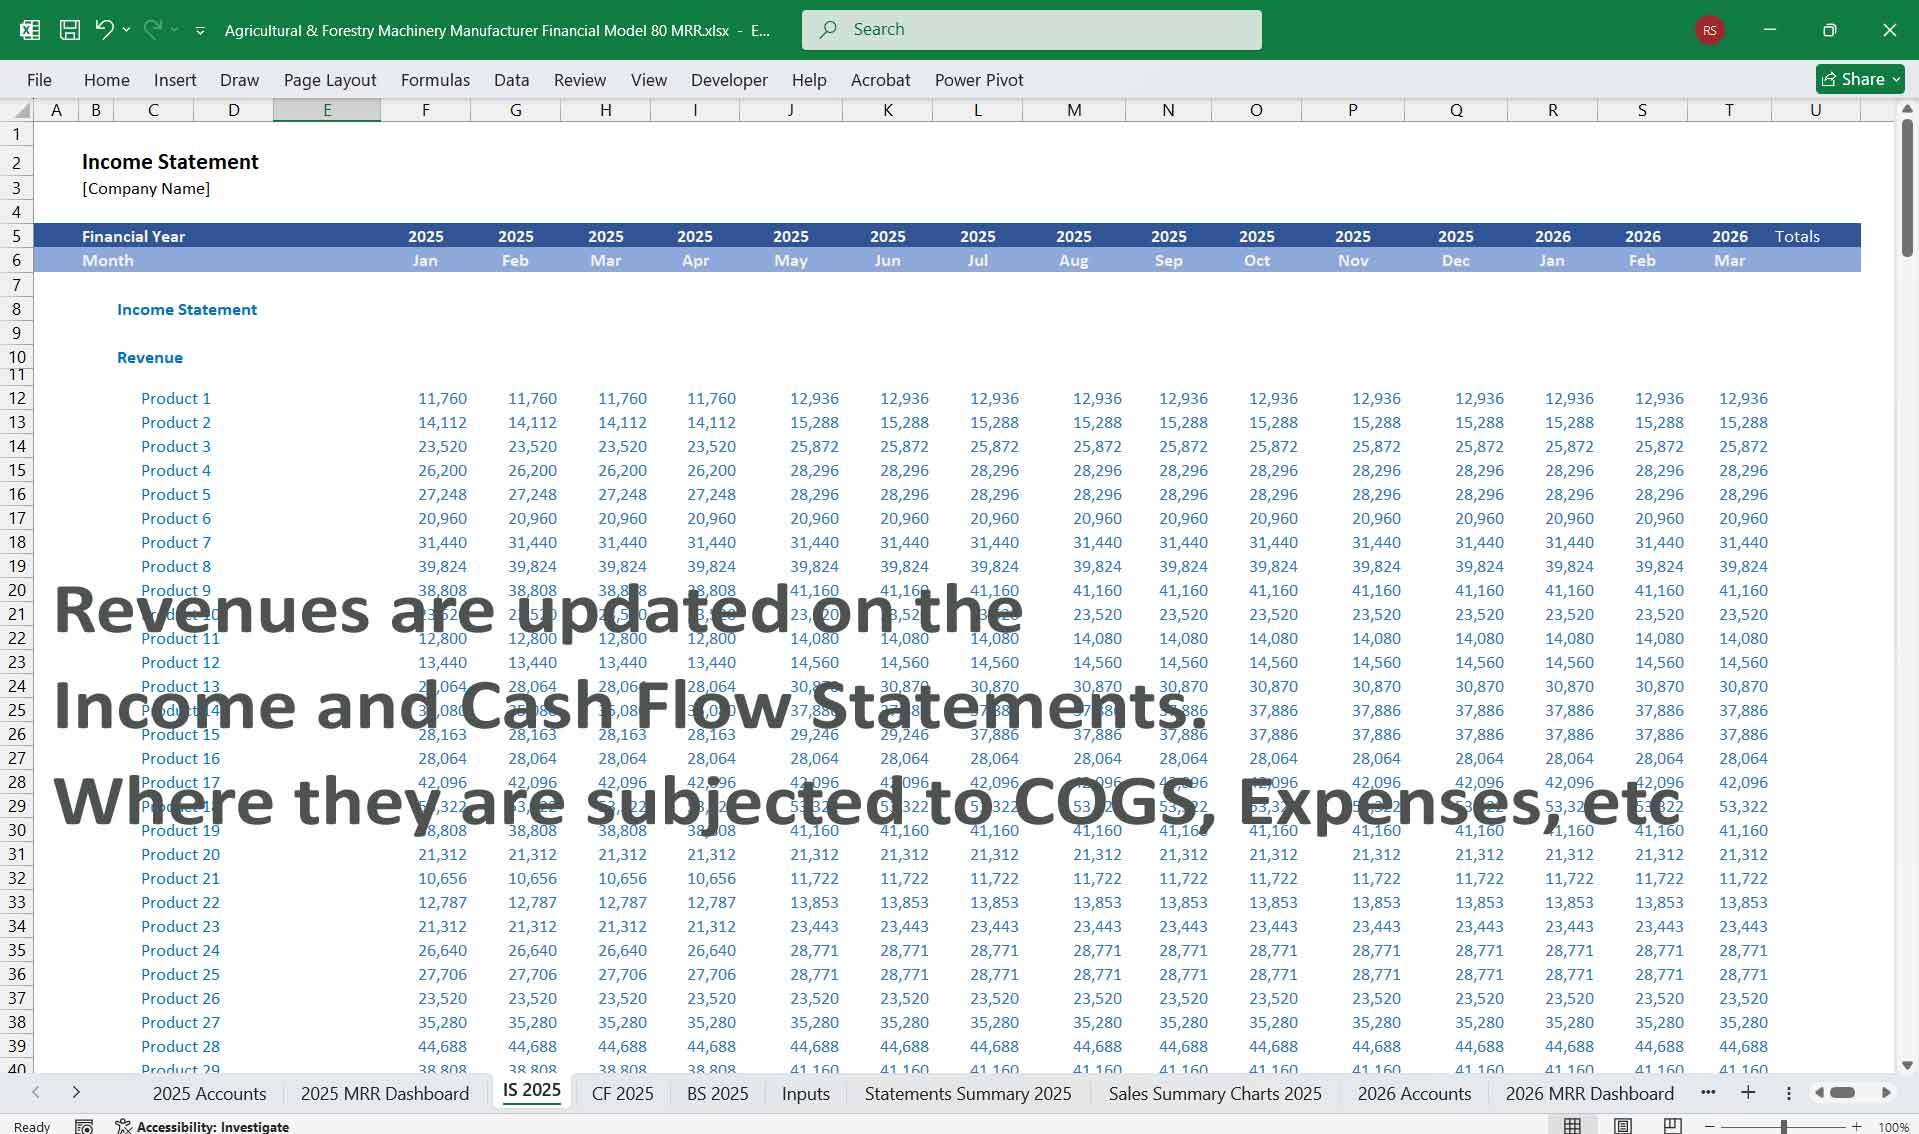
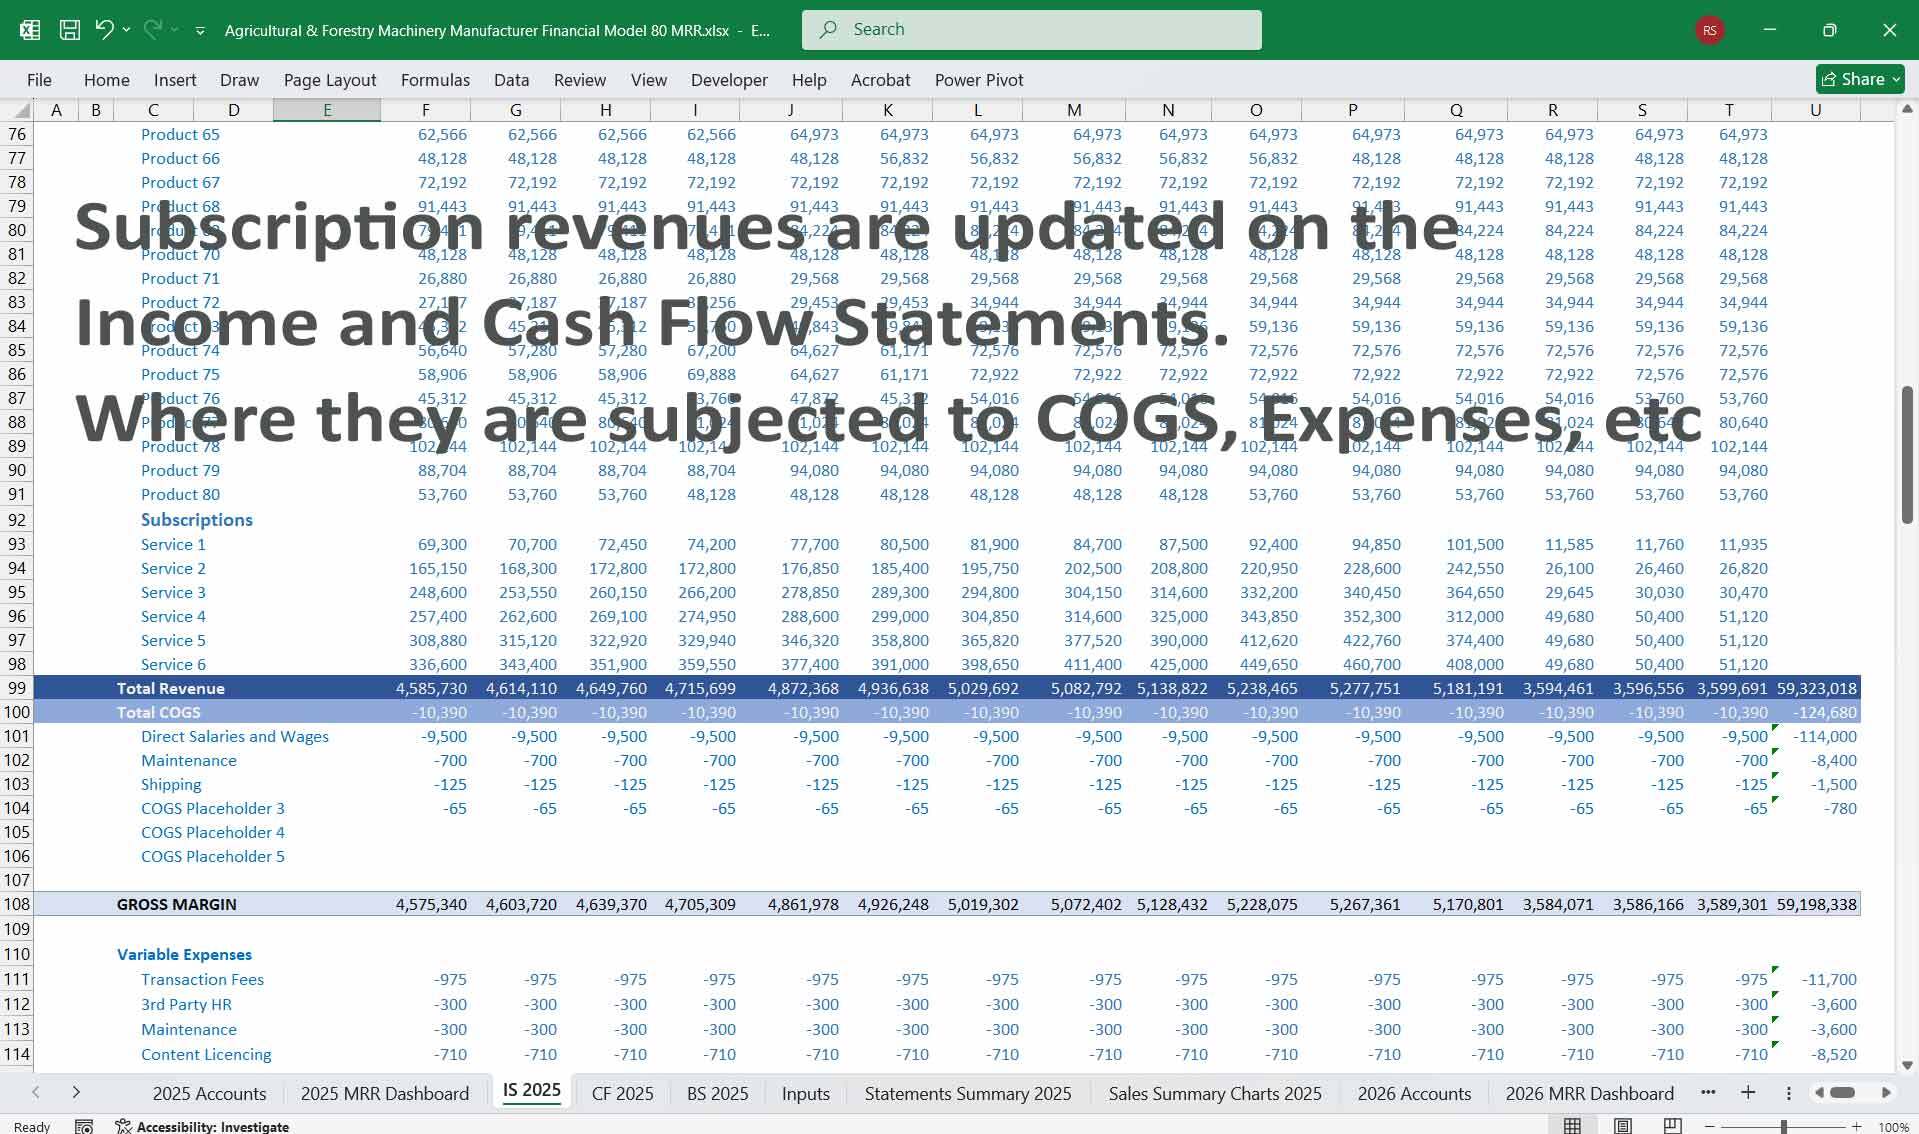
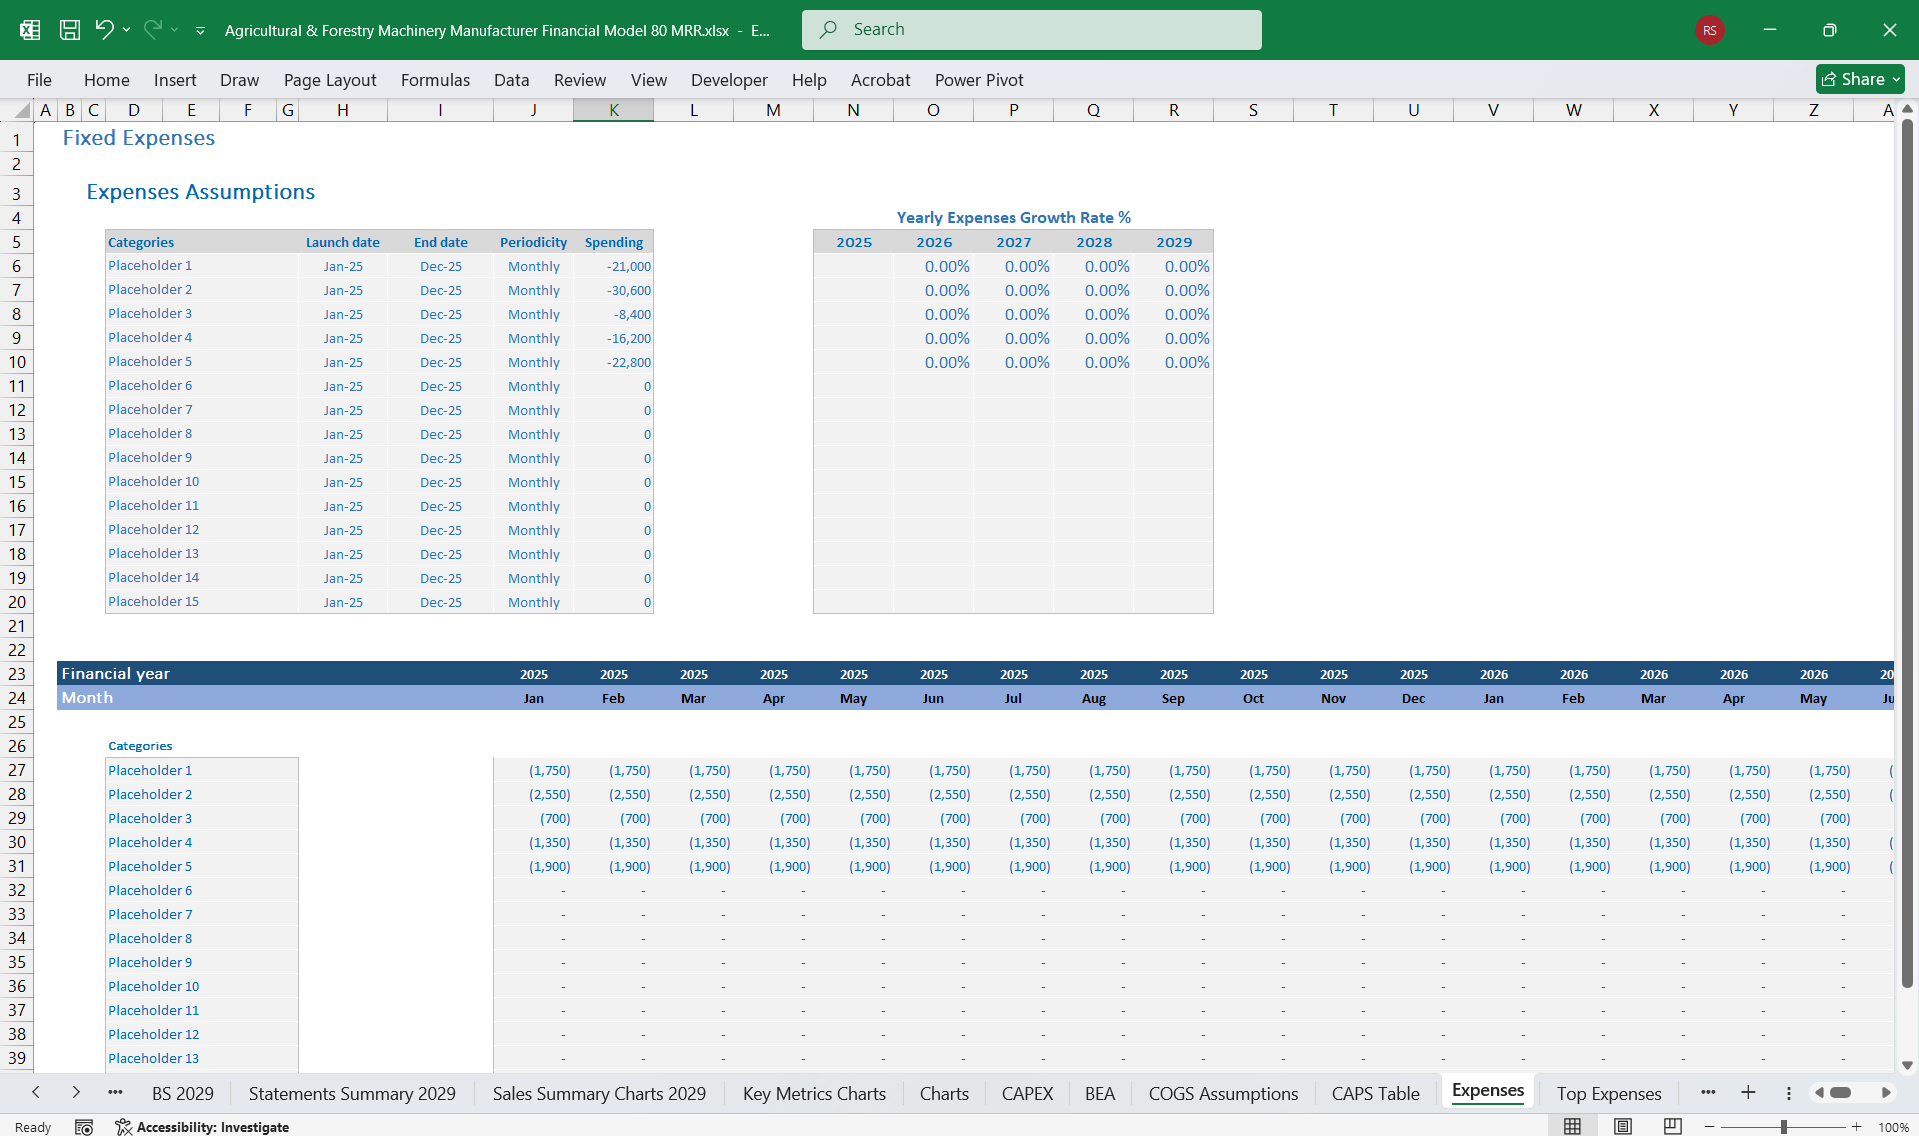
Financial Model for an Agricultural & Forestry Machinery ManufacturerThis financial model offers a comprehensive structure for managing the operations of an Agricultural & Forestry Machinery Manufacturer, including an Income Statement, Cash Flow Statement, and Balance Sheet, along with scalability provisions for 80 product lines. The model also incorporates a 6-Tier Subscription Model to ensure steady, recurring revenue and to engage customers in maintenance, analytics, and support.
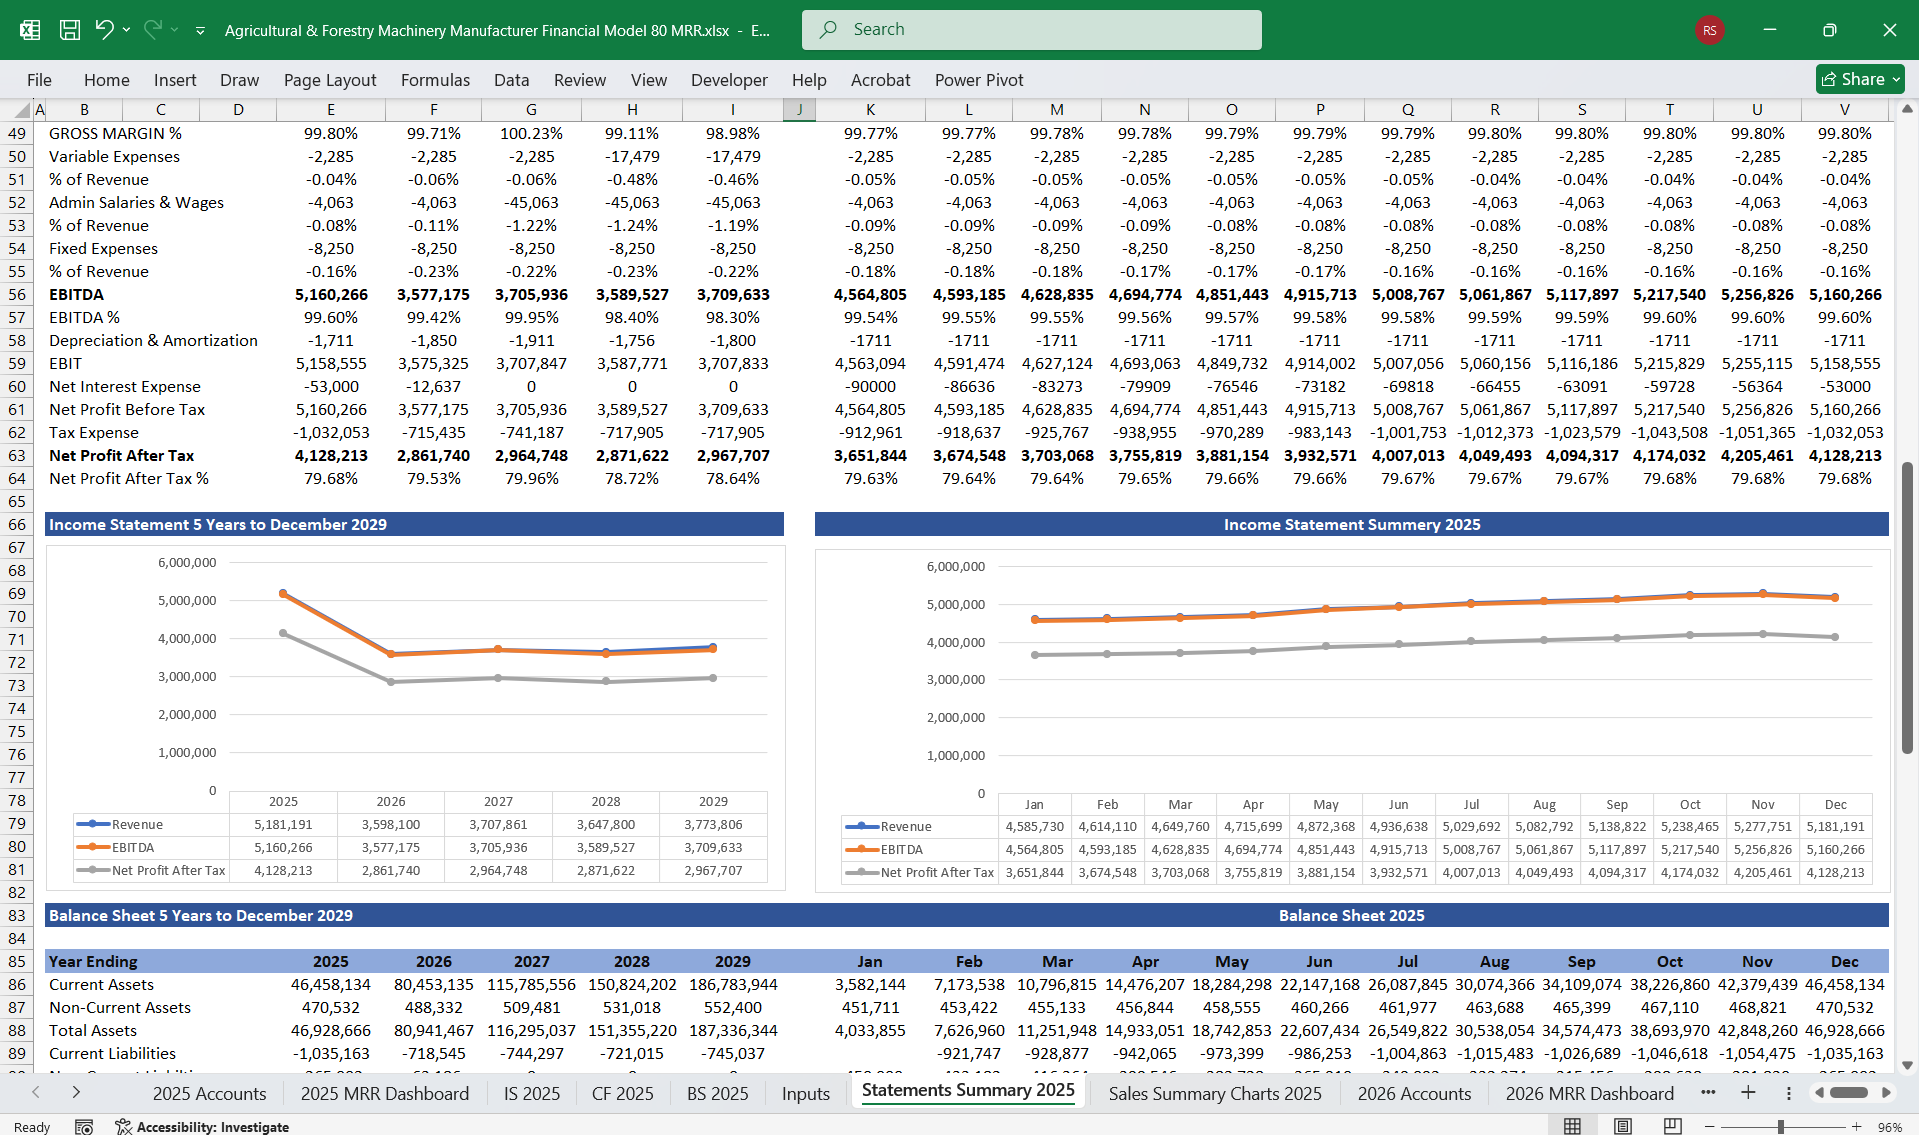
1. Income StatementRevenue Streams
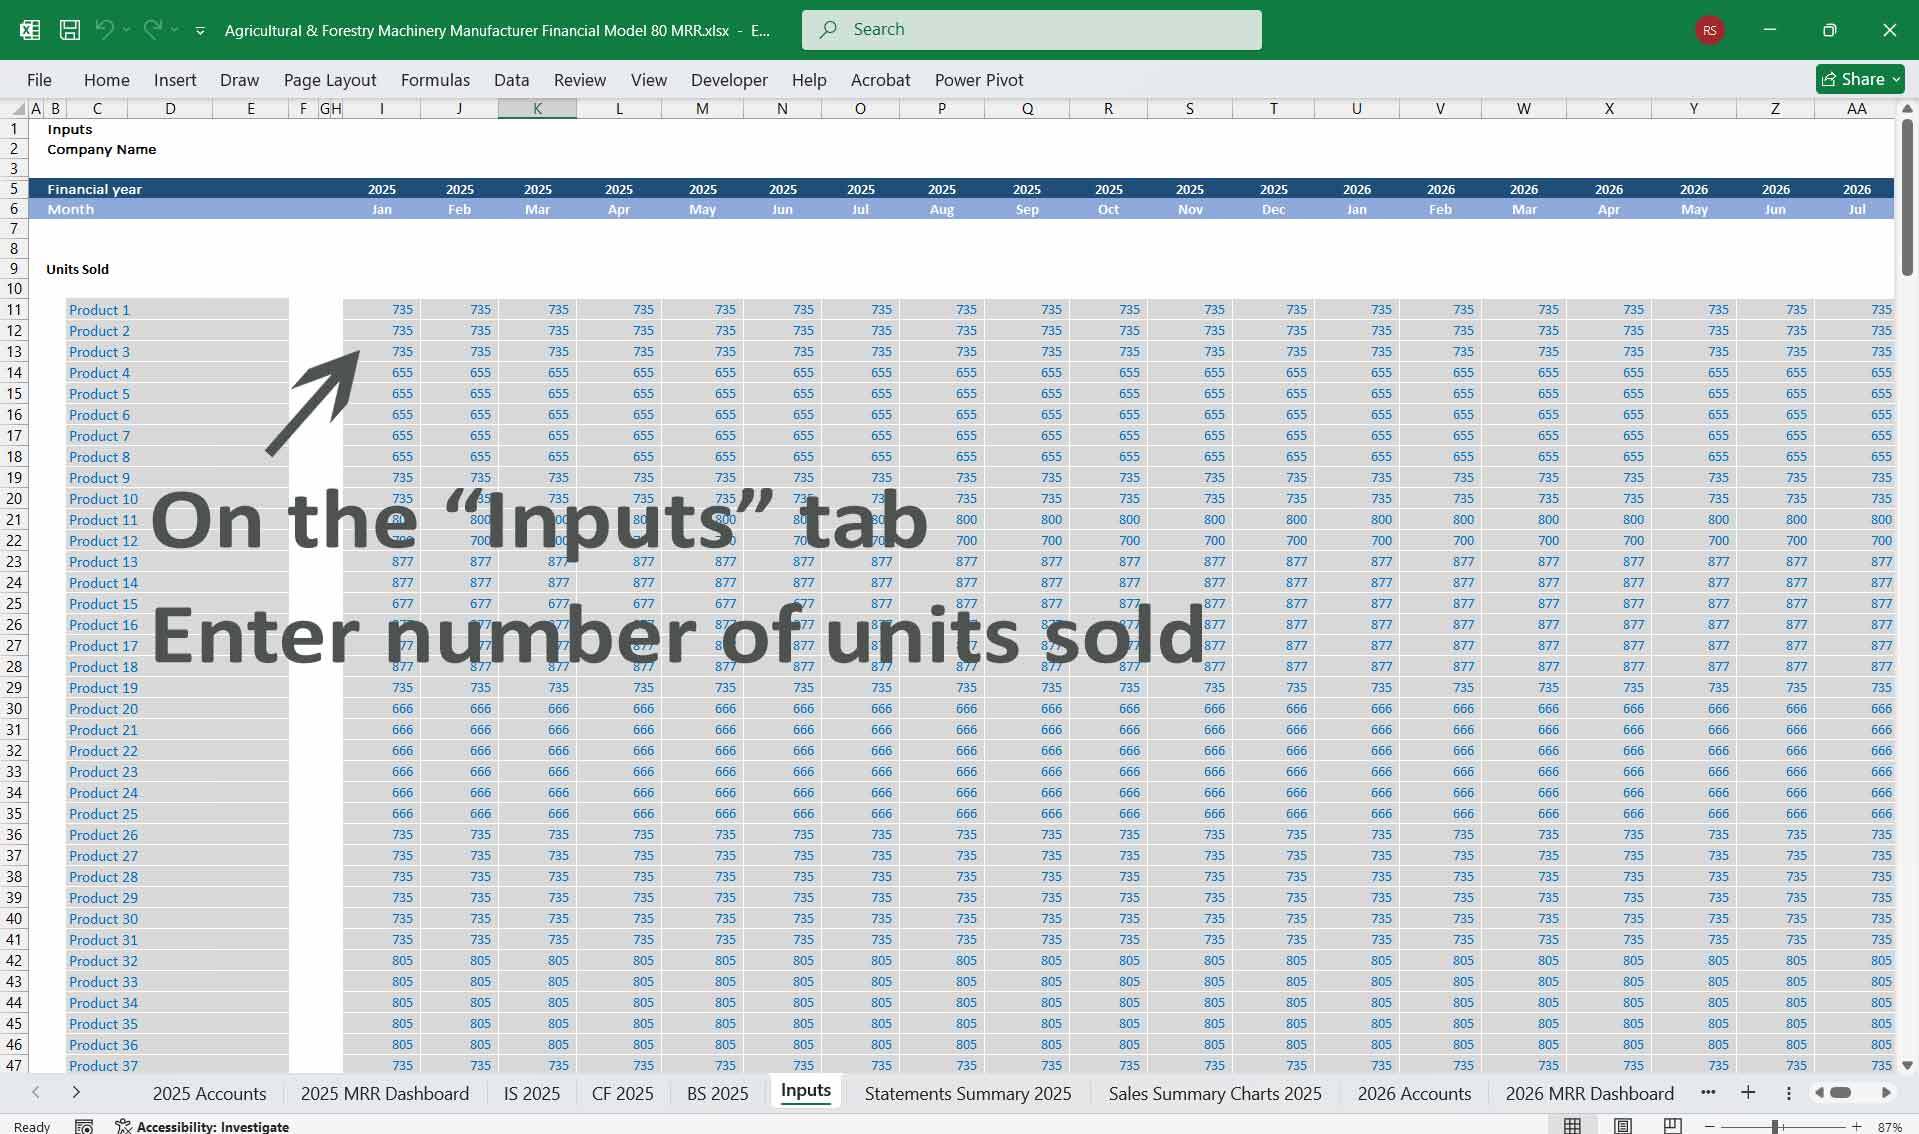
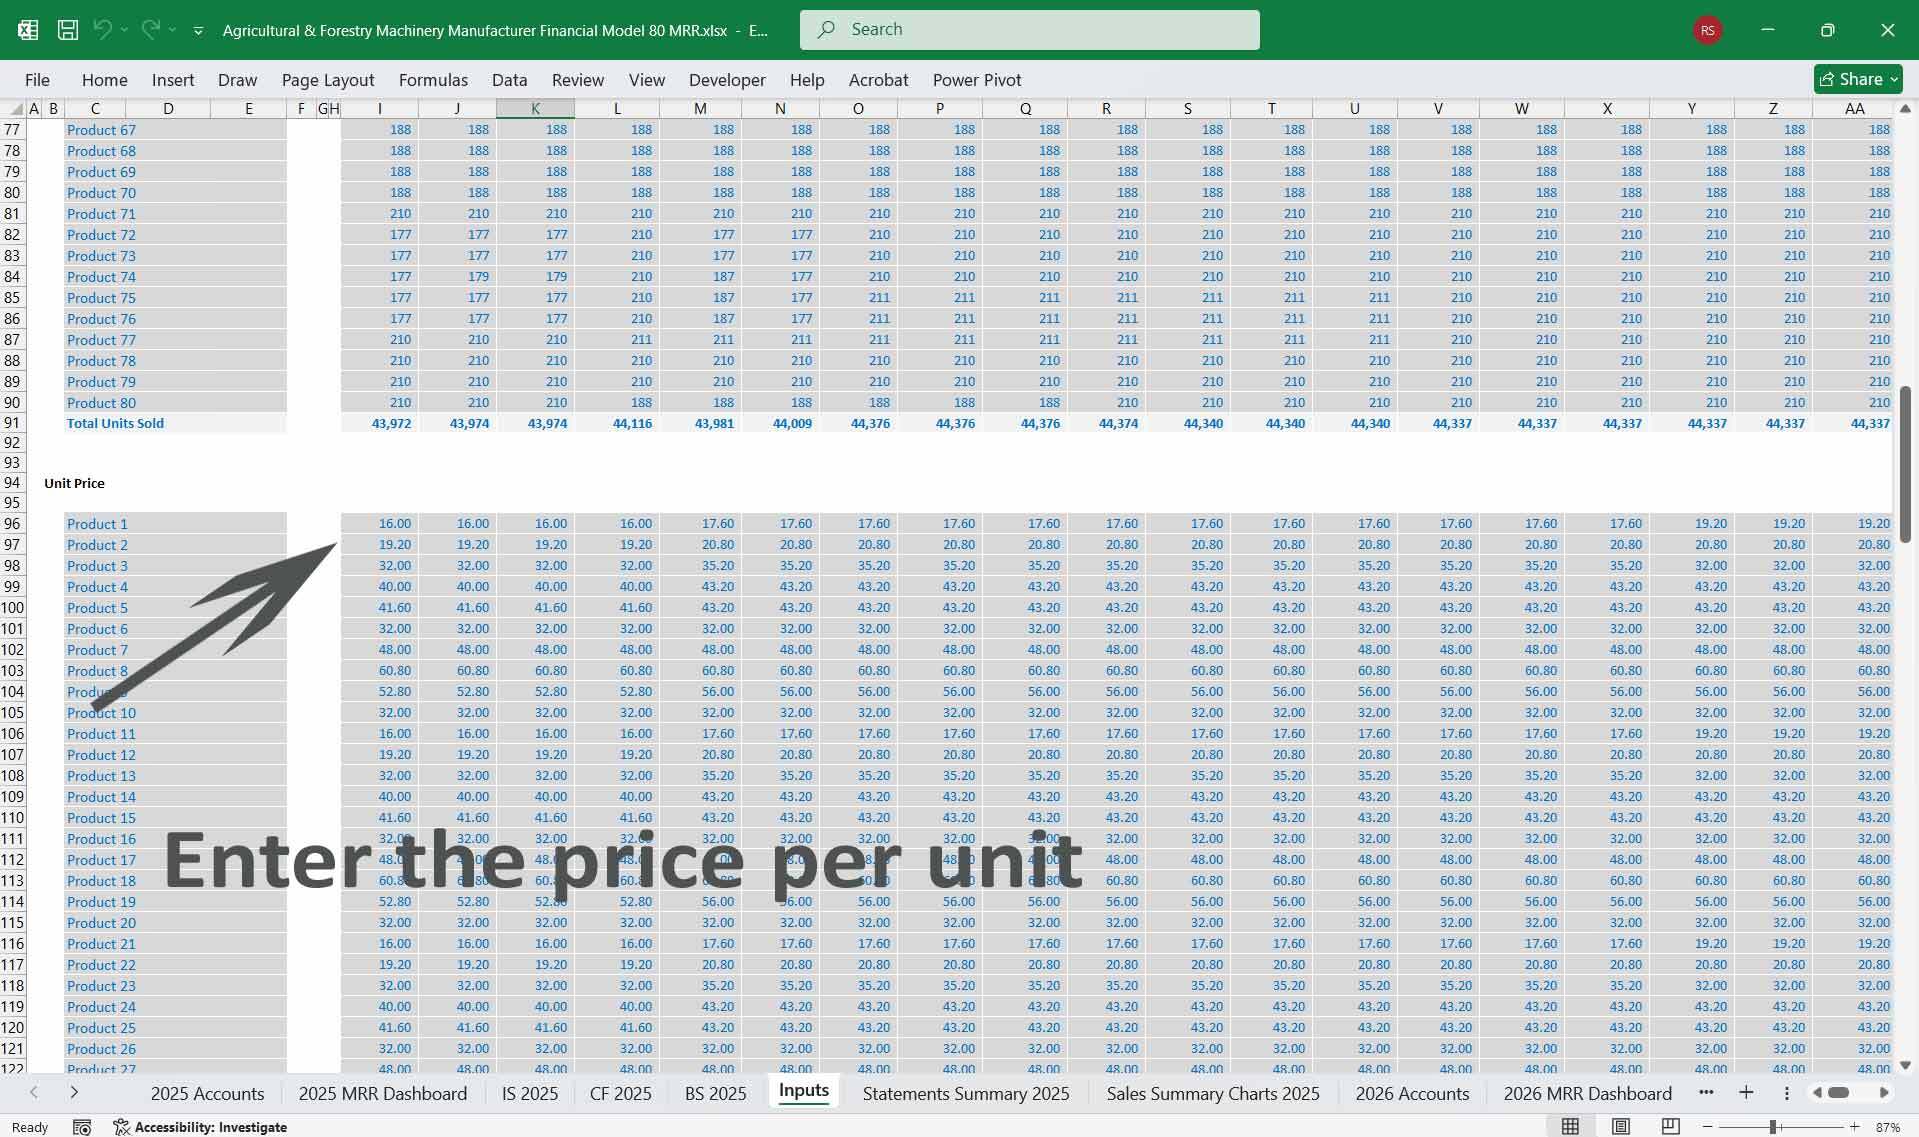
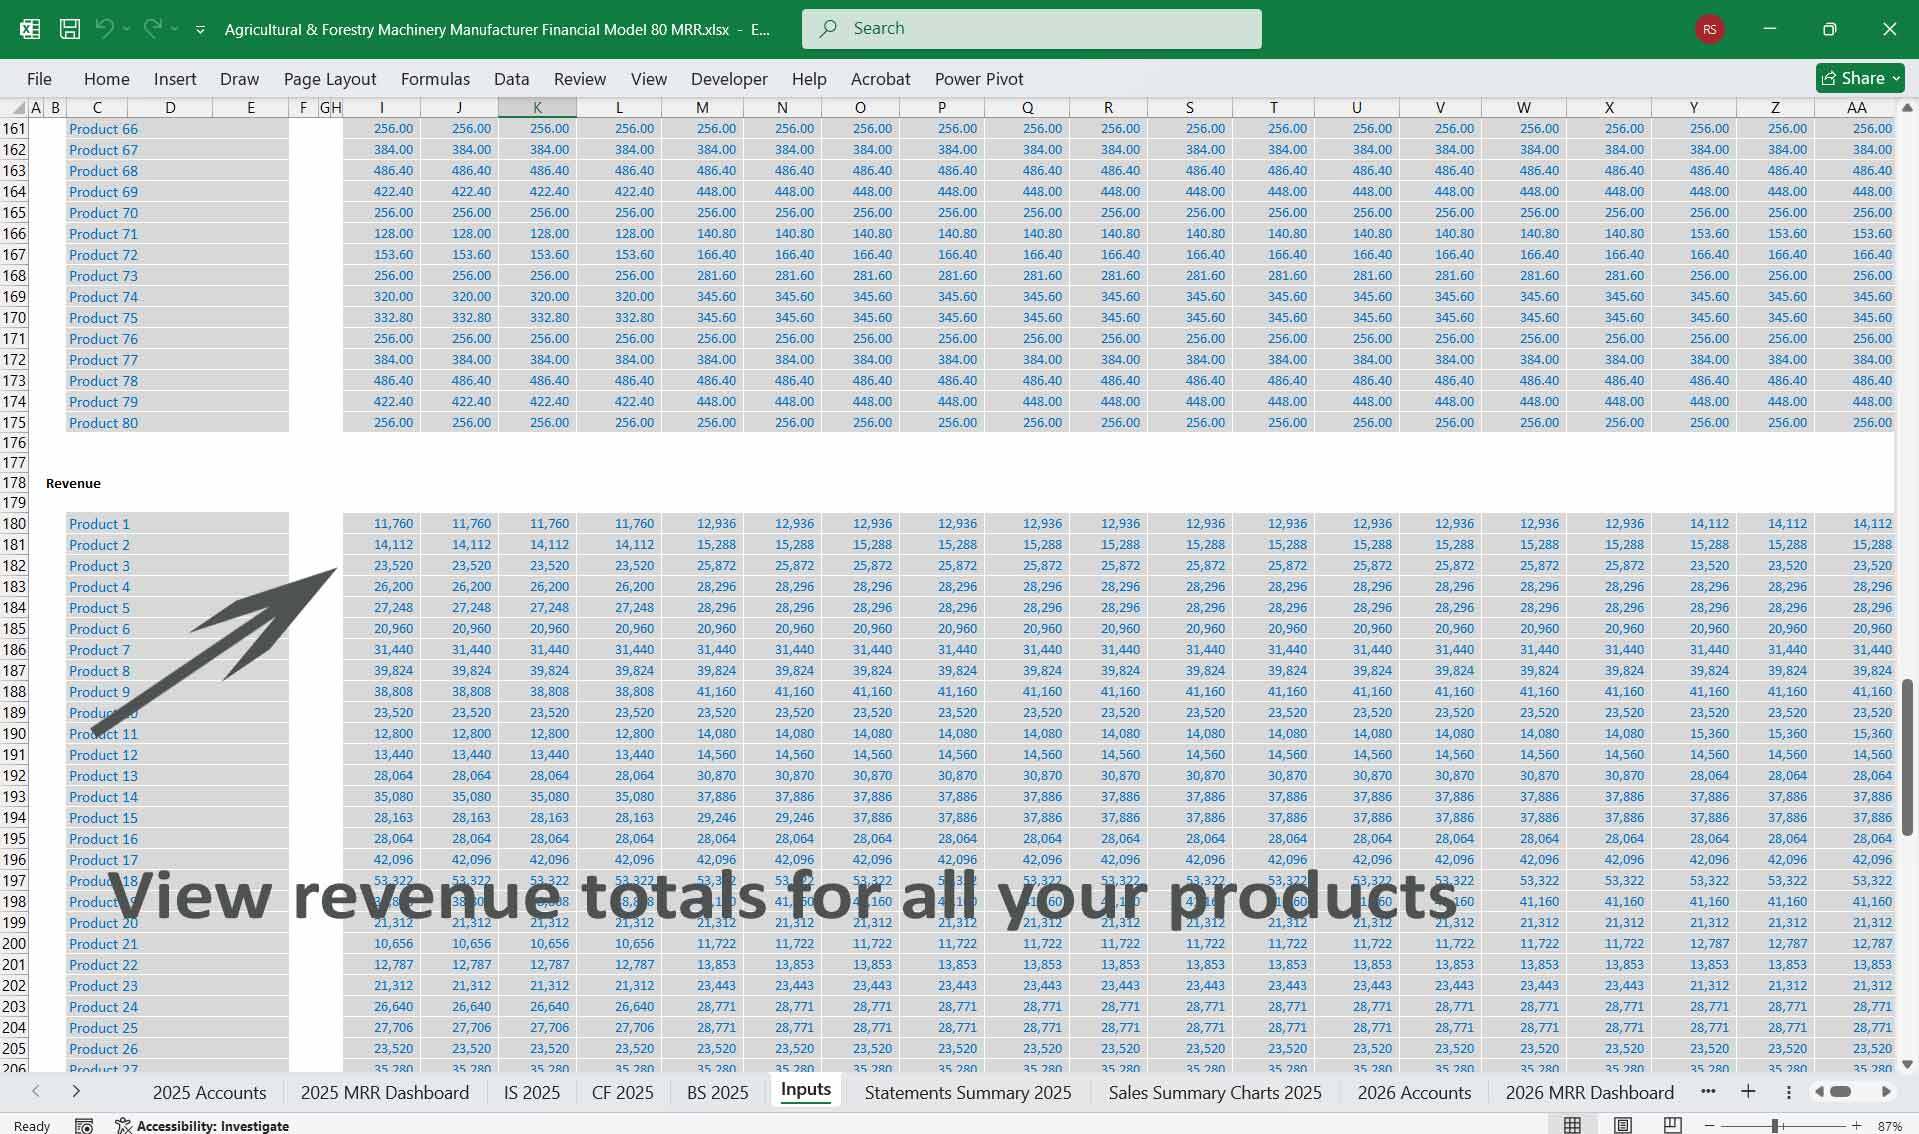
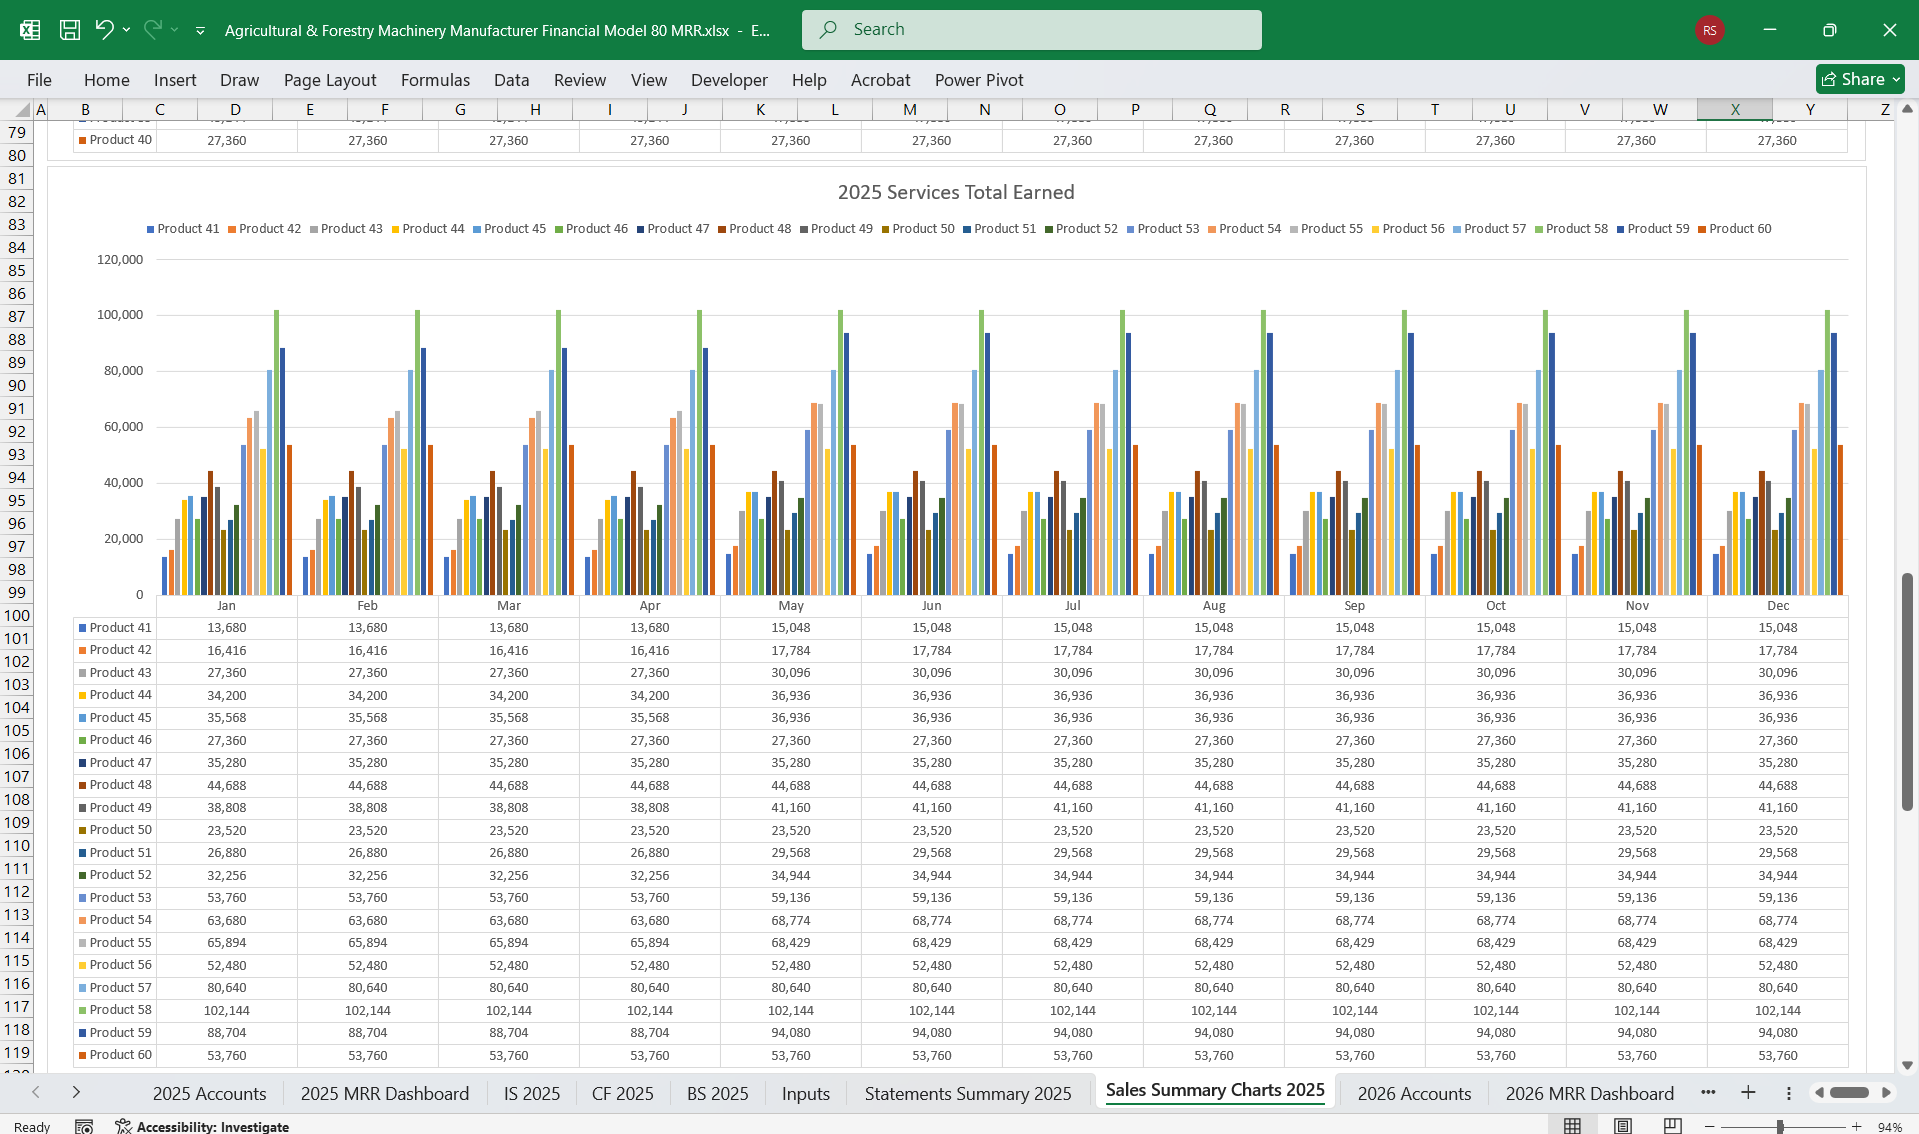
80 Product Lines
Covers an extensive range to capture niche markets and enable geographic diversification.
Tier Structure
Financial Model for an Agricultural & Forestry Machinery ManufacturerThis financial model offers a comprehensive structure for managing the operations of an Agricultural & Forestry Machinery Manufacturer, including an Income Statement, Cash Flow Statement, and Balance Sheet, along with scalability provisions for 80 product lines. The model also incorporates a 6-Tier Subscription Model to ensure steady, recurring revenue and to engage customers in maintenance, analytics, and support.
1. Income StatementRevenue Streams
- Product Sales:
- Agricultural Machinery: Tractors, harvesters, seeders, and sprayers.
- Forestry Equipment: Feller bunchers, skidders, sawmills, and chippers.
- Attachments: Plows, harrows, balers, and log grapples.
- Parts & Consumables:
- Filters, blades, hydraulic oils, and lubricants.
- Rental Services:
- Short-term machinery leasing for seasonal work.
- Custom Equipment Manufacturing:
- High-value, customer-specific equipment orders.
- Subscription Revenue:
- Maintenance contracts, telematics, and analytics tools (see Section 5).
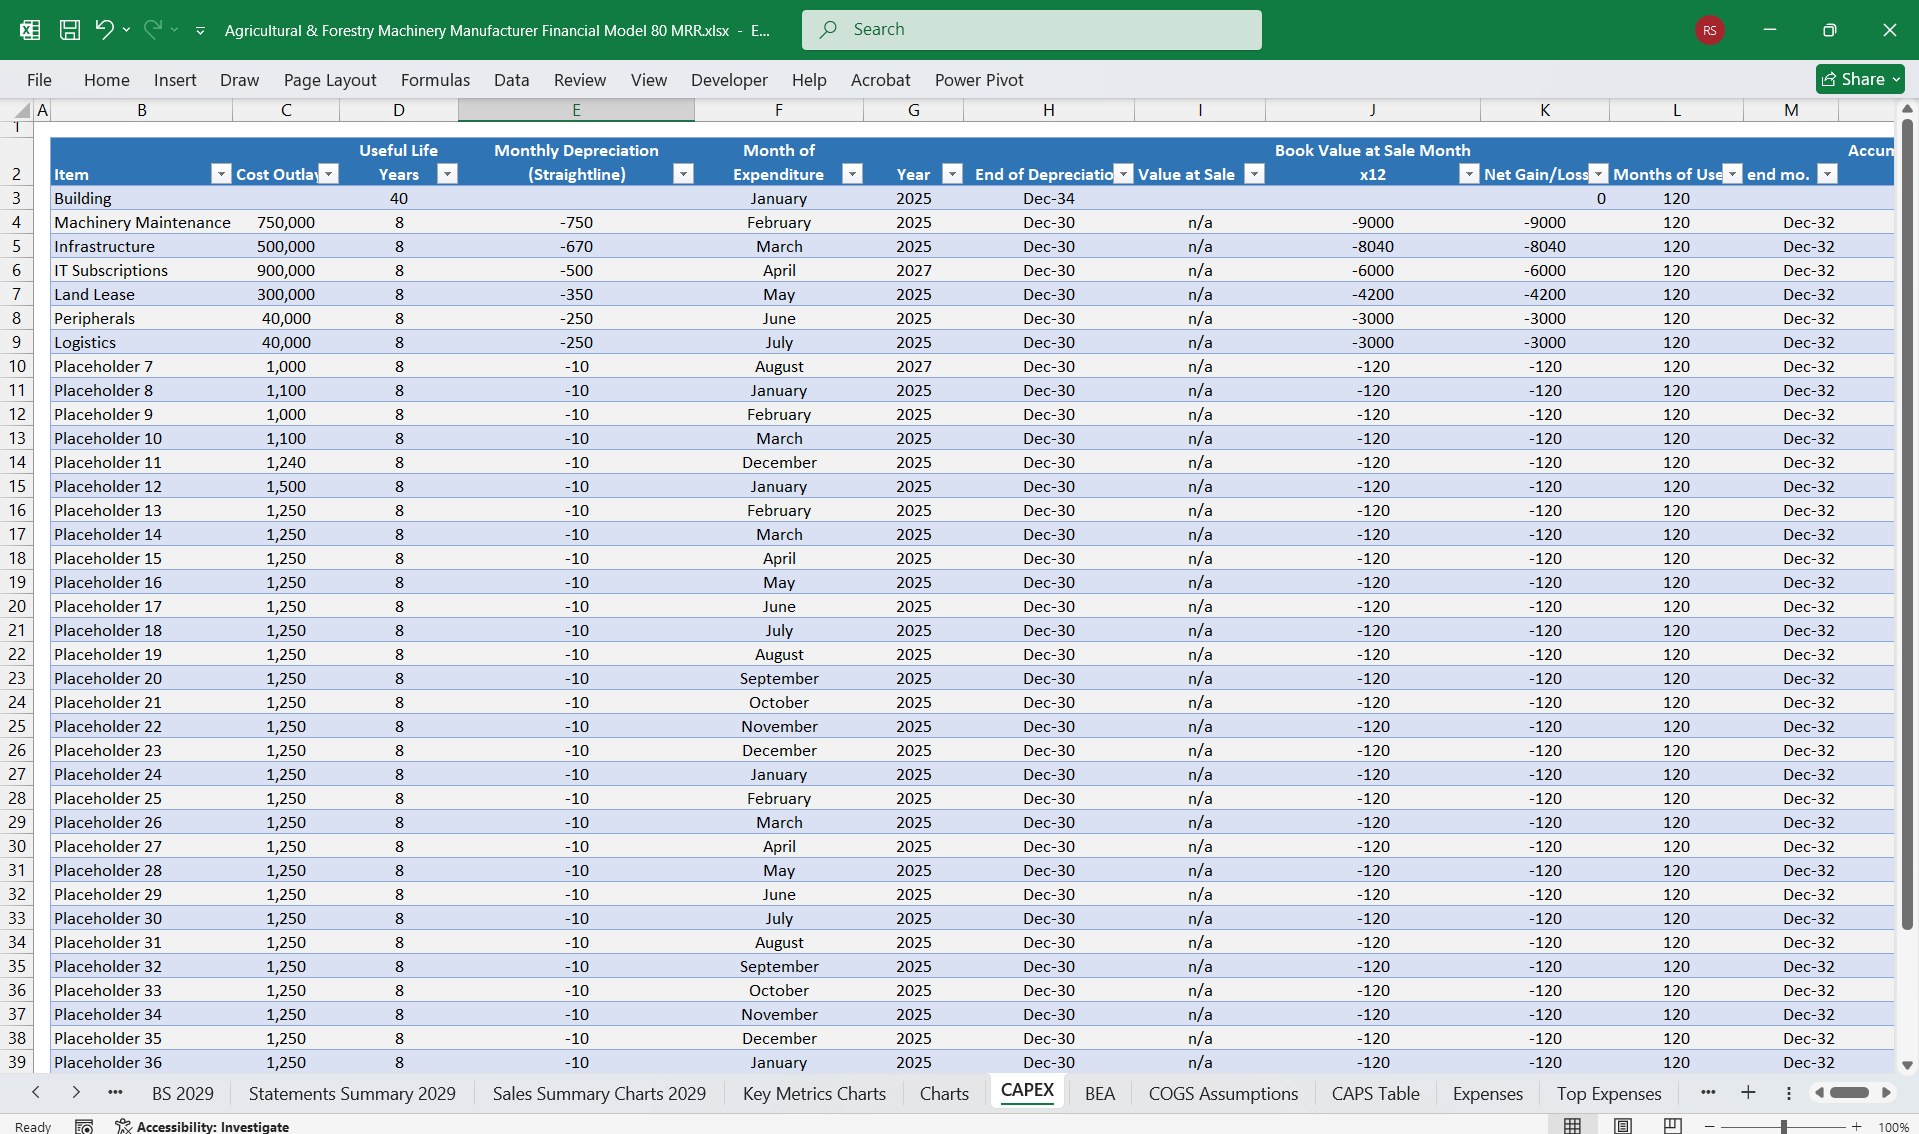
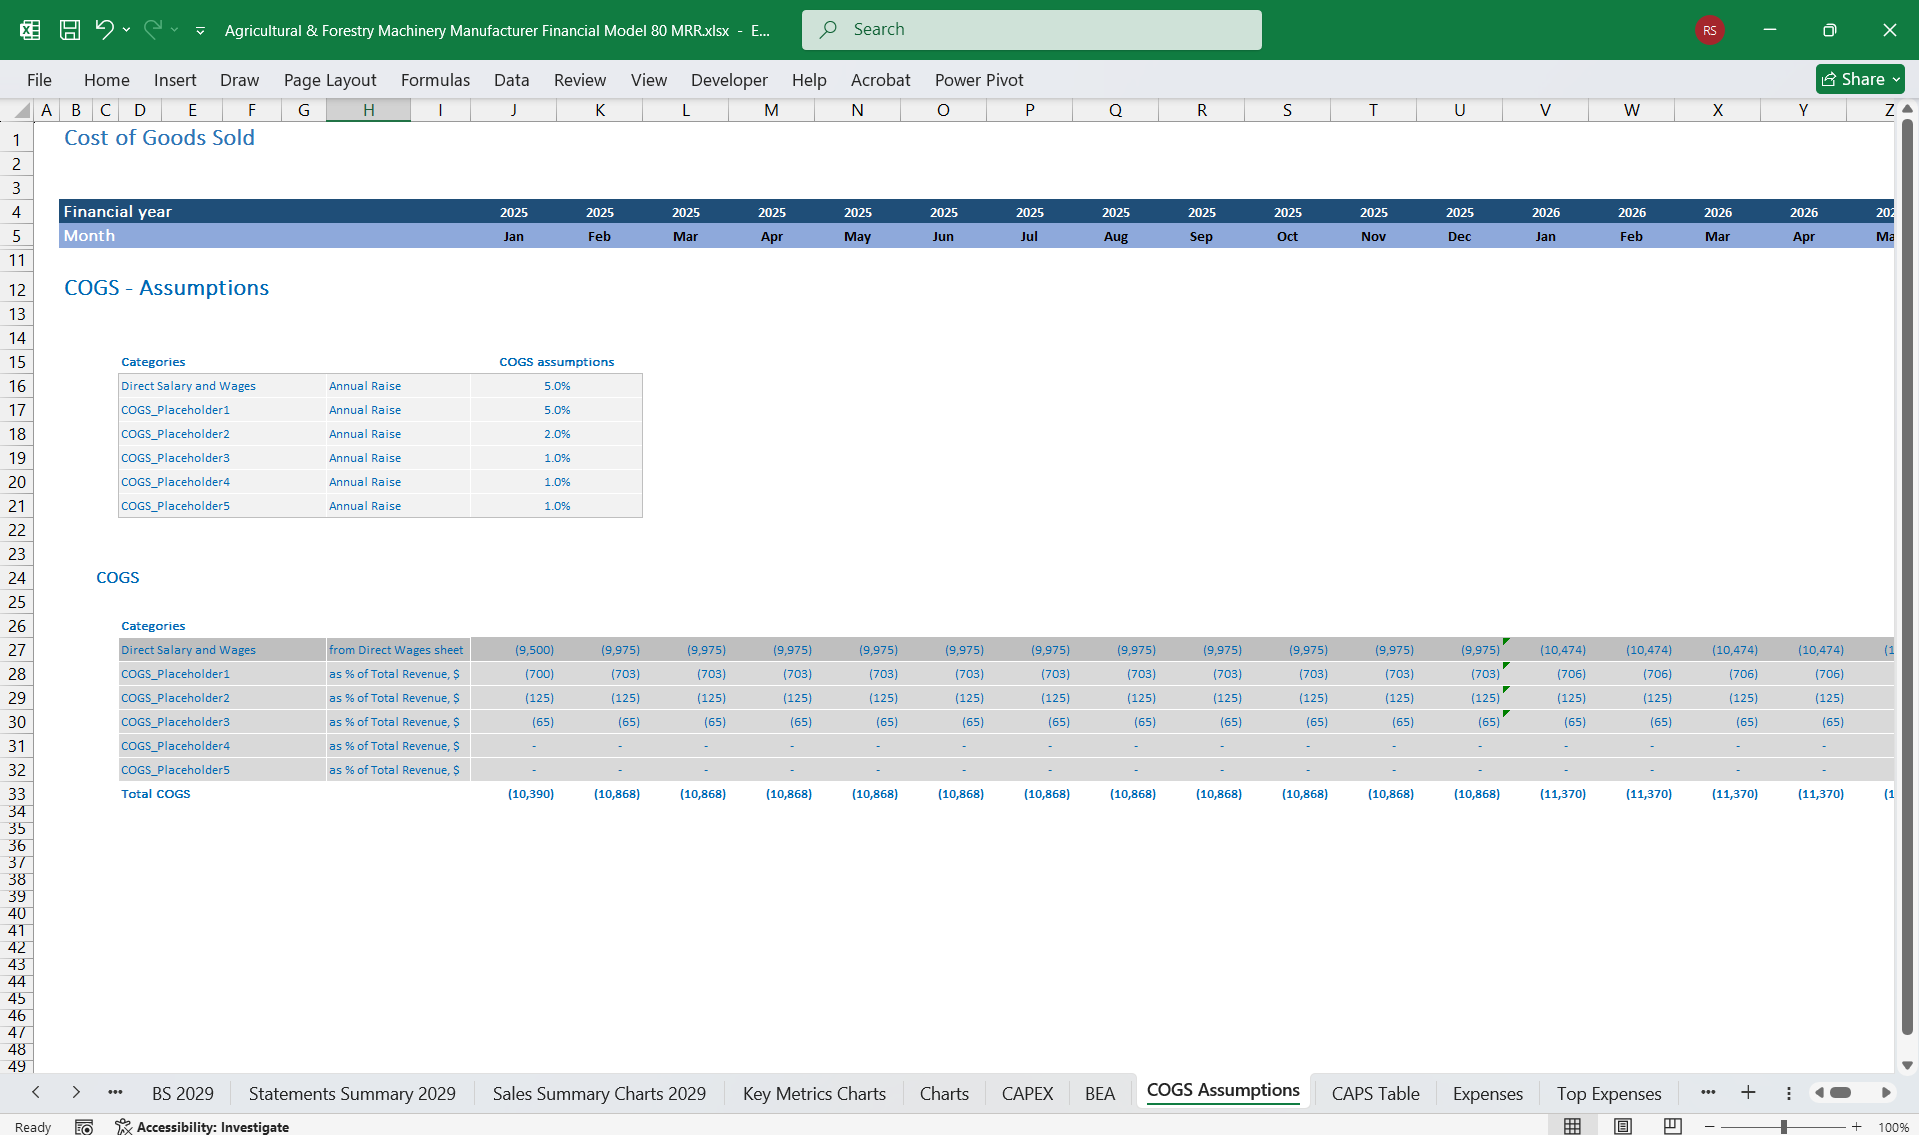
- Cost of Goods Sold (COGS):
- Materials: Metal parts, engines, electronics, and wood processing tools.
- Labor: Skilled technicians for assembly and calibration.
- Overheads: Depreciation of manufacturing equipment.
- Operating Expenses:
- R&D: For precision farming and eco-friendly forestry technology.
- Sales and Marketing: Exhibitions, advertisements, and dealer networks.
- Distribution: Logistics for bulky machinery.
- Depreciation: Capital equipment and factory infrastructure.
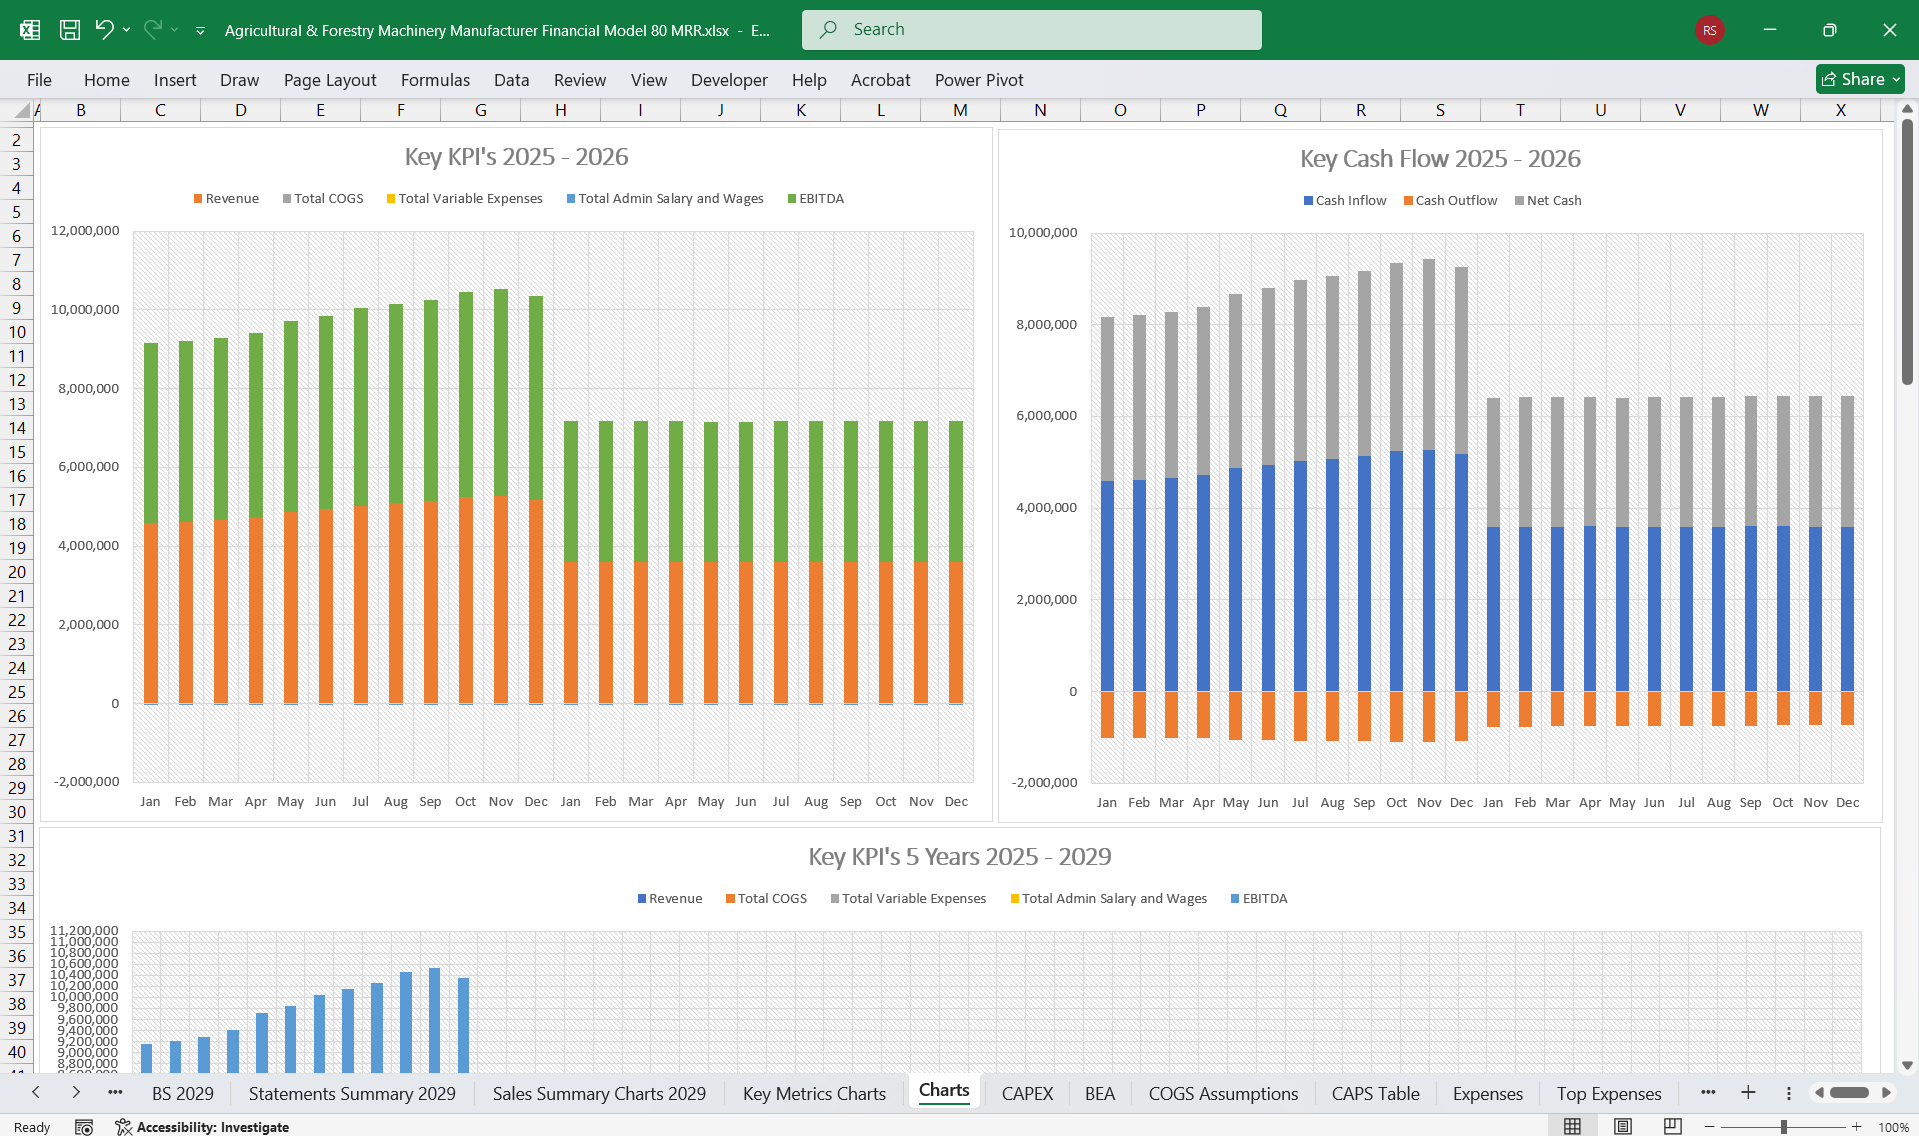
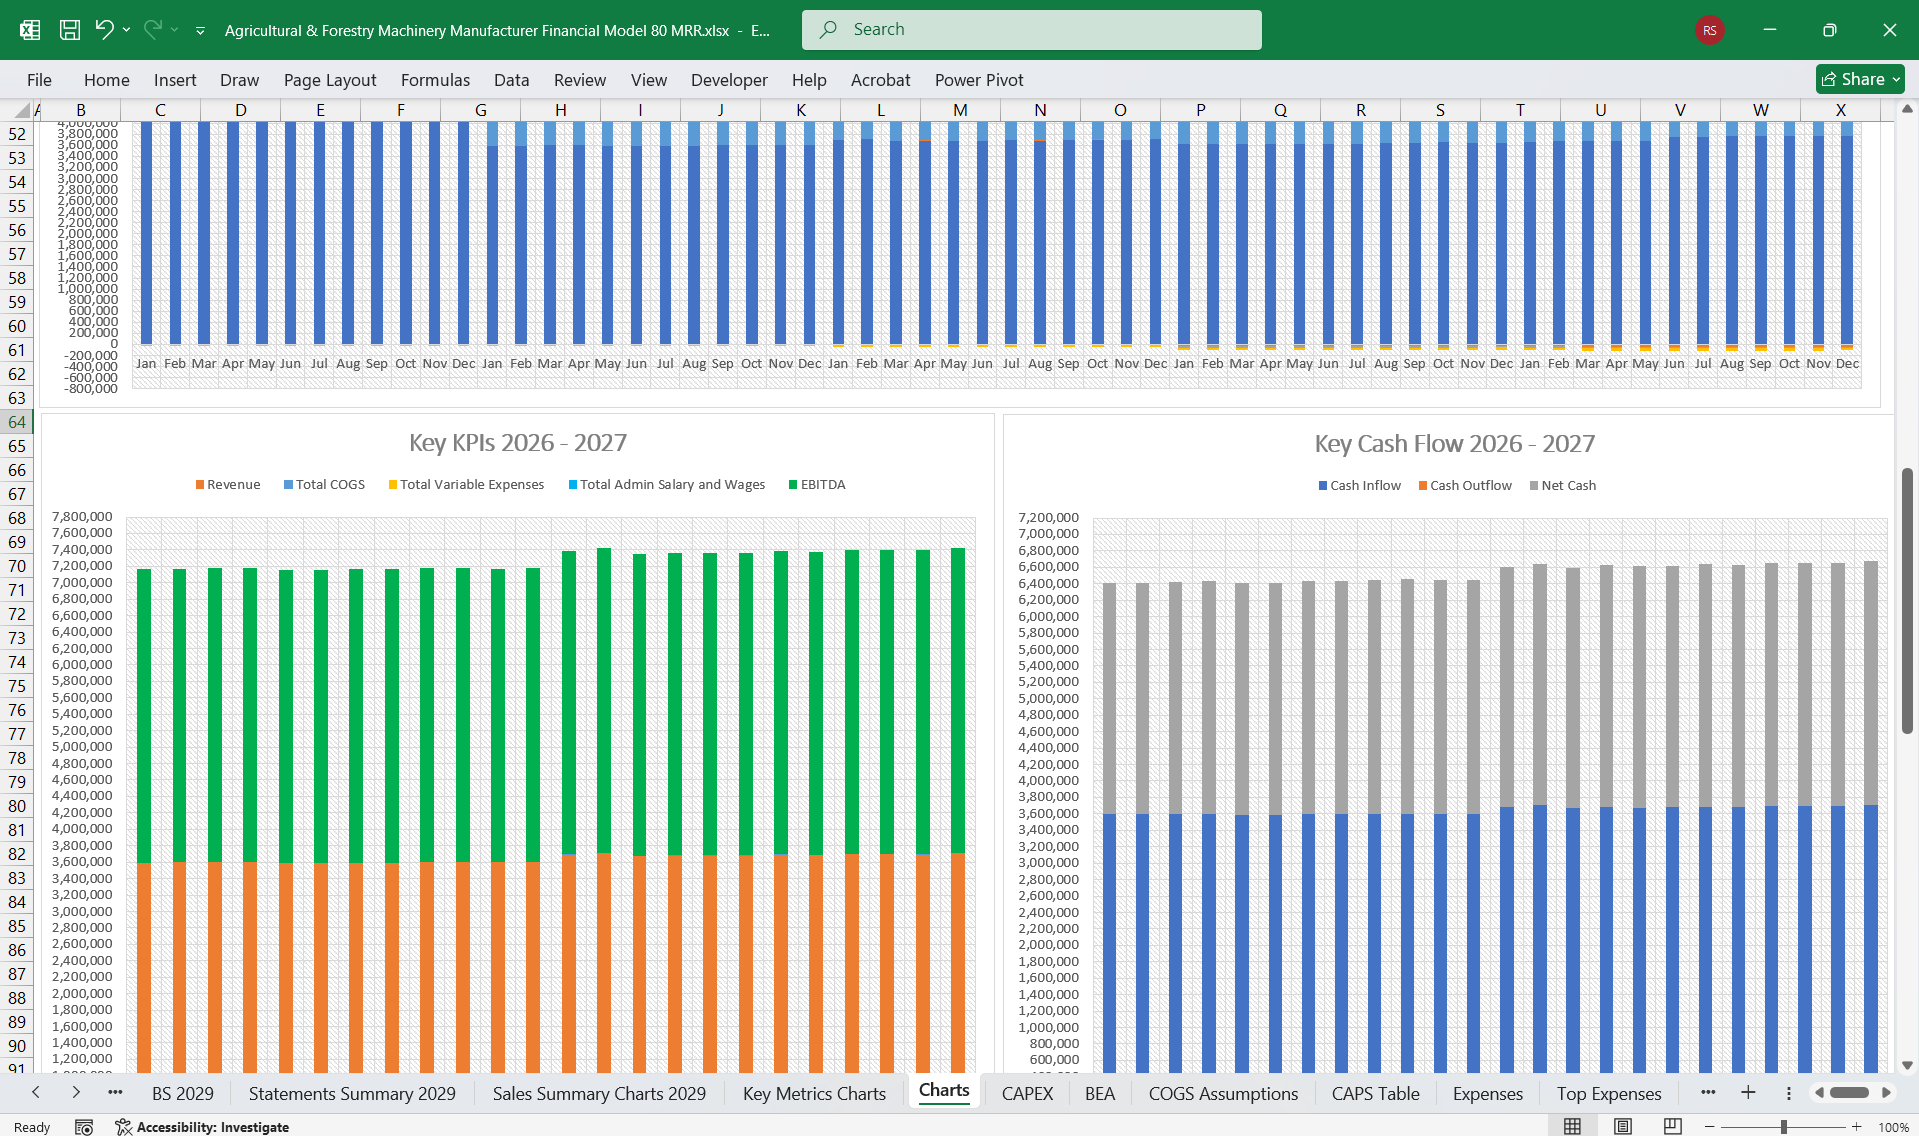
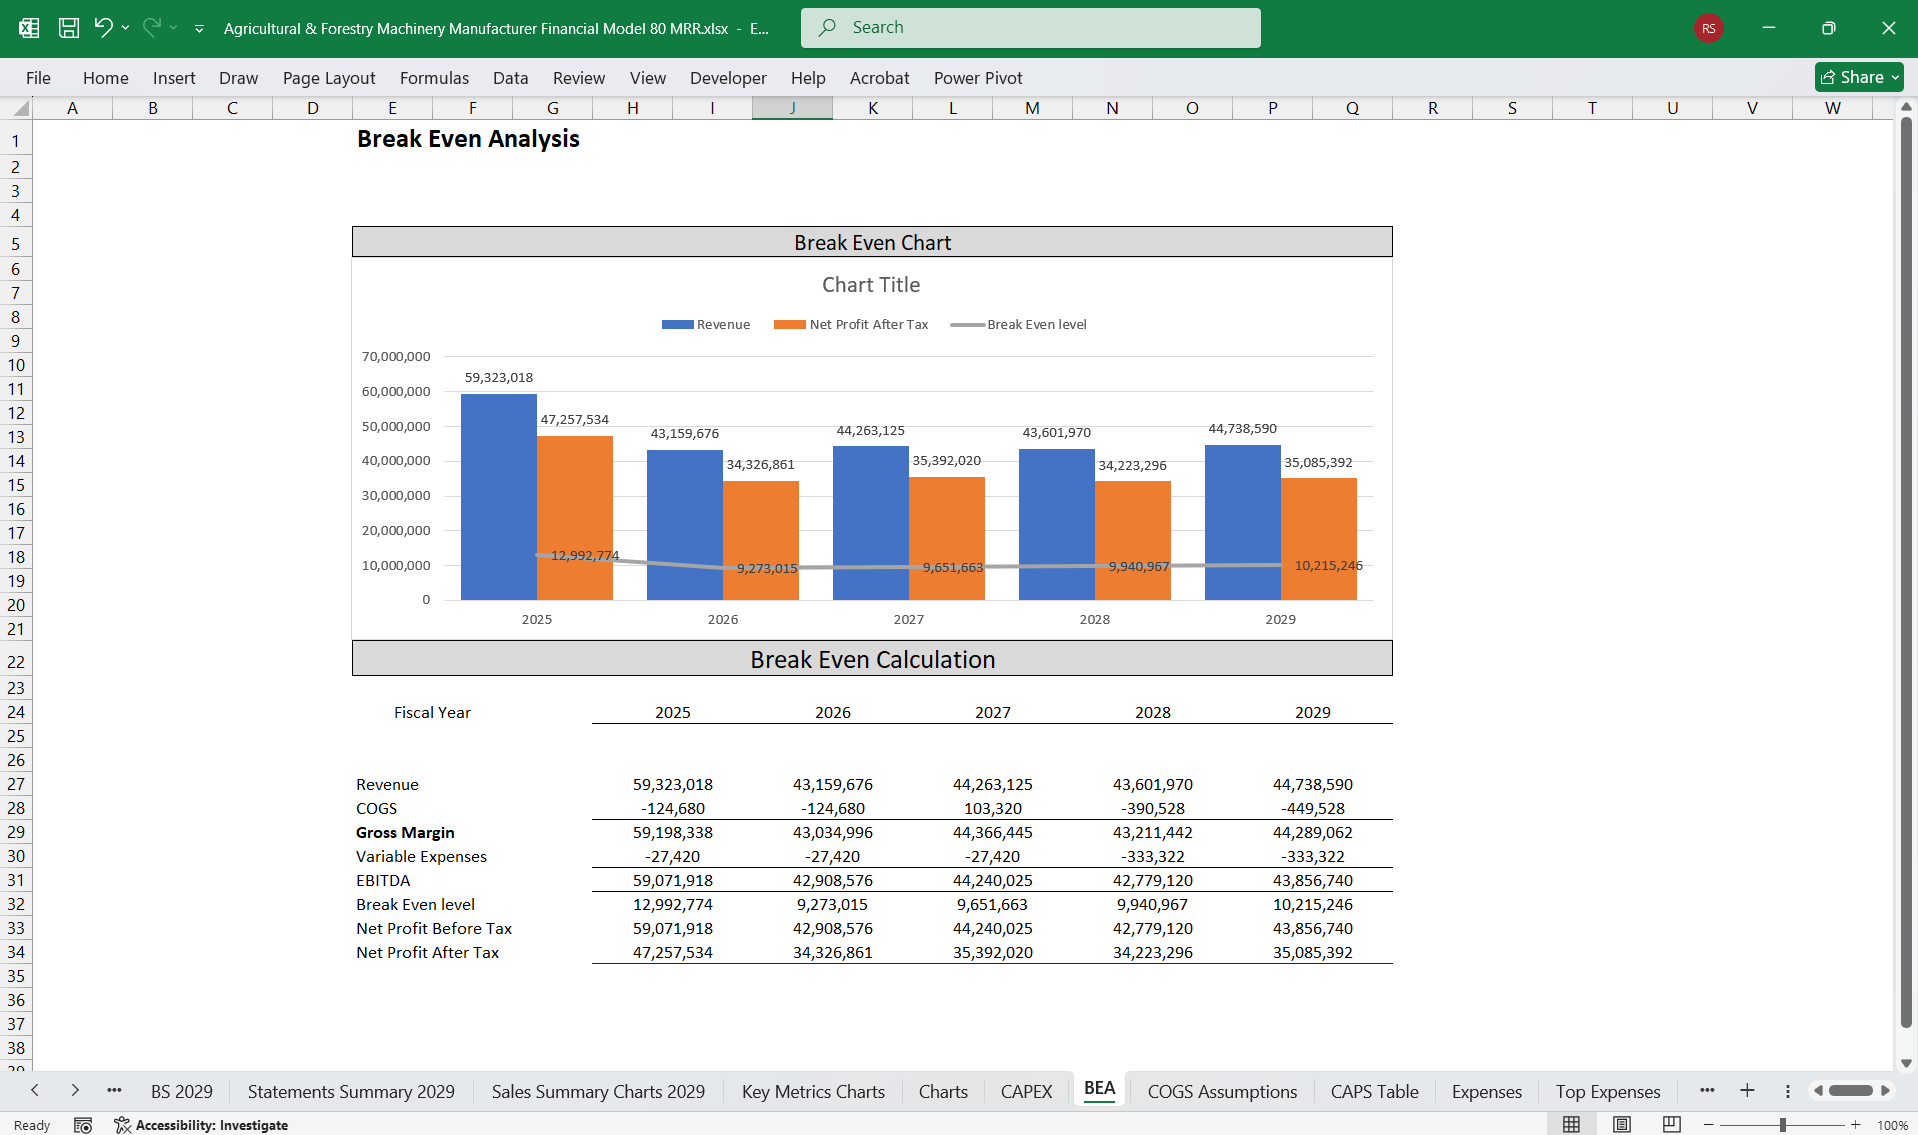
- Gross Profit: Revenue - COGS.
- Operating Profit (EBIT): Gross Profit - Operating Expenses.
- Net Profit: EBIT - Taxes - Interest.
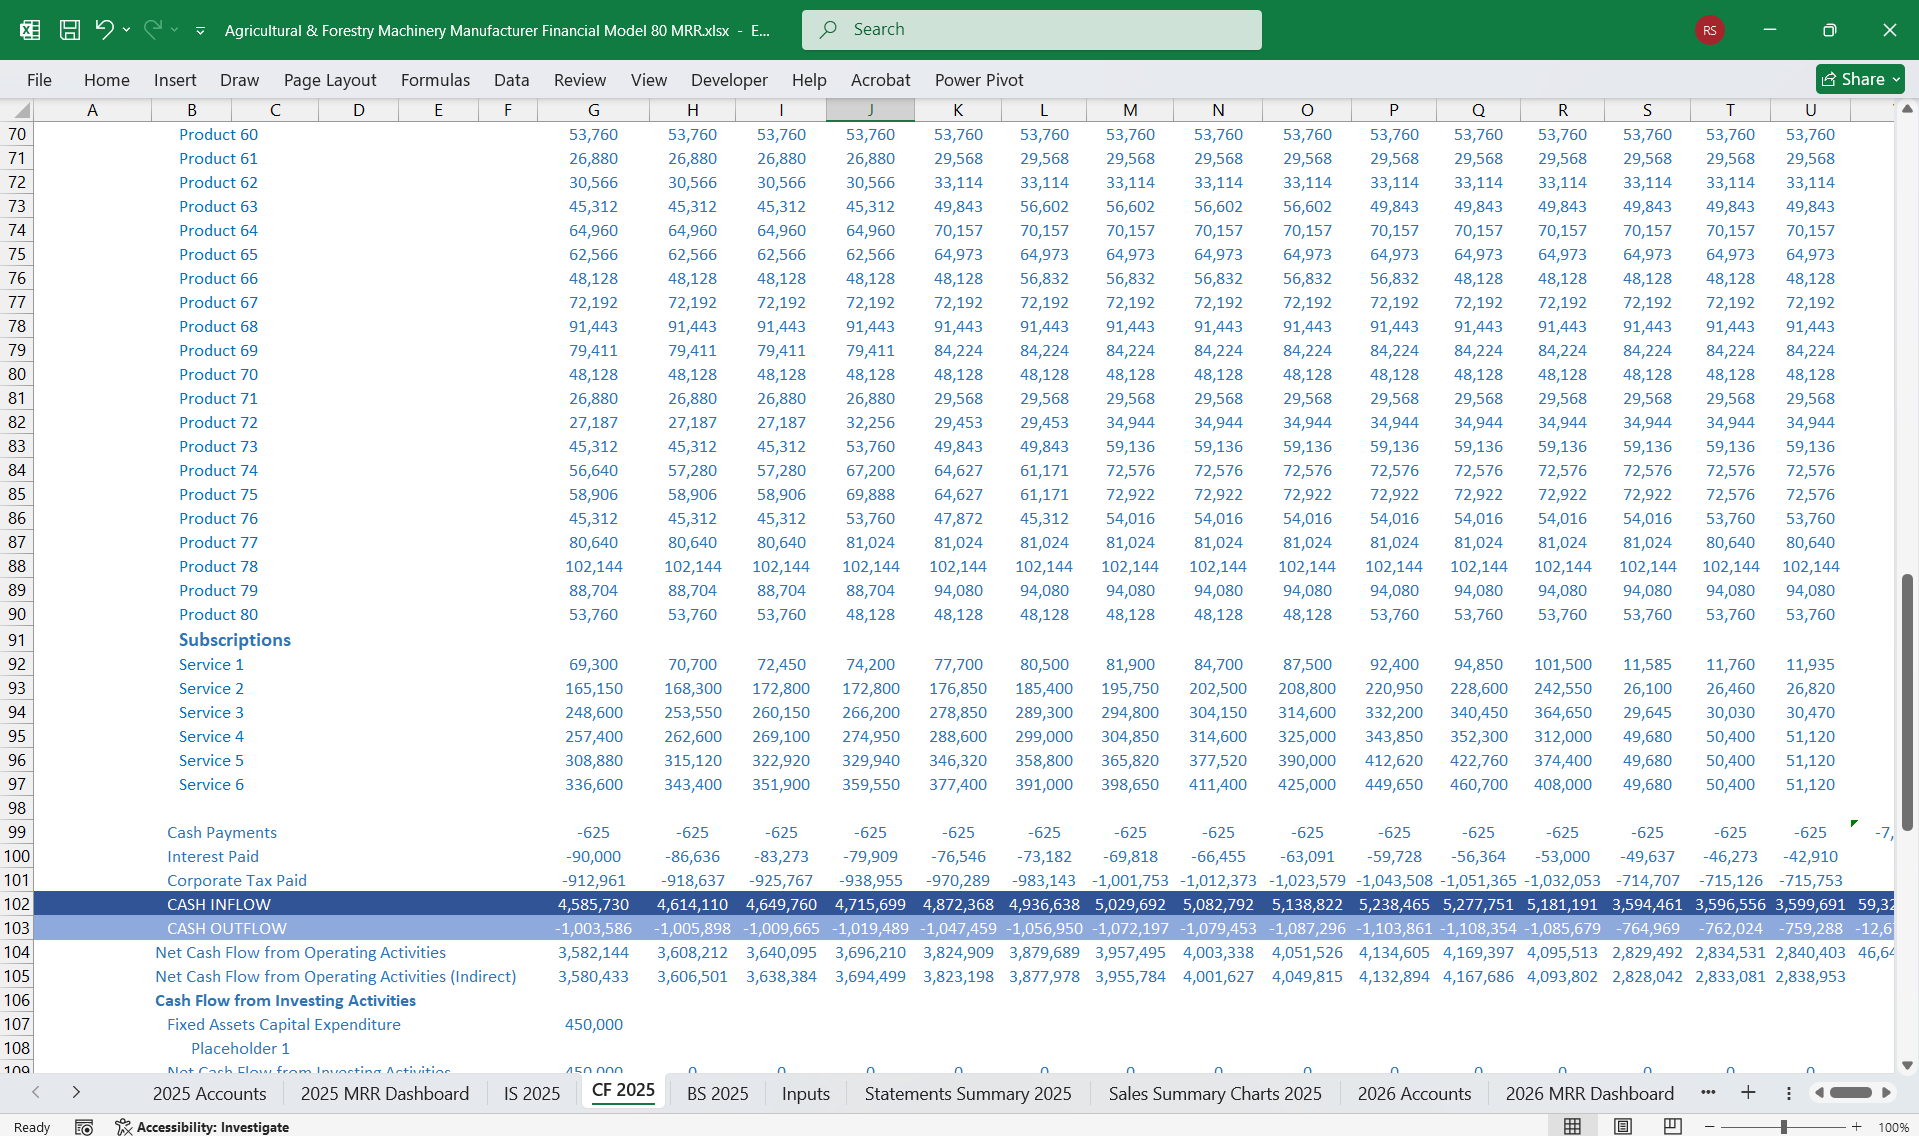
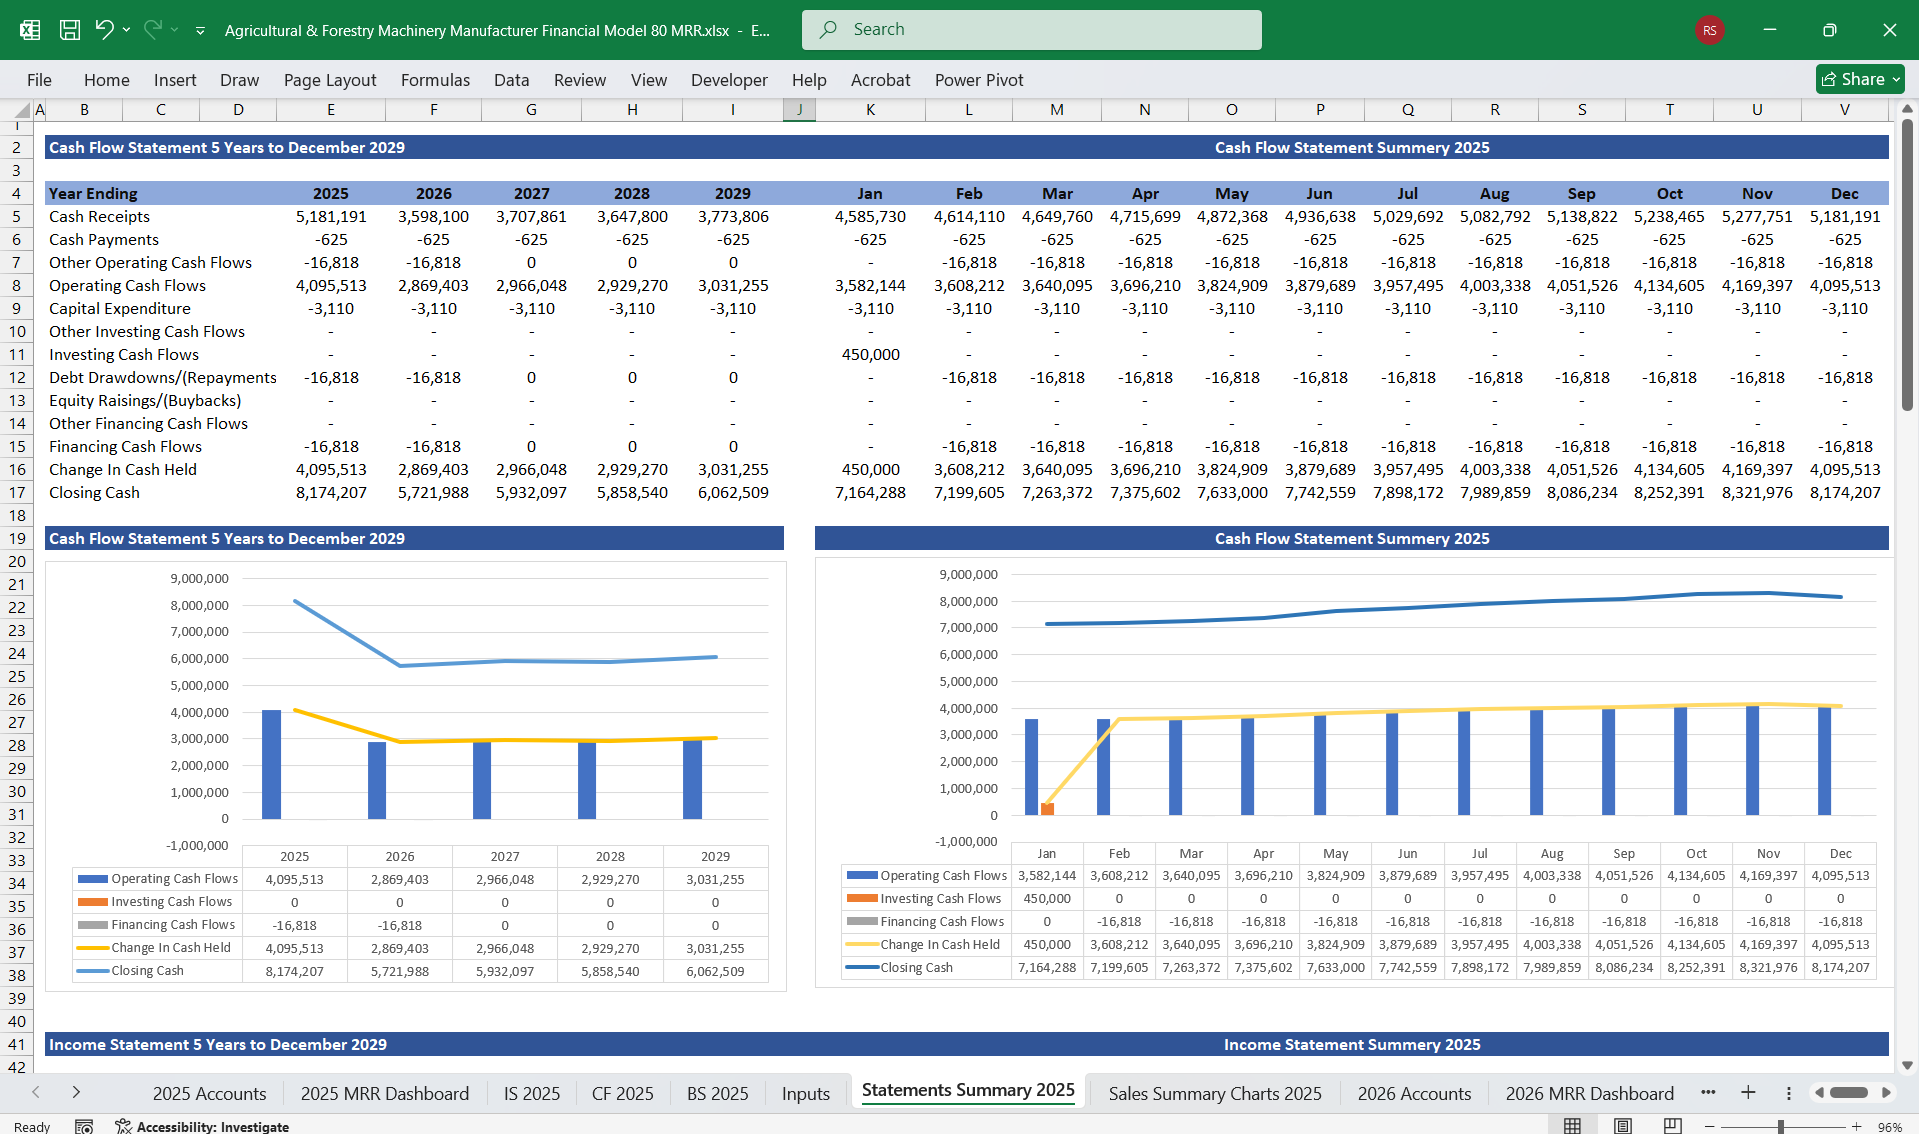
- Inflows:
- Receipts from machinery sales, rentals, and parts.
- Subscription payments.
- Outflows:
- Procurement of materials and components.
- Salaries and wages for staff.
- Marketing campaigns for upcoming products.
- Inflows:
- Sale of surplus or outdated equipment.
- Outflows:
- Purchase of CNC machinery, welding robots, and spray booths for production.
- Development of telematics platforms.
- Inflows:
- Bank loans for manufacturing expansions.
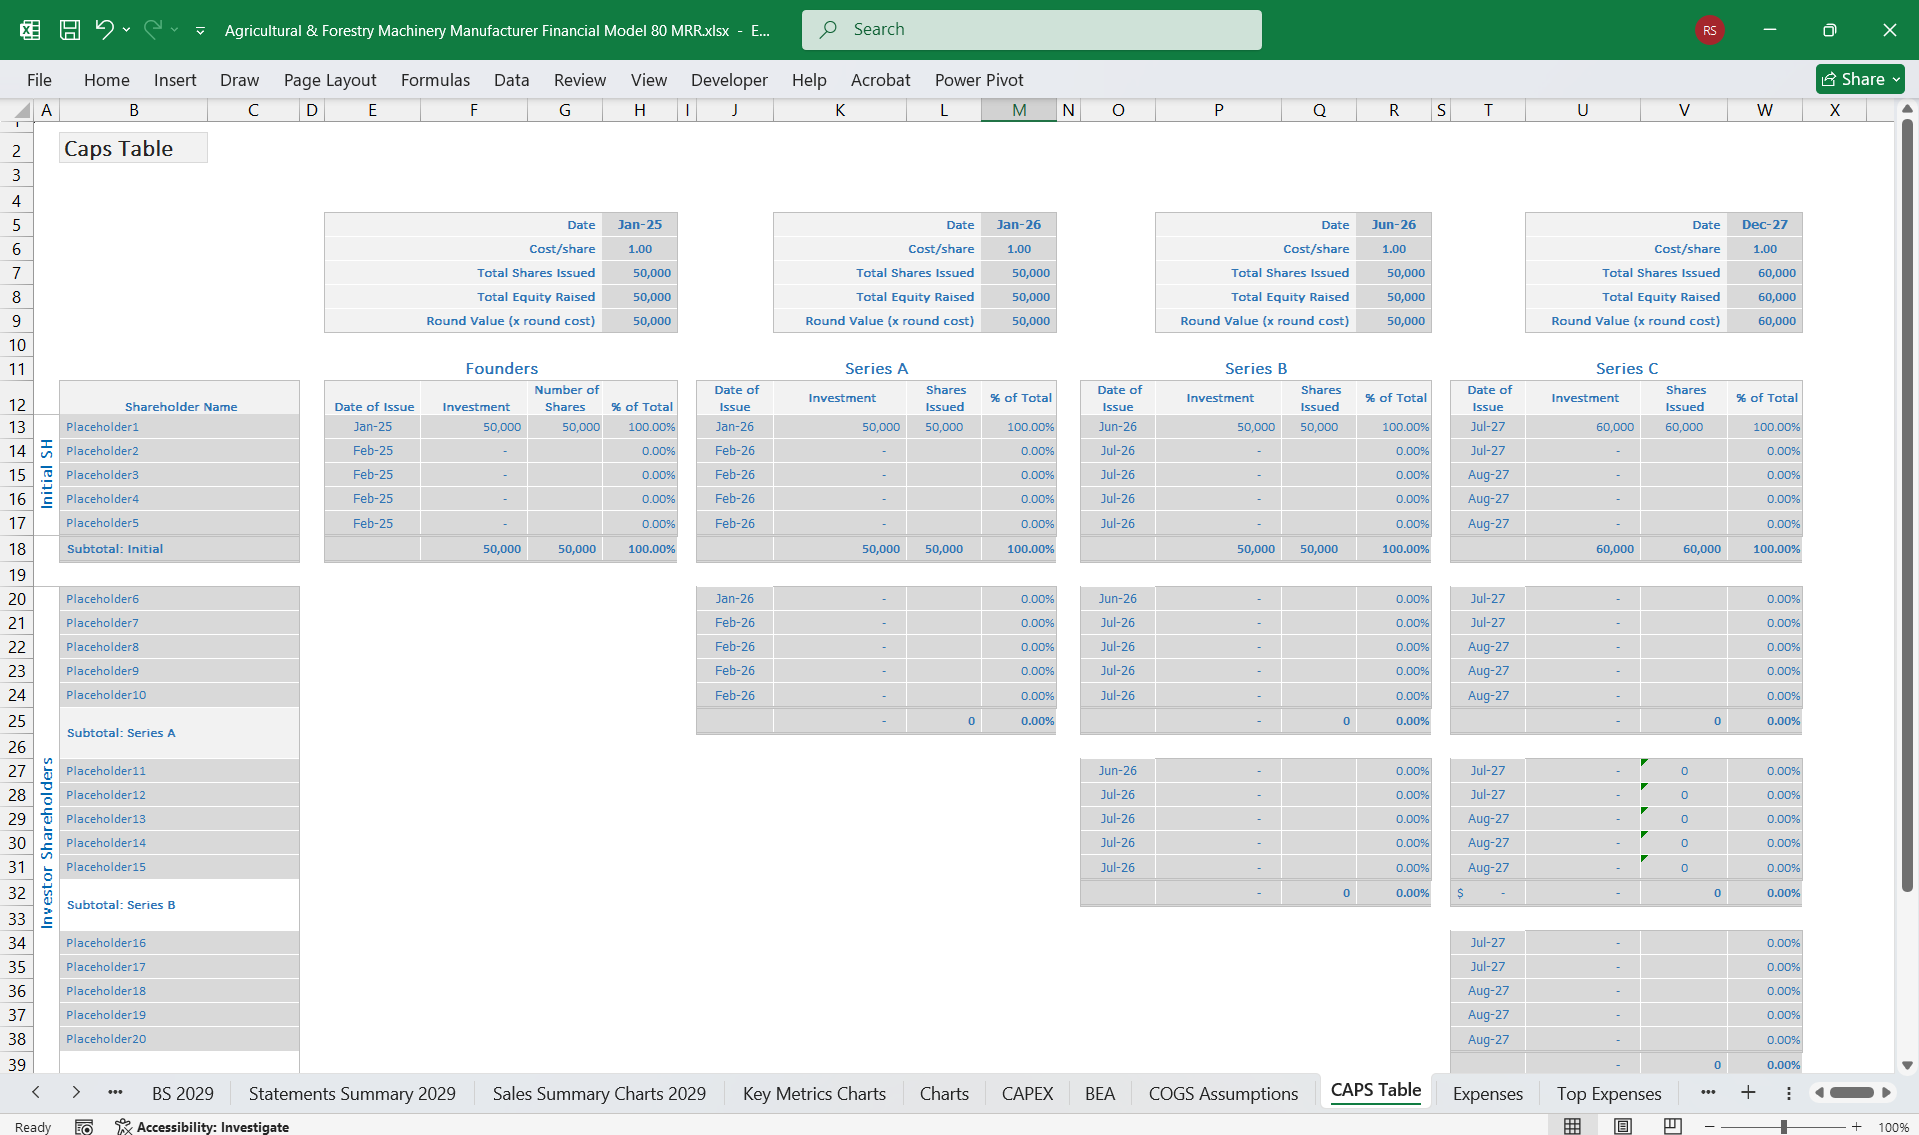
- Equity contributions for developing next-gen technology.
- Outflows:
- Interest payments on loans.
- Dividends to shareholders.
- Operating Cash Flow: Cash generated by core operations.
- Free Cash Flow (FCF): Available funds after capital expenditures for growth or return to investors.
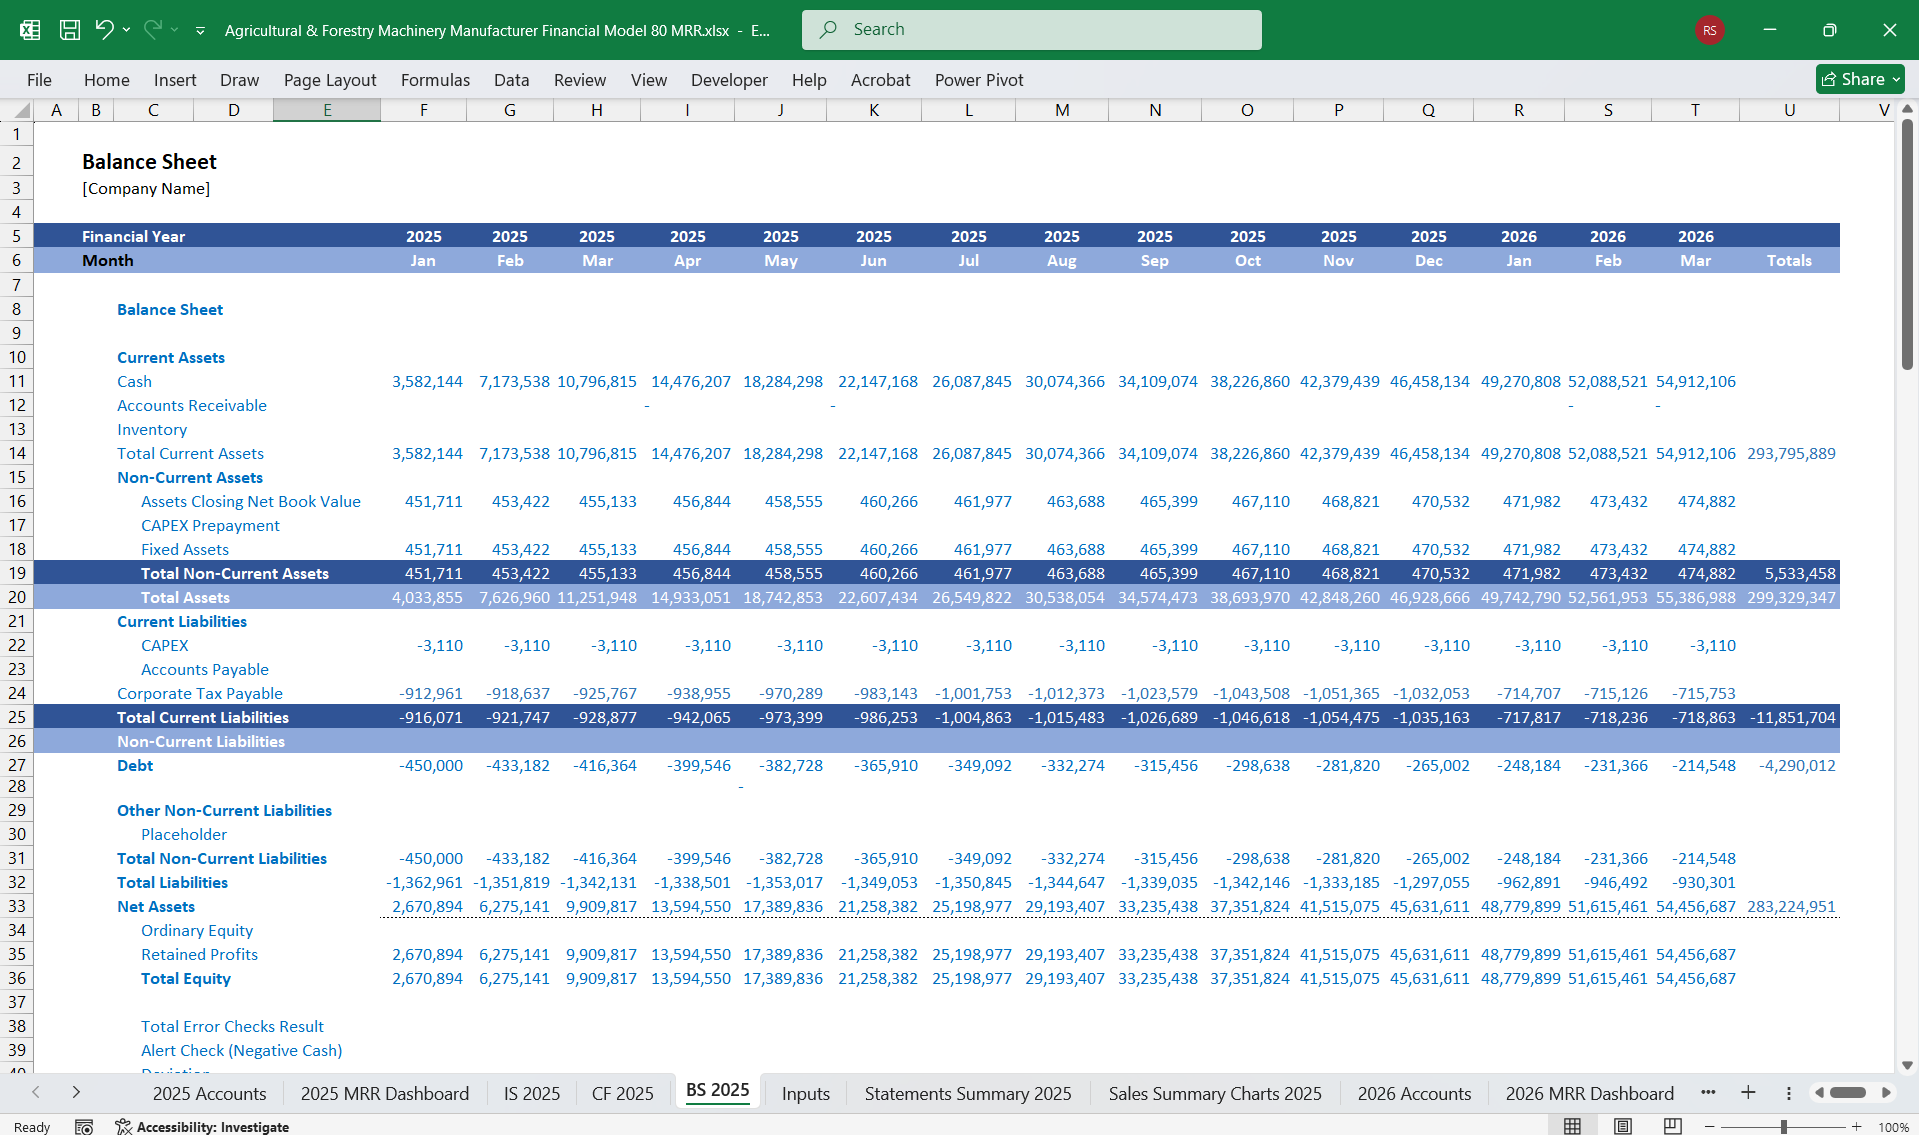
- Current Assets:
- Cash and cash equivalents for day-to-day operations.
- Accounts receivable from dealers or rental customers.
- Inventory of raw materials, spare parts, and finished goods.
- Non-Current Assets:
- Machinery and facilities for manufacturing and quality control.
- Intangible assets like patents and R&D advancements.
- Current Liabilities:
- Accounts payable to suppliers.
- Short-term loan obligations.
- Non-Current Liabilities:
- Long-term loans for facility expansions.
- Lease liabilities for machinery or fleet vehicles.
- Retained earnings for reinvestment into R&D or operational expansion.
- Shareholder contributions for scaling production lines.
80 Product Lines
Covers an extensive range to capture niche markets and enable geographic diversification.
- Revenue Growth:
- Adds specialized machinery like wood debarkers or high-capacity harvesters.
- Tailors offerings for markets with unique farming and forestry needs.
- Operational Challenges:
- Higher COGS due to diverse materials sourcing and added complexity in production.
- Higher inventory costs.
- Margins:
- Gross Margin: ~45-50%.
- Net Margin: ~15-20%.
Tier Structure
- Tier 1 (Basic Monitoring):
- Access to telematics data for equipment performance.
- Tier 2 (Proactive Maintenance):
- Scheduled servicing notifications.
- Discounts on routine parts and consumables.
- Tier 3 (Operational Analytics):
- Performance optimization insights for farming or forestry applications.
- Detailed efficiency reporting.
- Tier 4 (Remote Diagnostics):
- Remote issue resolution support and technical advice.
- Priority customer support.
- Tier 5 (Enterprise Fleet Management):
- Centralized telematics dashboard for fleet management.
- Usage reports and asset tracking.
- Tier 6 (Custom Integration):
- Advanced automation or AI features for large agricultural enterprises.
- Full equipment integration with enterprise resource planning (ERP) systems.
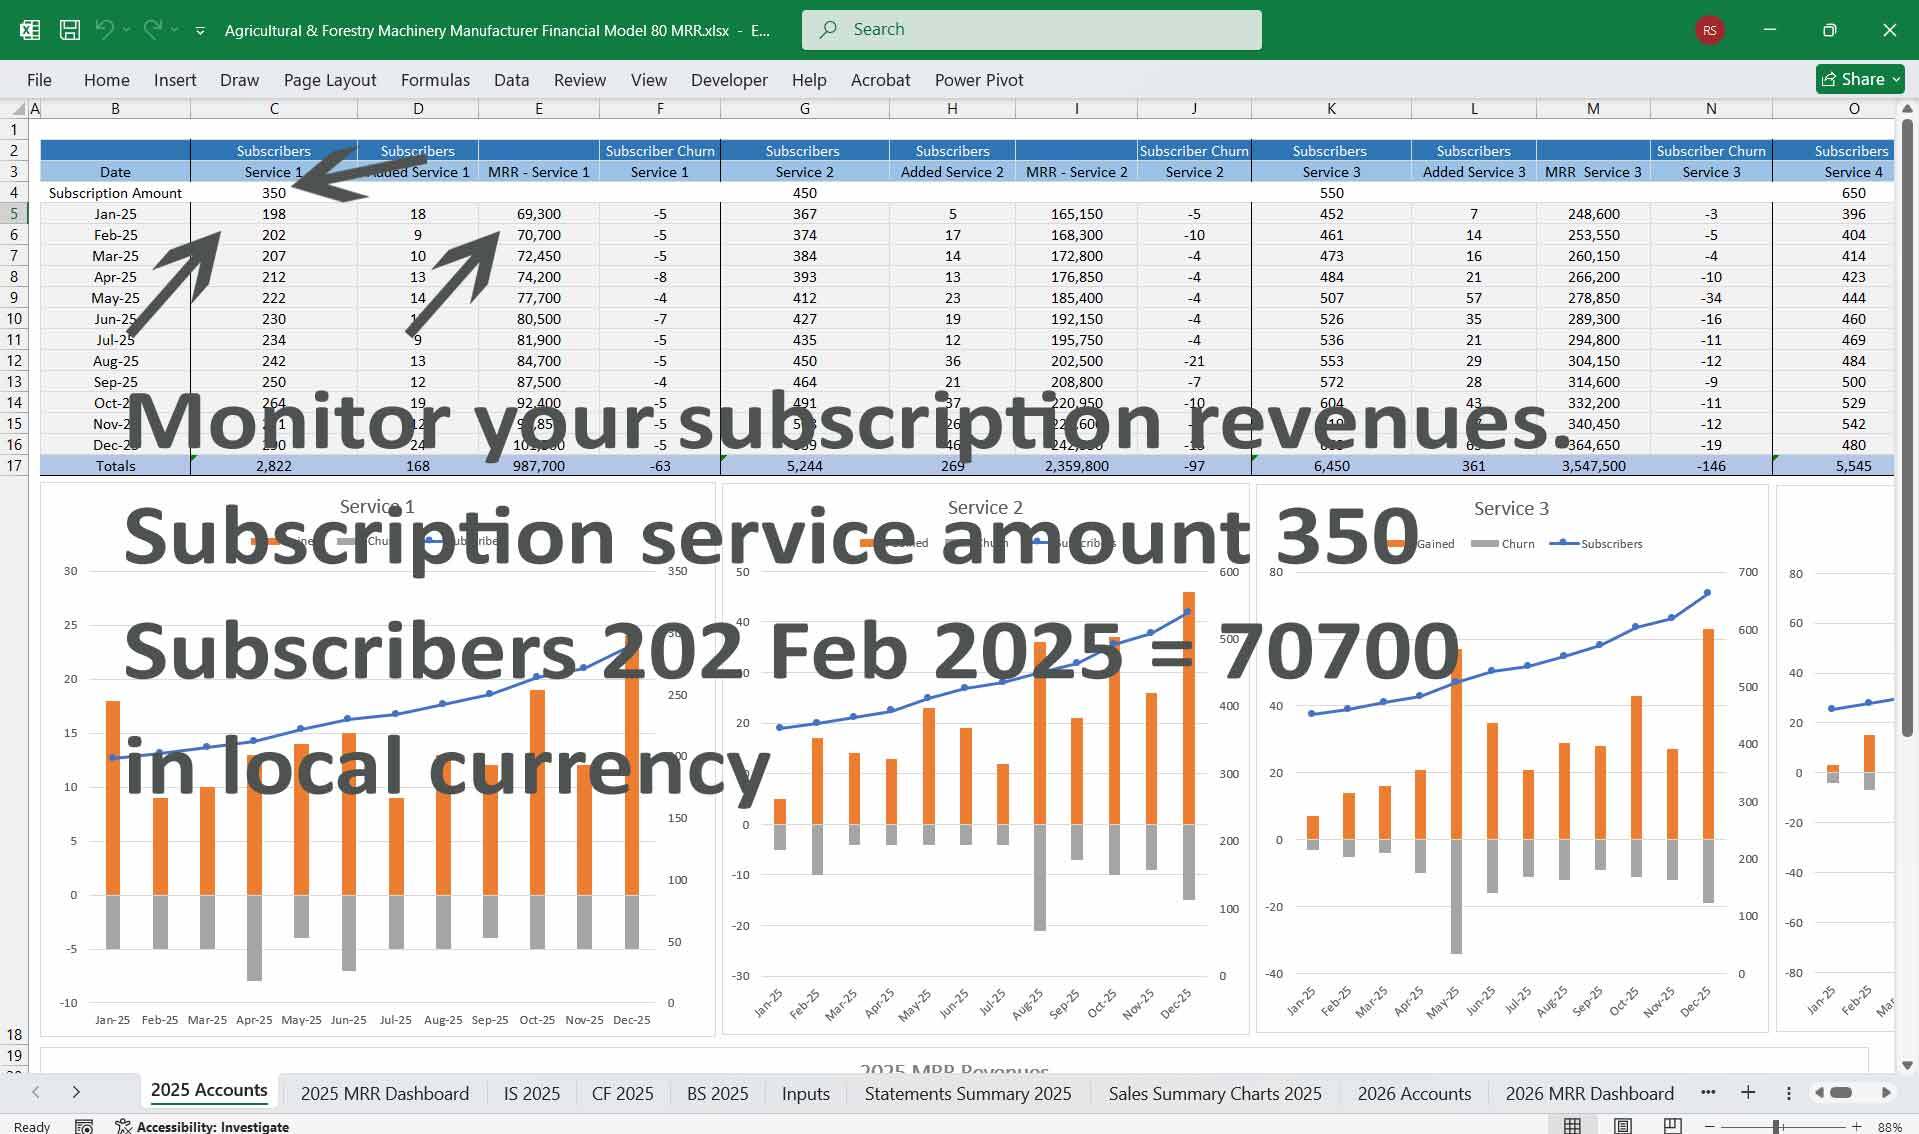
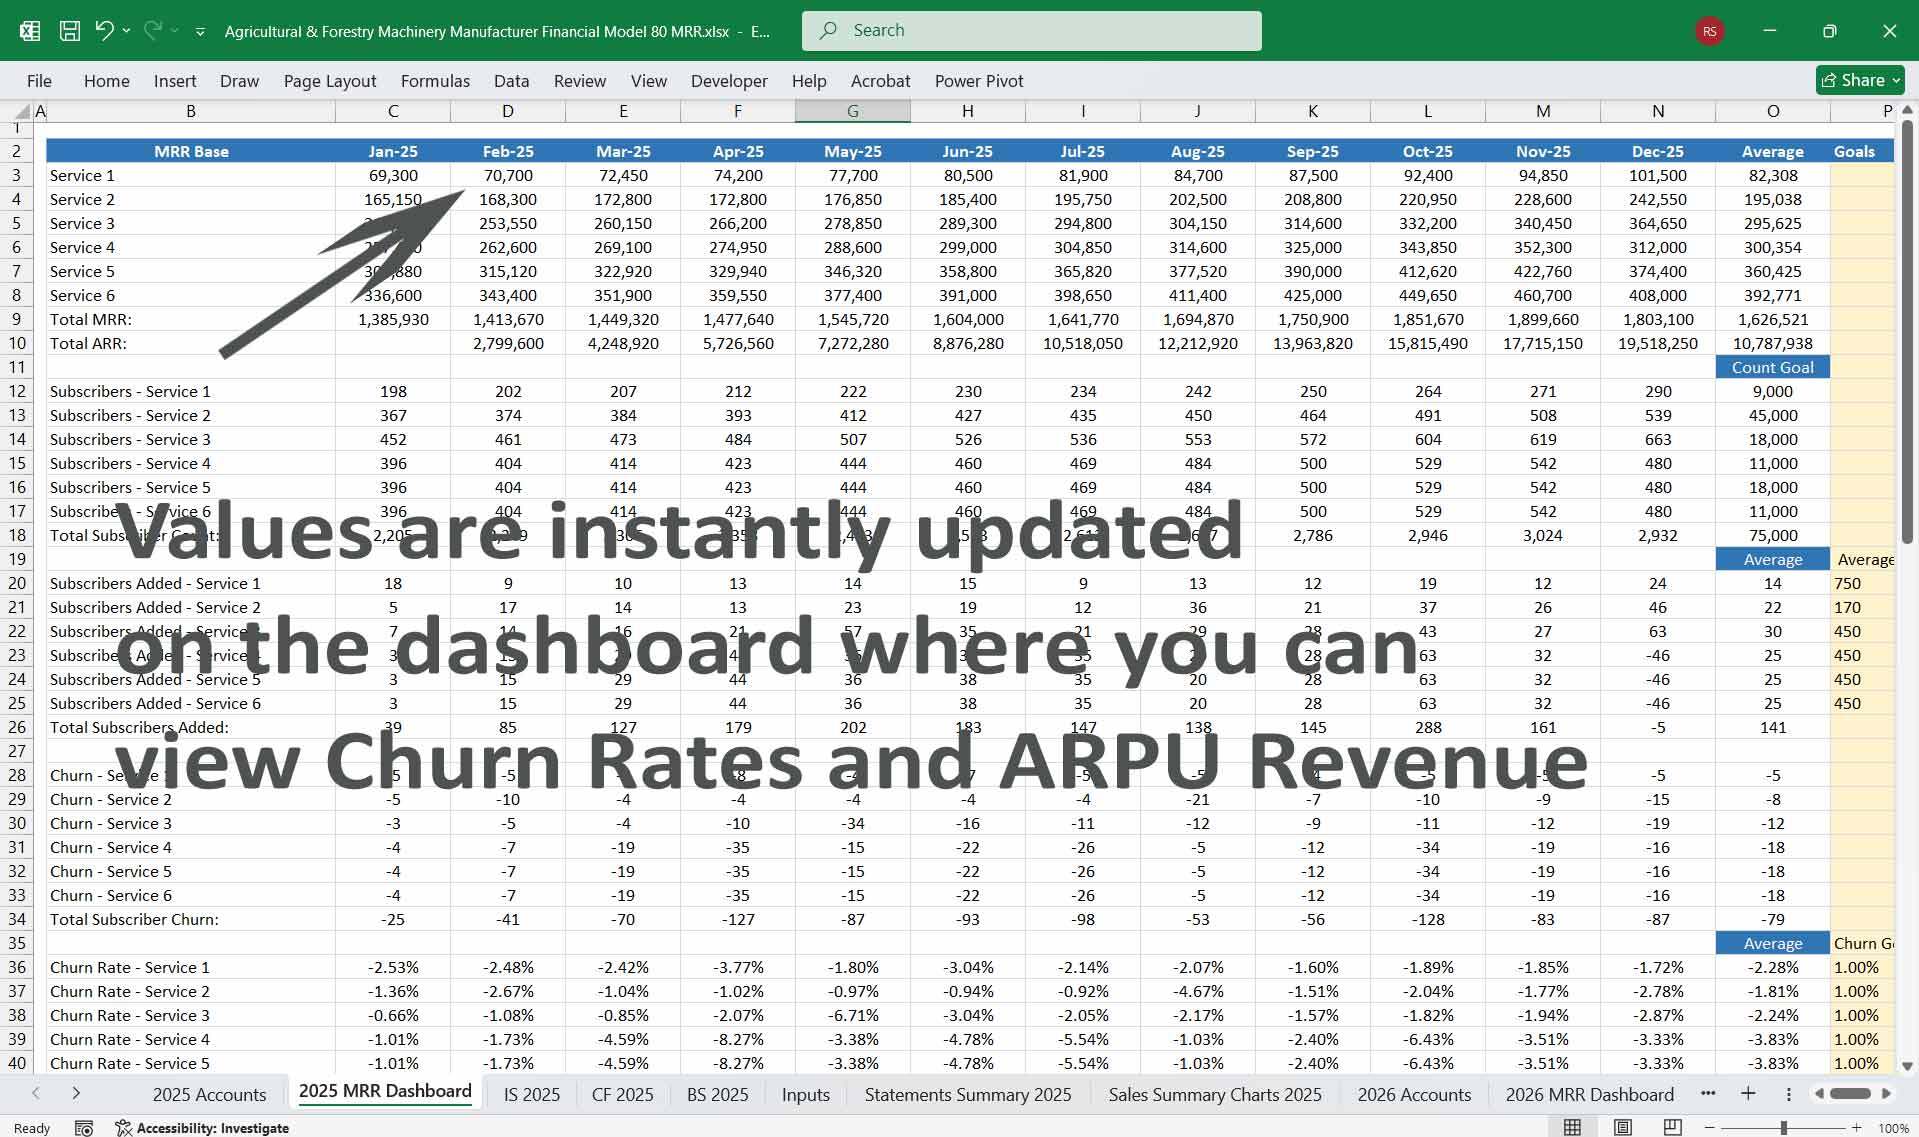
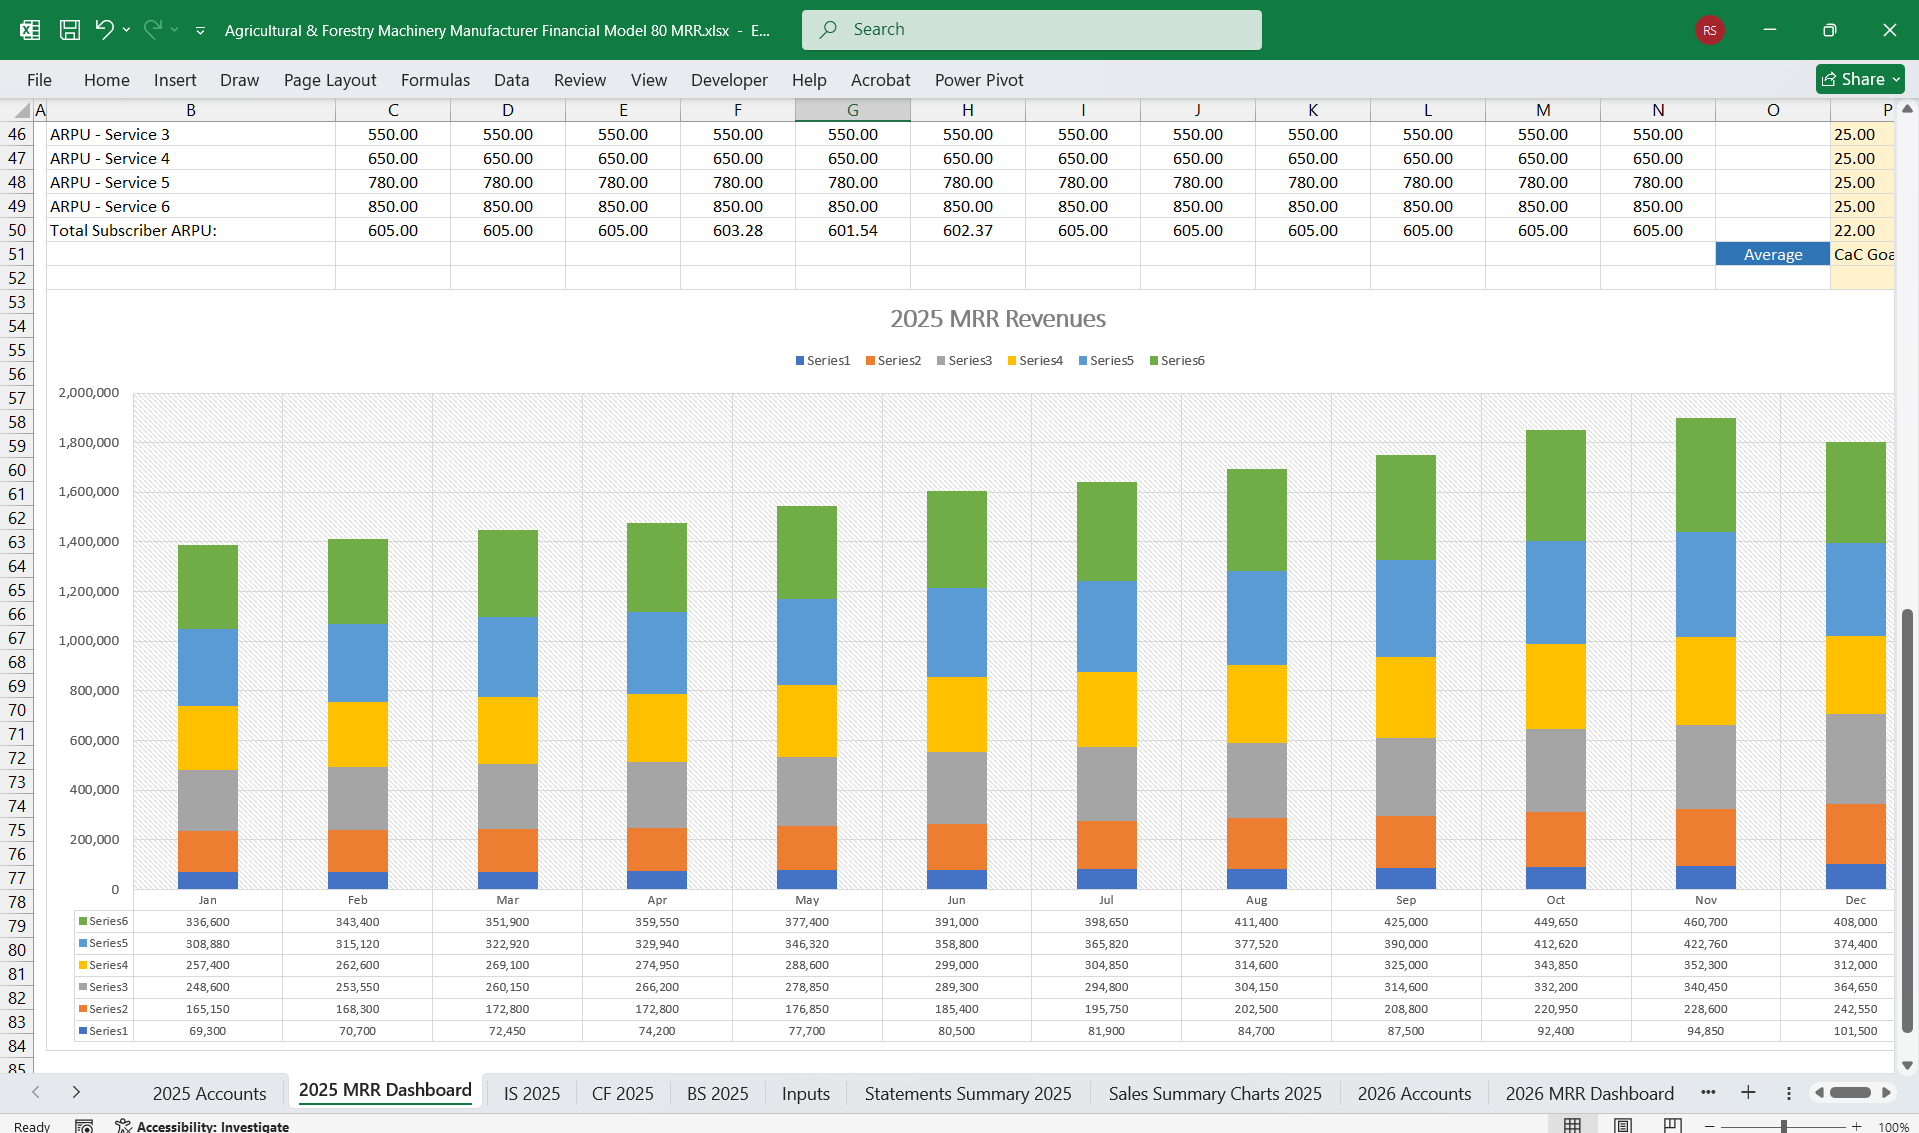
- Monthly Recurring Revenue (MRR): Total monthly revenue from active subscriptions.
- Annual Recurring Revenue (ARR): Projected yearly subscription income.
- Customer Retention and LTV: Ensures long-term profitability.
- Churn Rate: Percentage of canceled subscriptions.
- Operational Efficiency:
- Plant utilization rates.
- Production cycle time per machinery type.
- Sales and Marketing KPIs:
- Customer acquisition cost (CAC).
- Dealer conversion rates.
- Subscription KPIs:
- Average revenue per user (ARPU).
- Subscription upgrade and downgrade ratios.
- Financial performance with 80 product lines.
- Subscription-based revenue contribution under high vs. low penetration scenarios.
This Best Practice includes
1 Excel Financial Model
Further information
Provides thorough oversight, tracking, and reporting of Agricultural (Farming) & Forestry Machinery Manufacturer finances, including updates on budget utilisation and projections.
