


Originally published: 29/11/2021 14:46
Publication number: ELQ-66416-1
View all versions & Certificate
Publication number: ELQ-66416-1
View all versions & Certificate

Book Keeping Agency Excel Financial Model
The Bookkeeping Agency Financial model amalgamates and forecasts a detailed company’s income statement, balance sheet, and cash flow statements.
Our mission is to be the industrial leader and pioneer in our business domainFollow 17
accountingcashflowbookkeepingfinancial informationbookkeeping templateaccounting agencyfinancial planbusiness plan
Description
# Book Keeping Agency Excel Financial Model
Financial service is a quite large industry and bookkeeping is one of the active segments of the businesses. Opening a Bookkeeping Agency might be an interesting and easy task but make it profitable would be a difficult one. This requires a lot of effort and strategies, but the ultimate goal of any bookkeeping agency will achieve sound and feasible financial growth. This BookKeeping Agency Financial Model contains all relevant input tables and charts that will allow you to make feasible business decisions bases on accurate reporting and financials.
# Introduction Of Our Book Keeping Agency Excel Financial Model
The Bookkeeping Financial model contains the three financial statements including the cash flows and calculates the relevant metrics (Break-even Analysis, Diagnostic Tools, Project evaluation, and Charts). The financing options for the project include a standard long-term loan as well as an investment made by the investors and of course marketing sheet (include automated inbound and outbound marketing costs sheet which also contains how many customers will achieve as a result).
# Key Inputs of Book Keeping Agency Excel Financial Model
1: The growth rate Price and Expense.
2: Tuition Fee-Related Revenue Assumptions.
3: Bus Revenue Assumptions.
4: Cafetaria Revenue.
5: School Capacity & Land Assumptions.
6: Marketing Budget Sheet (which measures how many customers we get from marketing).
7: Average Payable and Receivable days your business is following.
8: Cost of Goods.
9: Fixed Asset and Capital Expenditure.
10: Tax Rate.
11: Investment table.
12: Loan table.
# Key Features of Book Keeping Agency Excel Financial Model
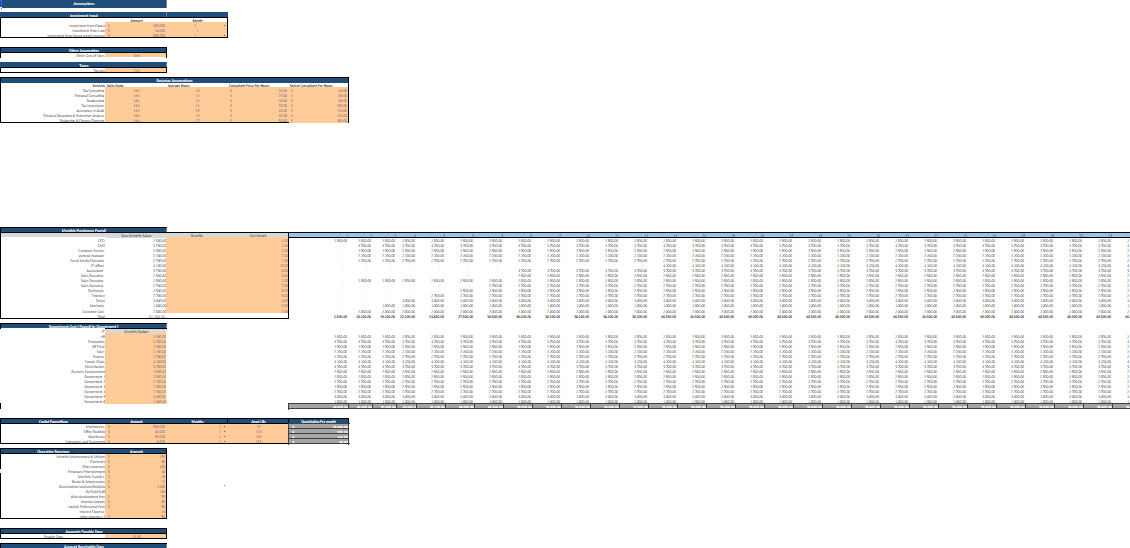
1: Input Sheet
This financial model template contains inputs that, when changed, impact the calculations and, therefore, the changes are applied to all relevant sheets. This financial model always has built-in flexibility to display different outcomes or final calculations based on this sheet’s changes.
2: Startup Summary
A start-up summary tab includes the total cost incurred at the start of business and capital expenditure, how much cash injected by the company so far, and based on the number of months the amount of investment required is calculated.
A Startup Summary helps you take a realistic view of your idea and double-check whether it’s the business has enough funds to support operations.
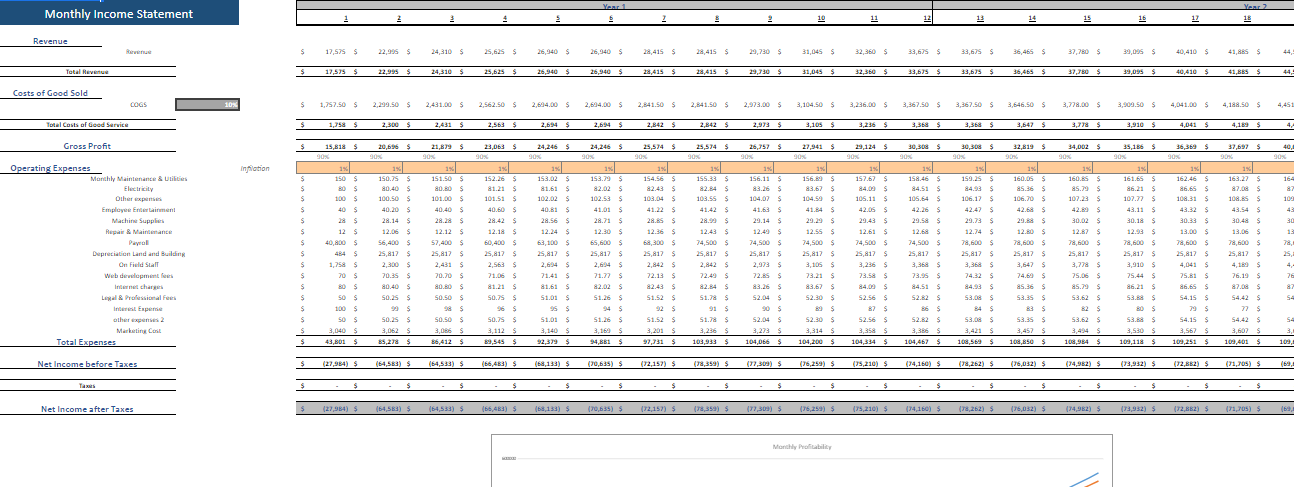
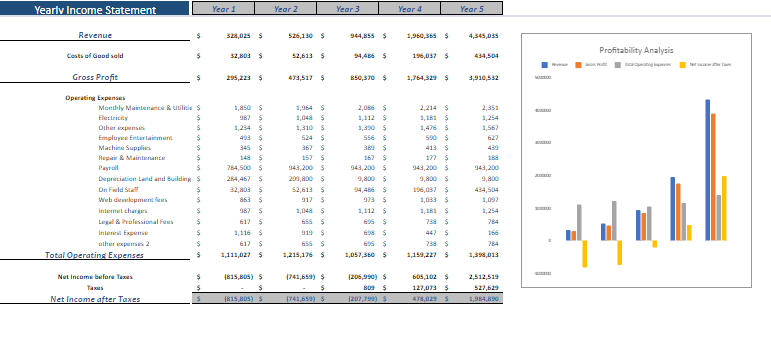
3: Monthly & Yearly Income Statement
The Bookkeeping Agency Financial Model provides the monthly as well as yearly income statement structure and a framework for creating a full corporate forecasting model tailored to your particular business.
A key feature of the Bookkeeping Agency Financial Model is that it is “integrated,” which simply means that the Income Statement is modeled in a way that accurately captures the connection and inter-linkages of the various line business items. An integrated financial model is powerful since it enables the Financial Model user to change any assumption in one part of the statement in order to see how it impacts all other parts of the statements accurately and consistently.
The monthly Income Statement sheet of the Bookkeeping Agency Financial Model is perfect for those who require regular reporting and details. Additionally, Income Statement contains all revenue streamlines with gross earnings, net earnings linked with a revenue analysis sheet to ensure accurate reporting.
Oak Business Consultants understands every School business’s goal. Therefore, we have developed a mechanism that helps business owners determine whether they are making profits or otherwise.
Furthermore, the Yearly Income Statement gives you complete insights into revenue and general & administrative expenses. The Yearly Income Statement also contains several graphs, assumptions, ratios, margins, net profit, earnings, cost of services, and profit after tax.
4: Balance Sheet
This balance sheet enables you to analyze your position of current assets, fixed assets, liabilities, and equity. This also allows you to monitor your accounts receivable, accounts payable, accrued expenses, etc. Therefore this specific, financial model gives you the perfect space to analyze your key financial balance accounts.
5: Cash Flow Statement
The Cash Flow Statement is the vital part of the three statements that report the cash spent and generated during a specific period. The Cash Flow Statements act as a bridge between the income statement and balance sheet by how money has moved in and out of the business.
#Three main sections of the Cash flow Statement:
1: Operating Activities: We have included all cash in and out related to the operations of the business.
2: Investing Activities: A cash from the disposal or an acquisition of an will include in this section.
3: Financing Activities: We have separately made a loan-related tab where you can enter all loan-related information thee. The tab is linked to Financing Activities of Cash flow Statement.
The Cash Flow Statement in our Model contains a dedicated sheet to monitor and analyze your company cash-ins and out. This cash flow statement is based on several key inputs, such as Payable and Receivable Days, yearly income, working capital, long-term debt, net cash, etc. This calculation then computes your net cash flow, beginning and end cash balances. This is a perfect template for your company’s cash flow management.
6: Break-Even Analysis
A break-even analysis can help you measure how different scenarios might play out financially. For example, if you increase the marketing budget or add another employee to the payroll, how many extra sales will be needed to recover that additional expense?
We have included a Break-even analysis in our Financial Model which will help the user to determine sales. The break-even analysis will help you know at a glance, the profits generated at the various sales levels. The Break-Even Analysis is the point where your total sales contribution refers to fixed cost at zero profit and loss. This Technique is primarily based on marginal costing, which behaves differently at various levels of output activity.
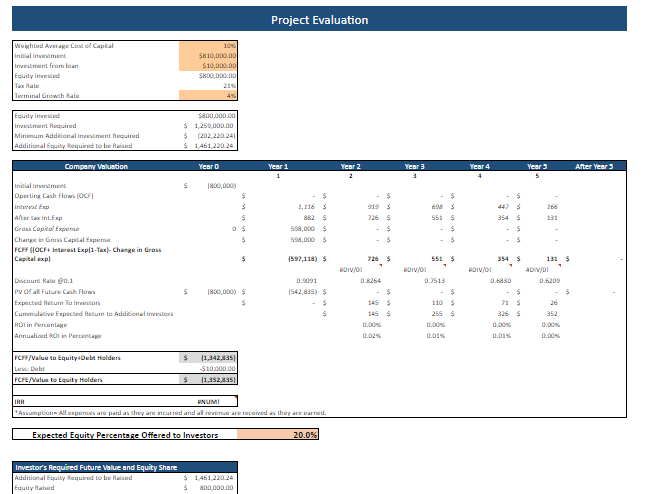
7: Project Evaluation
Since the table calculates Return on Investment, Investor’s Future Equity Share, and Cash Burn Rate Analysis, analyzing the company’s performance becomes easy to capture potential investors.
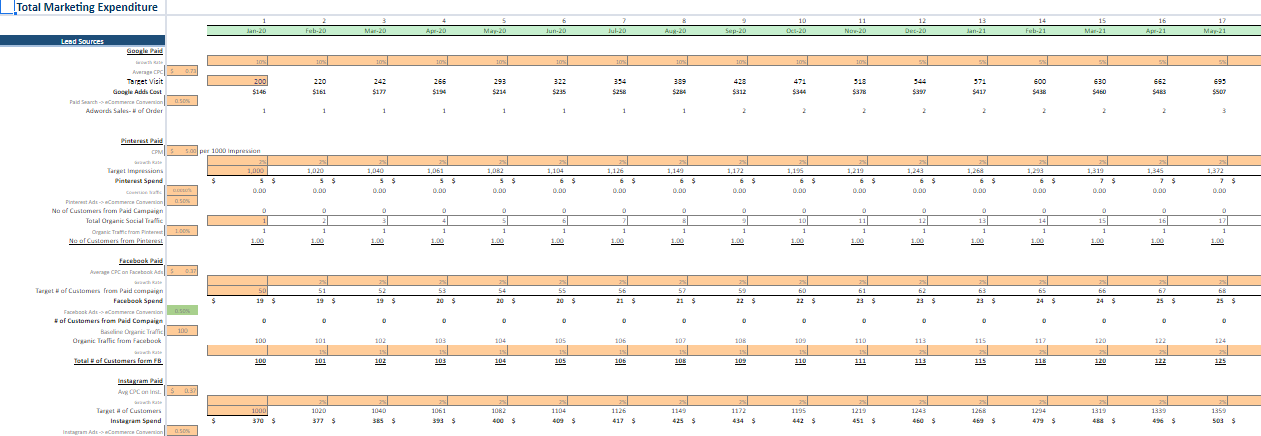
8: Marketing Budget Sheet
A marketing budget sheet added with all possible marketing channels. The Sheet tells you how many expected customers you will have with different channels. For example, spending $2000 on Facebook marketing will bring 1,000 active customers. To make this more accurate the user will require to enter conversion rates from the internet.
9: Diagnostic Sheet
This Diagnostic sheet is a new inclusion to our financial model. This automatically explains the condition of the business. For example, if your company’s profit is 30% of the total sales. The sheet will include favorable comments (As mentioned above in the picture). The comments automatically connected to the numbers of financial data in the income statement, balance sheet, and Cash flow. The Diagnostic Sheet is very helpful to give the company’s insights in just one line.
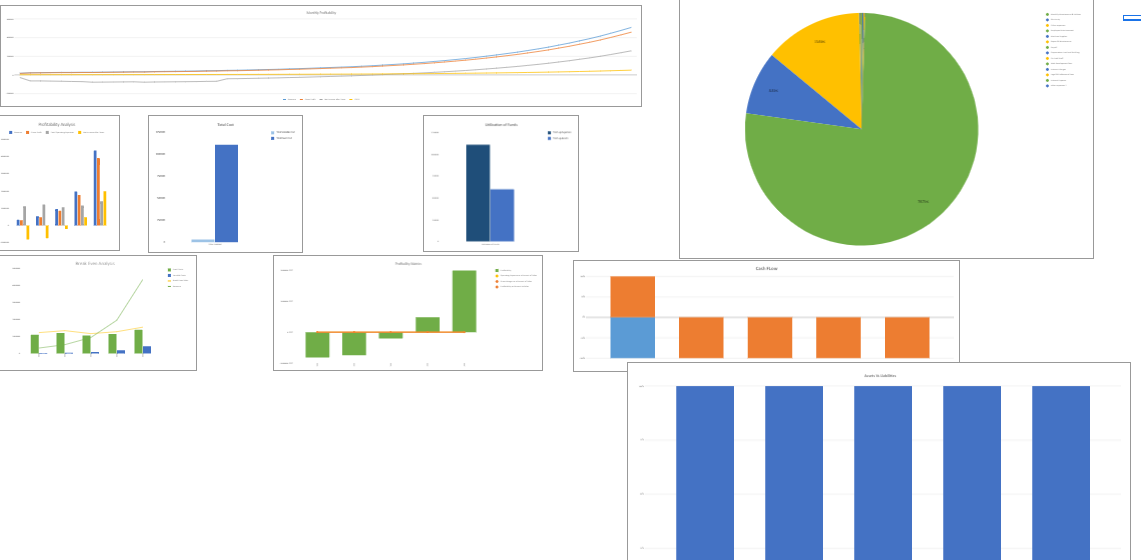
10: Dashboard
Users and readers respond and process visual graphs better than data. Furthermore, This dashboard provides you a graphical management tool that enables you to track all your relevant financial KPIs, improve cash flow management, and track expenses, sales, and net revenue in detail to meet and outperform the financial objectives of your business.
# How To Use Book Keeping Agency Excel Financial Model
For the purpose of making this model easy to use, Oak Business Consultant has designed this Excel Financial Model with maximum care. Each cell has a color code, and the input areas are all highlighted in peach color.
The User is only required to input data in color cells. All other cells are either helping calculations or results of the model. Therefore there is no need to change any other cell except colored cells.
# More About Financial Modelling
Contact our expert if you are confused about buying our template. The experts can provide you a 15 min DEMO of the financial model.
# About Us
Oak Financial Model is a combination of financial and data analytics. For this, we have strong skills in math, financial analysis, accountancy, management performance indicators, and organize this data into the dashboard for clients.
# Our Mission
Our mission is to be the enterprise chief in our commercial enterprise domain, which comes after an in-intensity evaluation of the marketplace scenario and ever-changing business trends We agree that economic and commercial enterprise consultancy calls for a whole knowledge of the non-stop modifications withinside the marketplace and economic system and its outcomes on commercial enterprise.
# Our Vision
Our Vision is to be reputed as the best Financial & Management Services Consultants by providing top-notch services and to create goodwill based on an excellent performance.
# Our Core Values
Our enterprise motto is derived from the fact that High Quality surpasses Quantitative work and with that in mind we strive for a disciplined approach to analyze the business situations and identify the best solutions to achieve the financial plans. In the same time, we help in opening new doors by providing our state of the art financial services, and management tools.
# Book Keeping Agency Excel Financial Model
Financial service is a quite large industry and bookkeeping is one of the active segments of the businesses. Opening a Bookkeeping Agency might be an interesting and easy task but make it profitable would be a difficult one. This requires a lot of effort and strategies, but the ultimate goal of any bookkeeping agency will achieve sound and feasible financial growth. This BookKeeping Agency Financial Model contains all relevant input tables and charts that will allow you to make feasible business decisions bases on accurate reporting and financials.
# Introduction Of Our Book Keeping Agency Excel Financial Model
The Bookkeeping Financial model contains the three financial statements including the cash flows and calculates the relevant metrics (Break-even Analysis, Diagnostic Tools, Project evaluation, and Charts). The financing options for the project include a standard long-term loan as well as an investment made by the investors and of course marketing sheet (include automated inbound and outbound marketing costs sheet which also contains how many customers will achieve as a result).
# Key Inputs of Book Keeping Agency Excel Financial Model
1: The growth rate Price and Expense.
2: Tuition Fee-Related Revenue Assumptions.
3: Bus Revenue Assumptions.
4: Cafetaria Revenue.
5: School Capacity & Land Assumptions.
6: Marketing Budget Sheet (which measures how many customers we get from marketing).
7: Average Payable and Receivable days your business is following.
8: Cost of Goods.
9: Fixed Asset and Capital Expenditure.
10: Tax Rate.
11: Investment table.
12: Loan table.
# Key Features of Book Keeping Agency Excel Financial Model
1: Input Sheet
This financial model template contains inputs that, when changed, impact the calculations and, therefore, the changes are applied to all relevant sheets. This financial model always has built-in flexibility to display different outcomes or final calculations based on this sheet’s changes.
2: Startup Summary
A start-up summary tab includes the total cost incurred at the start of business and capital expenditure, how much cash injected by the company so far, and based on the number of months the amount of investment required is calculated.
A Startup Summary helps you take a realistic view of your idea and double-check whether it’s the business has enough funds to support operations.
3: Monthly & Yearly Income Statement
The Bookkeeping Agency Financial Model provides the monthly as well as yearly income statement structure and a framework for creating a full corporate forecasting model tailored to your particular business.
A key feature of the Bookkeeping Agency Financial Model is that it is “integrated,” which simply means that the Income Statement is modeled in a way that accurately captures the connection and inter-linkages of the various line business items. An integrated financial model is powerful since it enables the Financial Model user to change any assumption in one part of the statement in order to see how it impacts all other parts of the statements accurately and consistently.
The monthly Income Statement sheet of the Bookkeeping Agency Financial Model is perfect for those who require regular reporting and details. Additionally, Income Statement contains all revenue streamlines with gross earnings, net earnings linked with a revenue analysis sheet to ensure accurate reporting.
Oak Business Consultants understands every School business’s goal. Therefore, we have developed a mechanism that helps business owners determine whether they are making profits or otherwise.
Furthermore, the Yearly Income Statement gives you complete insights into revenue and general & administrative expenses. The Yearly Income Statement also contains several graphs, assumptions, ratios, margins, net profit, earnings, cost of services, and profit after tax.
4: Balance Sheet
This balance sheet enables you to analyze your position of current assets, fixed assets, liabilities, and equity. This also allows you to monitor your accounts receivable, accounts payable, accrued expenses, etc. Therefore this specific, financial model gives you the perfect space to analyze your key financial balance accounts.
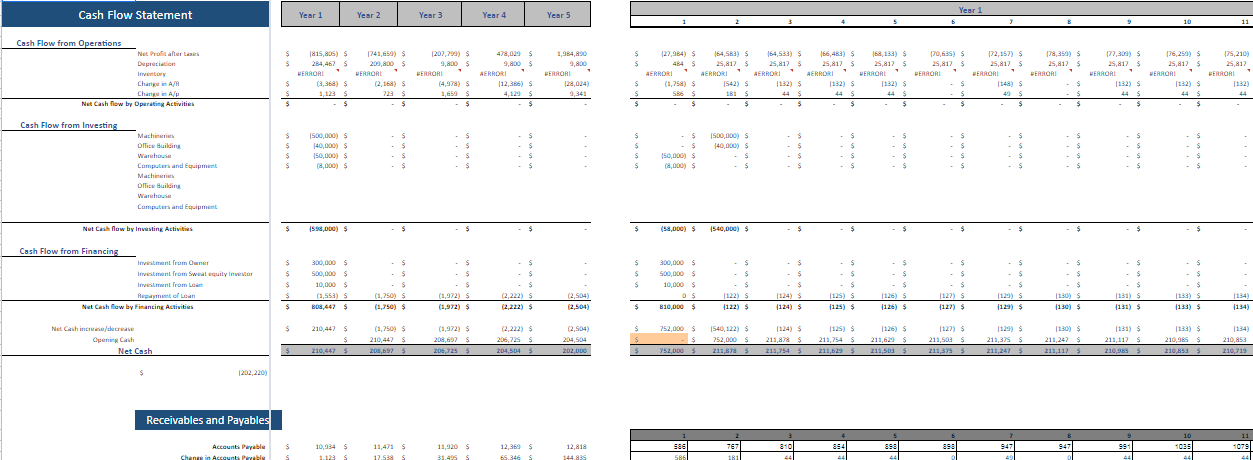
5: Cash Flow Statement
The Cash Flow Statement is the vital part of the three statements that report the cash spent and generated during a specific period. The Cash Flow Statements act as a bridge between the income statement and balance sheet by how money has moved in and out of the business.
#Three main sections of the Cash flow Statement:
1: Operating Activities: We have included all cash in and out related to the operations of the business.
2: Investing Activities: A cash from the disposal or an acquisition of an will include in this section.
3: Financing Activities: We have separately made a loan-related tab where you can enter all loan-related information thee. The tab is linked to Financing Activities of Cash flow Statement.
The Cash Flow Statement in our Model contains a dedicated sheet to monitor and analyze your company cash-ins and out. This cash flow statement is based on several key inputs, such as Payable and Receivable Days, yearly income, working capital, long-term debt, net cash, etc. This calculation then computes your net cash flow, beginning and end cash balances. This is a perfect template for your company’s cash flow management.
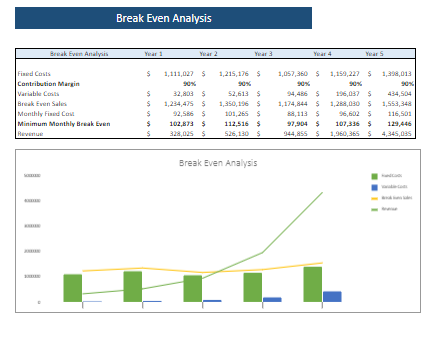
6: Break-Even Analysis
A break-even analysis can help you measure how different scenarios might play out financially. For example, if you increase the marketing budget or add another employee to the payroll, how many extra sales will be needed to recover that additional expense?
We have included a Break-even analysis in our Financial Model which will help the user to determine sales. The break-even analysis will help you know at a glance, the profits generated at the various sales levels. The Break-Even Analysis is the point where your total sales contribution refers to fixed cost at zero profit and loss. This Technique is primarily based on marginal costing, which behaves differently at various levels of output activity.
7: Project Evaluation
Since the table calculates Return on Investment, Investor’s Future Equity Share, and Cash Burn Rate Analysis, analyzing the company’s performance becomes easy to capture potential investors.
8: Marketing Budget Sheet
A marketing budget sheet added with all possible marketing channels. The Sheet tells you how many expected customers you will have with different channels. For example, spending $2000 on Facebook marketing will bring 1,000 active customers. To make this more accurate the user will require to enter conversion rates from the internet.
9: Diagnostic Sheet
This Diagnostic sheet is a new inclusion to our financial model. This automatically explains the condition of the business. For example, if your company’s profit is 30% of the total sales. The sheet will include favorable comments (As mentioned above in the picture). The comments automatically connected to the numbers of financial data in the income statement, balance sheet, and Cash flow. The Diagnostic Sheet is very helpful to give the company’s insights in just one line.
10: Dashboard
Users and readers respond and process visual graphs better than data. Furthermore, This dashboard provides you a graphical management tool that enables you to track all your relevant financial KPIs, improve cash flow management, and track expenses, sales, and net revenue in detail to meet and outperform the financial objectives of your business.
# How To Use Book Keeping Agency Excel Financial Model
For the purpose of making this model easy to use, Oak Business Consultant has designed this Excel Financial Model with maximum care. Each cell has a color code, and the input areas are all highlighted in peach color.
The User is only required to input data in color cells. All other cells are either helping calculations or results of the model. Therefore there is no need to change any other cell except colored cells.
# More About Financial Modelling
Contact our expert if you are confused about buying our template. The experts can provide you a 15 min DEMO of the financial model.
# About Us
Oak Financial Model is a combination of financial and data analytics. For this, we have strong skills in math, financial analysis, accountancy, management performance indicators, and organize this data into the dashboard for clients.
# Our Mission
Our mission is to be the enterprise chief in our commercial enterprise domain, which comes after an in-intensity evaluation of the marketplace scenario and ever-changing business trends We agree that economic and commercial enterprise consultancy calls for a whole knowledge of the non-stop modifications withinside the marketplace and economic system and its outcomes on commercial enterprise.
# Our Vision
Our Vision is to be reputed as the best Financial & Management Services Consultants by providing top-notch services and to create goodwill based on an excellent performance.
# Our Core Values
Our enterprise motto is derived from the fact that High Quality surpasses Quantitative work and with that in mind we strive for a disciplined approach to analyze the business situations and identify the best solutions to achieve the financial plans. In the same time, we help in opening new doors by providing our state of the art financial services, and management tools.
This Best Practice includes
Excel File
