

Originally published: 05/04/2023 15:08
Publication number: ELQ-98289-1
View all versions & Certificate
Publication number: ELQ-98289-1
View all versions & Certificate

Bar Financial Model Excel Template
This template contains input sheets, Supporting details including the calculations of operating expenses, payroll, depreciation, loan, and working capital.
Our mission is to be the industrial leader and pioneer in our business domainFollow 17
Description
Bar Financial Model Excel Template
The bar industry is a large and profitable market, with a projected size of over 35 billion dollars in 2023. However, due to low barriers to entry and high competition, starting a bar startup requires careful consideration and planning, including future projections and investment to cover initial expenses. The Bar Financial Model Excel Template is an effective tool that can help you achieve this. This template allows you to estimate future projections for your company based on the inputs you provide.
In addition, the Bar Financial Model Excel Template estimates expenses so you can determine how much revenue should be set aside to cover those expenses. The model also helps identify investment requirements and your company's actual value. If you find that your company's value is low, you can take corrective action before seeking investment.
The Bar Financial Model Excel Template has several sheets that serve different purposes, including:
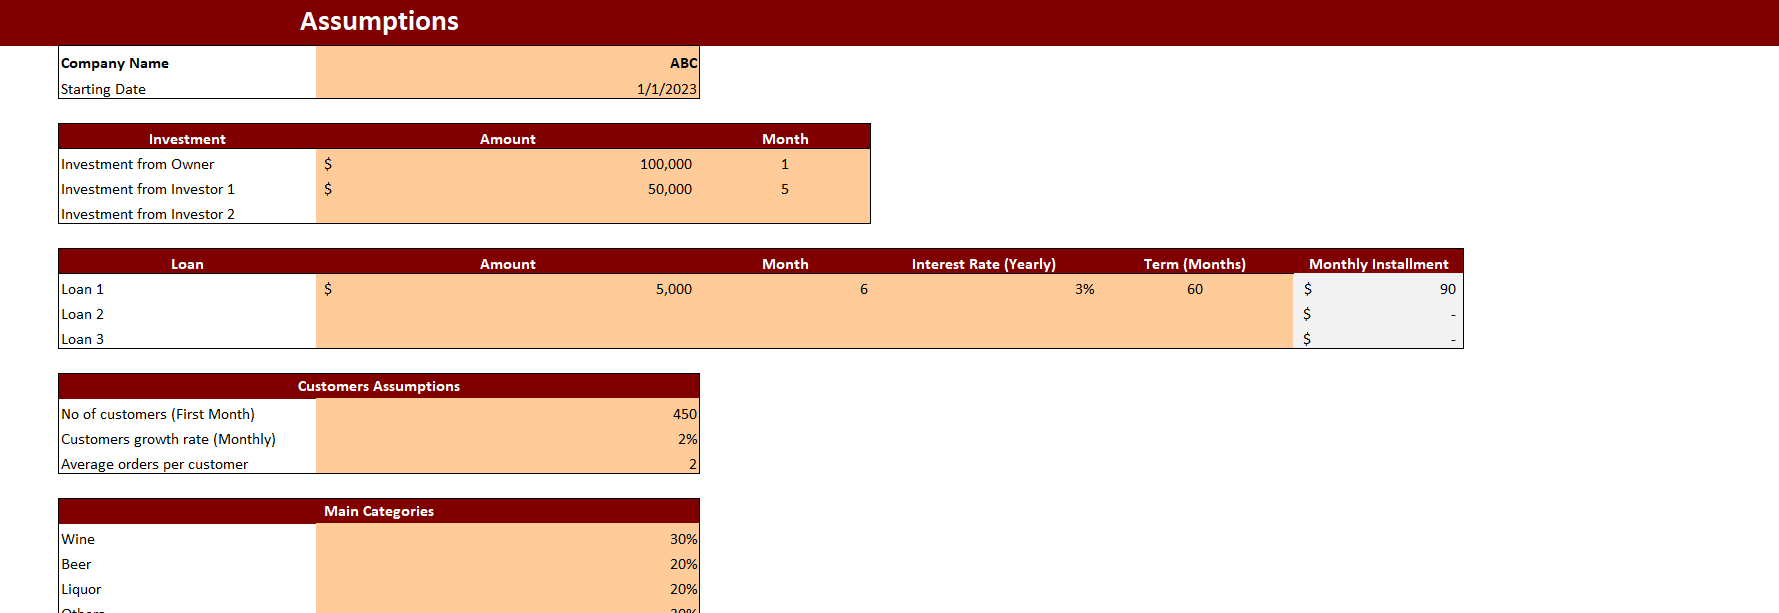
Assumptions
The Assumption sheet is the foundation of the entire model, containing data related to investments, loans, revenue, and cost assumptions. To obtain accurate results, enter the data in peach-filled columns, and the model will automatically update the calculations as you enter the input data.
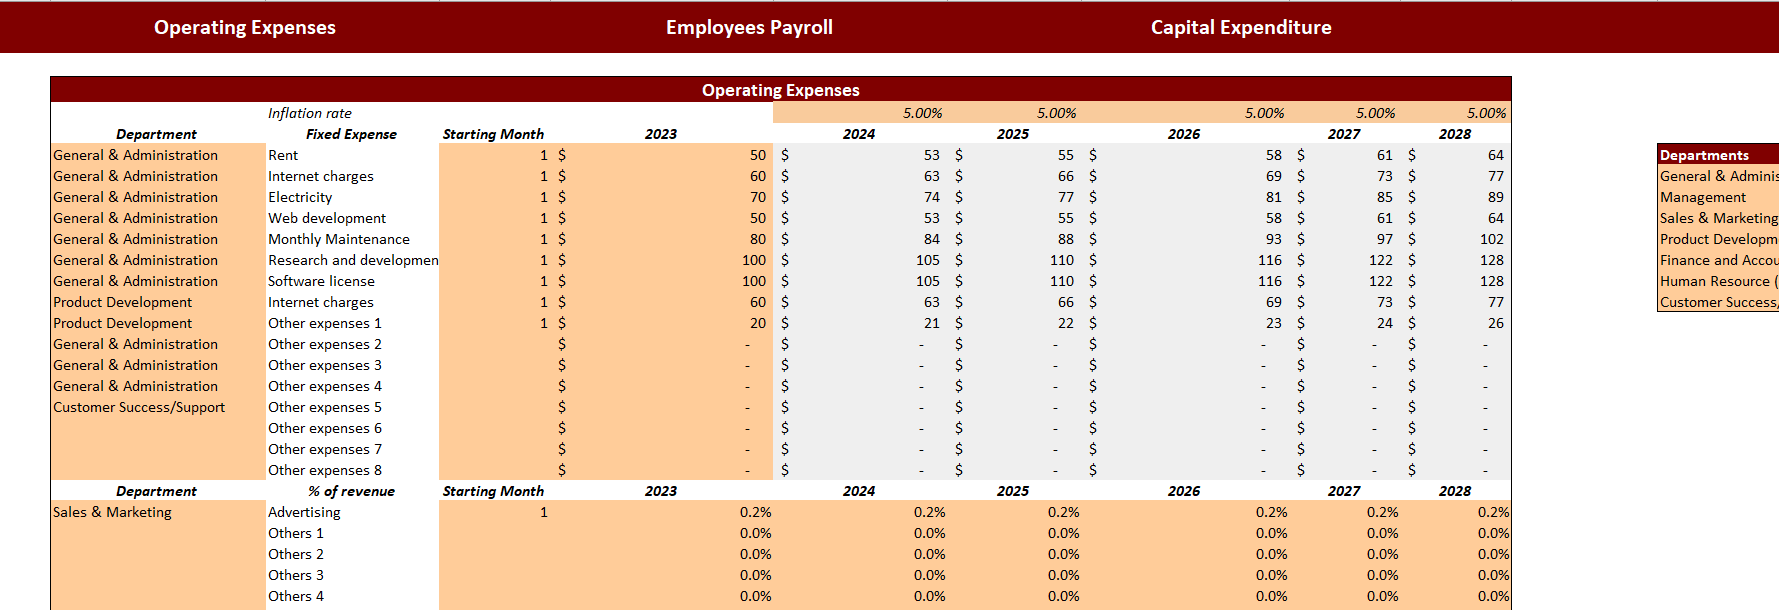
Expenses-Input
The expenses-input sheet contains assumptions related to operating expenses, employee payroll, and capital expenditure. Enter the data in peach-filled columns only.
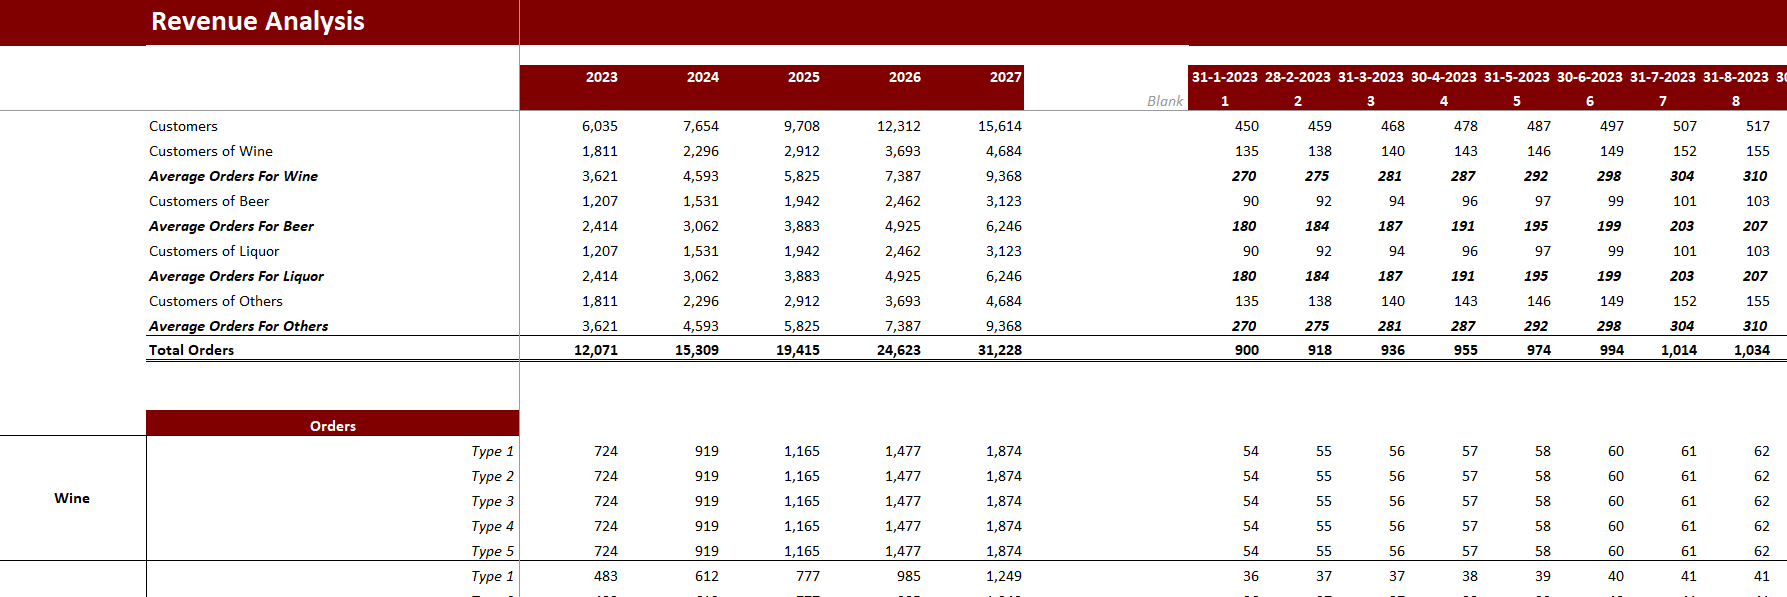
Revenue Analysis
The revenue analysis sheet estimates customers and orders for different categories, revenue, and cost of goods sold for each product under each category. At the end of the sheet, yearly category-wise revenue and cost of goods sold are summarized.
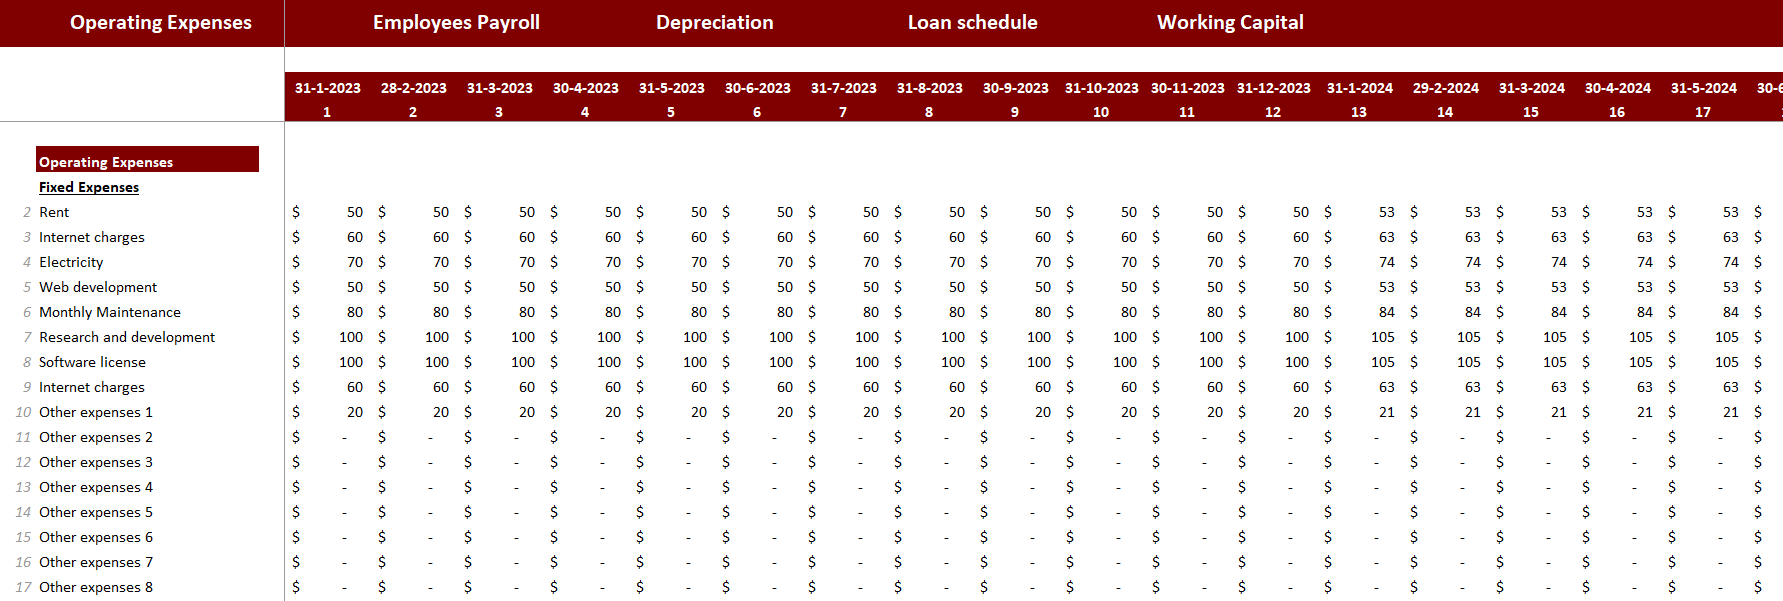
Supporting Details
The supporting detail sheet contains all the calculations needed to make the financial statement, including operating expenses, employee payroll, depreciation, loan, and working capital calculation.
Financial Statements
The Financial Statement sheet includes three main financial statements: income statement, cash flow statement, and balance sheet. The calculations are done monthly and yearly.
Income Statement
The income statement estimates the company's profitability, and it incorporates profitability margins from gross profit margin to net profit margin in percentage terms.
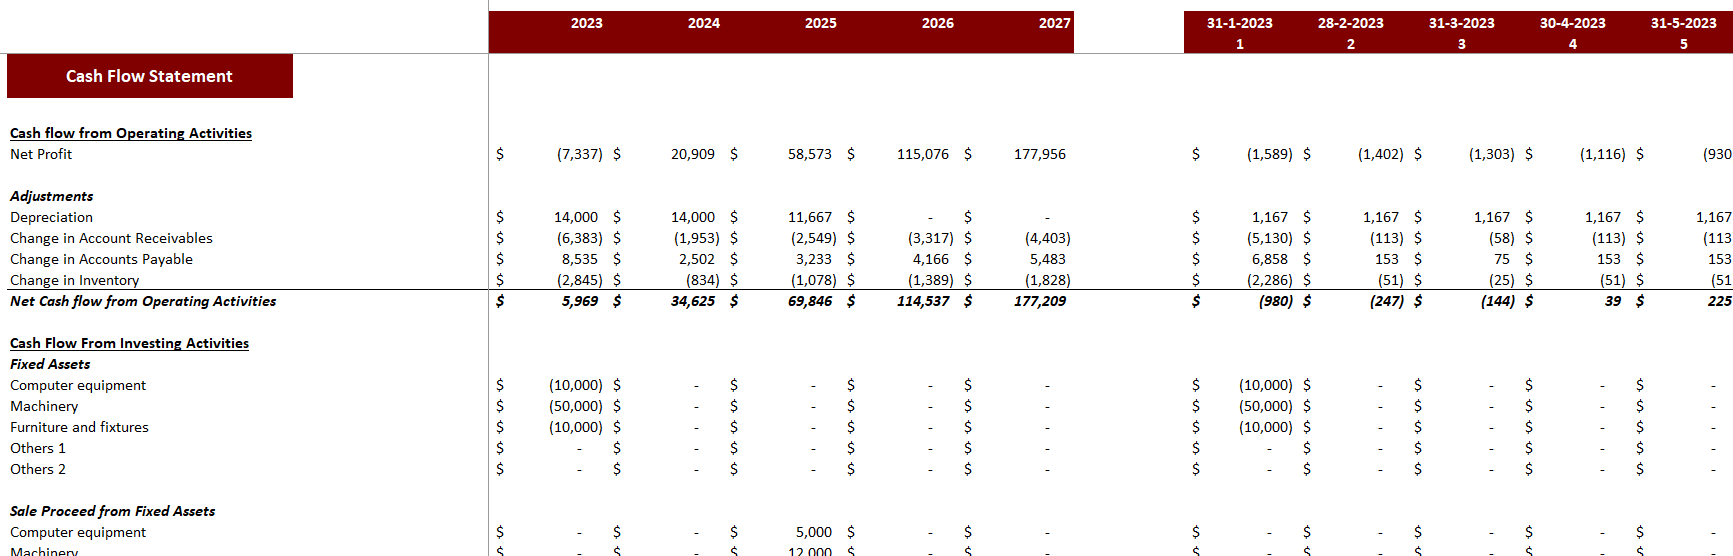
Cashflow Statement
The Cashflow Statement estimates the cash inflow and outflow in your company and evaluates how efficiently your company manages its cash position.
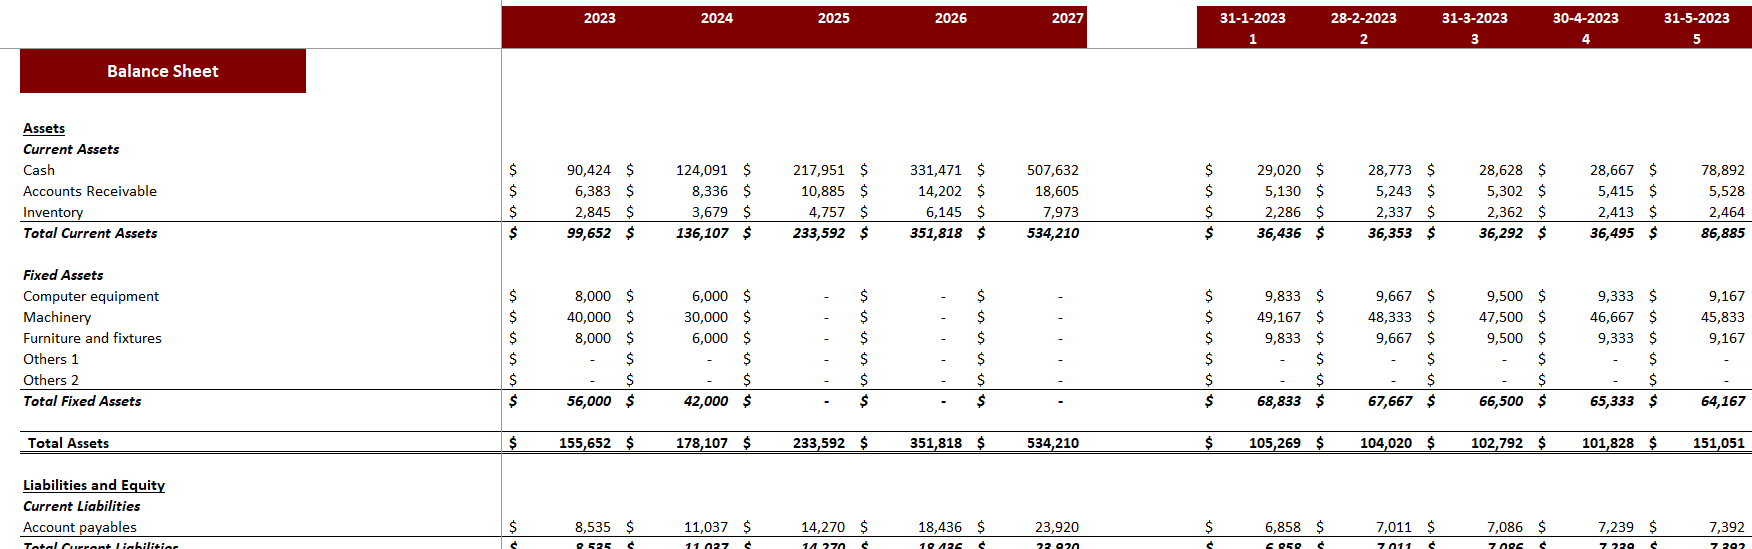
Balance Sheet
The balance sheet summarizes a business, giving you the company’s financial position, such as how many assets, liabilities, and equity your company has.
Financial Analysis
The Financial Analysis section estimates the following:
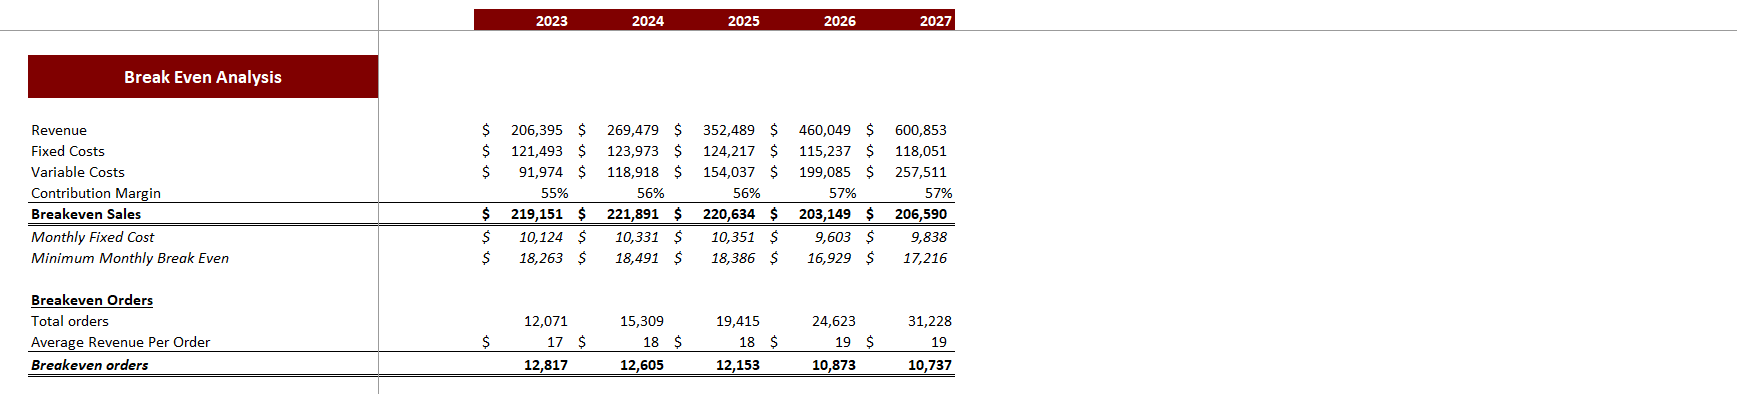
Breakeven Analysis
The breakeven analysis estimates the sales needed to reach the no-profit, no-loss situation.
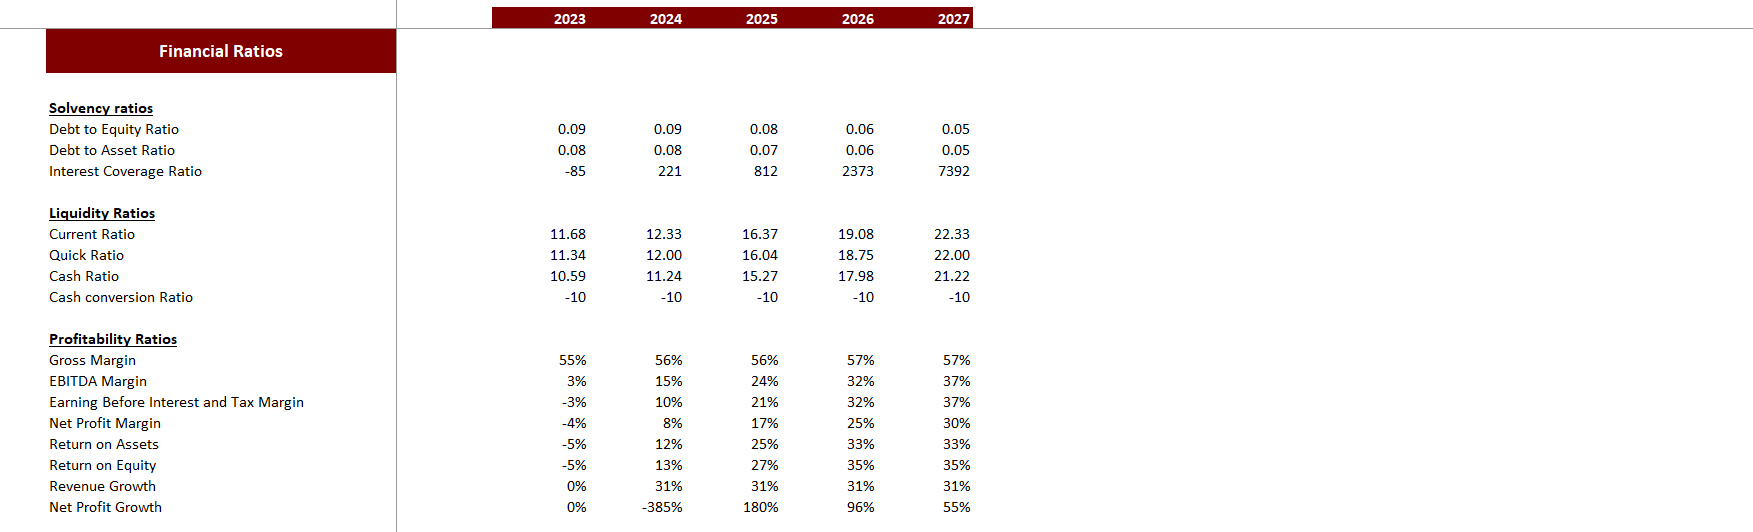
Financial Ratios
The Financial Ratio section estimates solvency, liquidity, profitability, and efficiency ratios to better understand the company's performance. You can also compare your ratios with industry benchmarks.
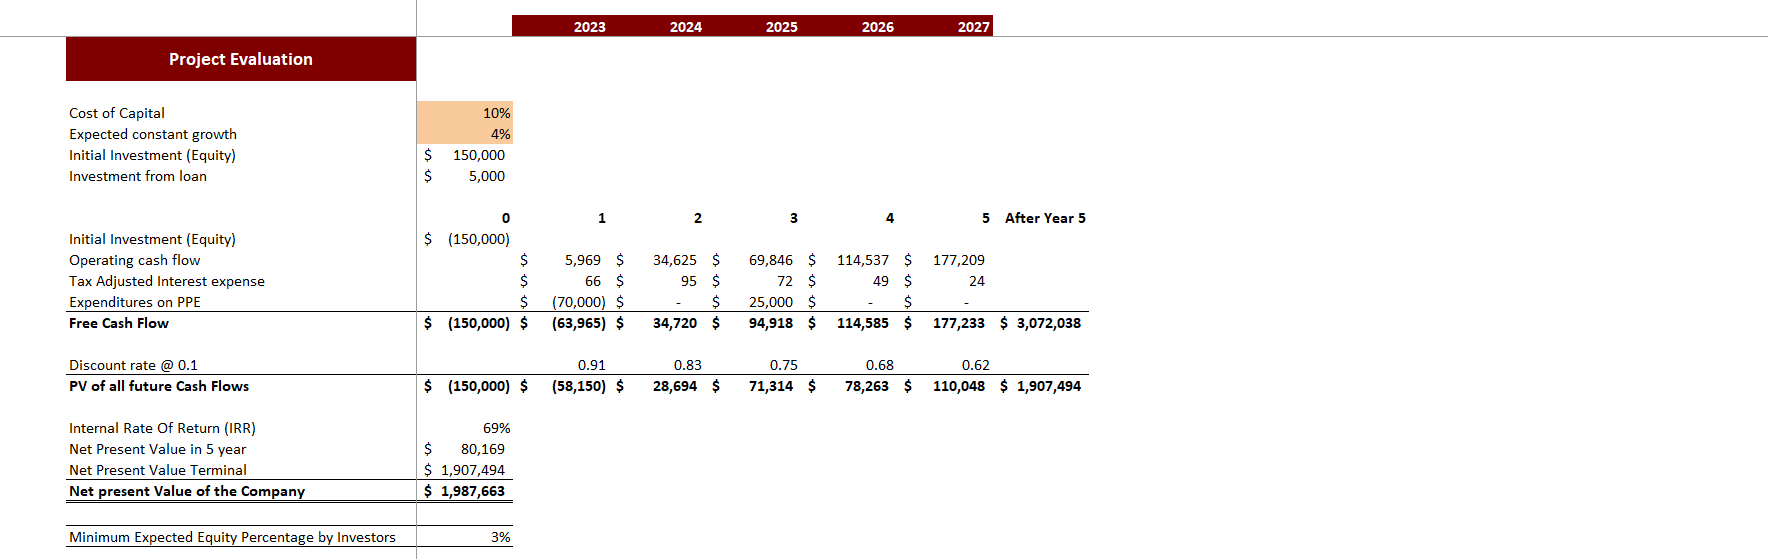
Project Evaluation
The Project Evaluation estimates the Net present value of the company, Internal rate of return, minimum expected equity percentage by investors, investors' required future value, and payback period.
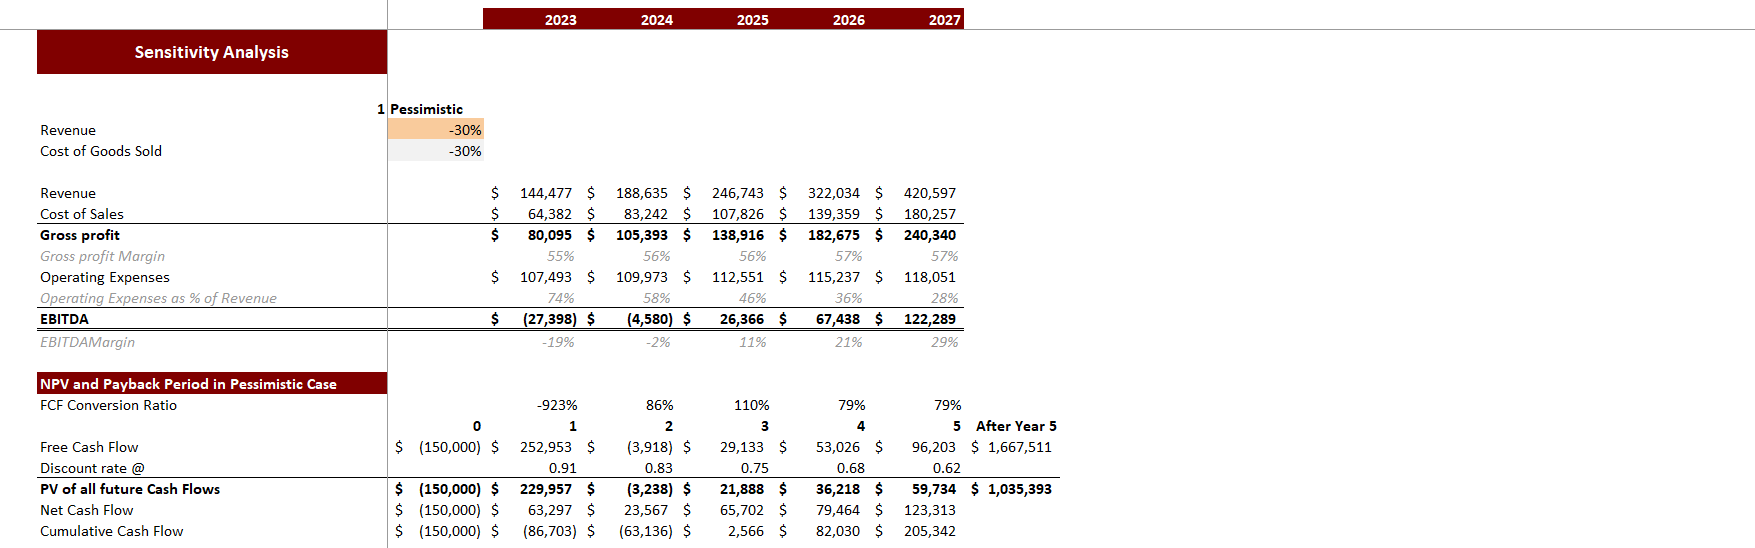
Sensitivity Analysis
The sensitivity analysis estimates the company's income statement heads, NPV, and the Payback period when revenue and cost of goods sold are changed while keeping the same expense plan. Additionally, the sensitivity analysis is done in two ways pessimistic and optimistic.
Dashboard
The dashboard provides a graphical representation of your company's performance. Average gross profit, net profit, and revenue growth are also included in the dashboard to understand your business’s profitability better.
Advantages of this model
Cost-Effective: The model is cost-effective, and you don't need to hire financial experts for financial modeling tasks for your startups.
Investor-Friendly: All related investor metrics are present. It provides valuation and performance analysis charts. Therefore, investors will appreciate the complete transparency of the financial model while considering investing in your business.
Properly Integrated: The model assumptions and calculation have proper integration.
Bar Financial Model Excel Template
The bar industry is a large and profitable market, with a projected size of over 35 billion dollars in 2023. However, due to low barriers to entry and high competition, starting a bar startup requires careful consideration and planning, including future projections and investment to cover initial expenses. The Bar Financial Model Excel Template is an effective tool that can help you achieve this. This template allows you to estimate future projections for your company based on the inputs you provide.
In addition, the Bar Financial Model Excel Template estimates expenses so you can determine how much revenue should be set aside to cover those expenses. The model also helps identify investment requirements and your company's actual value. If you find that your company's value is low, you can take corrective action before seeking investment.
The Bar Financial Model Excel Template has several sheets that serve different purposes, including:
Assumptions
The Assumption sheet is the foundation of the entire model, containing data related to investments, loans, revenue, and cost assumptions. To obtain accurate results, enter the data in peach-filled columns, and the model will automatically update the calculations as you enter the input data.
Expenses-Input
The expenses-input sheet contains assumptions related to operating expenses, employee payroll, and capital expenditure. Enter the data in peach-filled columns only.
Revenue Analysis
The revenue analysis sheet estimates customers and orders for different categories, revenue, and cost of goods sold for each product under each category. At the end of the sheet, yearly category-wise revenue and cost of goods sold are summarized.
Supporting Details
The supporting detail sheet contains all the calculations needed to make the financial statement, including operating expenses, employee payroll, depreciation, loan, and working capital calculation.
Financial Statements
The Financial Statement sheet includes three main financial statements: income statement, cash flow statement, and balance sheet. The calculations are done monthly and yearly.
Income Statement
The income statement estimates the company's profitability, and it incorporates profitability margins from gross profit margin to net profit margin in percentage terms.
Cashflow Statement
The Cashflow Statement estimates the cash inflow and outflow in your company and evaluates how efficiently your company manages its cash position.
Balance Sheet
The balance sheet summarizes a business, giving you the company’s financial position, such as how many assets, liabilities, and equity your company has.
Financial Analysis
The Financial Analysis section estimates the following:
Breakeven Analysis
The breakeven analysis estimates the sales needed to reach the no-profit, no-loss situation.
Financial Ratios
The Financial Ratio section estimates solvency, liquidity, profitability, and efficiency ratios to better understand the company's performance. You can also compare your ratios with industry benchmarks.
Project Evaluation
The Project Evaluation estimates the Net present value of the company, Internal rate of return, minimum expected equity percentage by investors, investors' required future value, and payback period.
Sensitivity Analysis
The sensitivity analysis estimates the company's income statement heads, NPV, and the Payback period when revenue and cost of goods sold are changed while keeping the same expense plan. Additionally, the sensitivity analysis is done in two ways pessimistic and optimistic.
Dashboard
The dashboard provides a graphical representation of your company's performance. Average gross profit, net profit, and revenue growth are also included in the dashboard to understand your business’s profitability better.
Advantages of this model
Cost-Effective: The model is cost-effective, and you don't need to hire financial experts for financial modeling tasks for your startups.
Investor-Friendly: All related investor metrics are present. It provides valuation and performance analysis charts. Therefore, investors will appreciate the complete transparency of the financial model while considering investing in your business.
Properly Integrated: The model assumptions and calculation have proper integration.
This Best Practice includes
1 Excel File (7 tabs)
Further information
This model also estimates the expenses, so you can know how much of the revenue will be set aside to cover those expenses. This model will help you identify the investment requirements and the company’s actual value.
