

Publication number: ELQ-38894-1
View all versions & Certificate

Excel Business & Revenue Management Dashboard | KPI Analytics Template
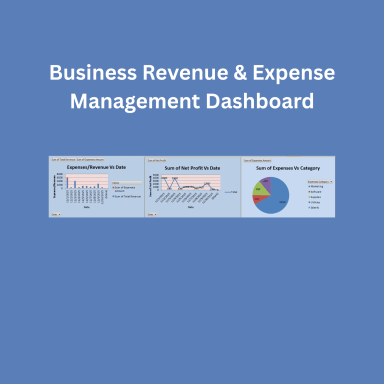
helps businesses easily track revenue, expenses, profit, and key performance indicators (KPIs) in one interactive dashboard.
Further information
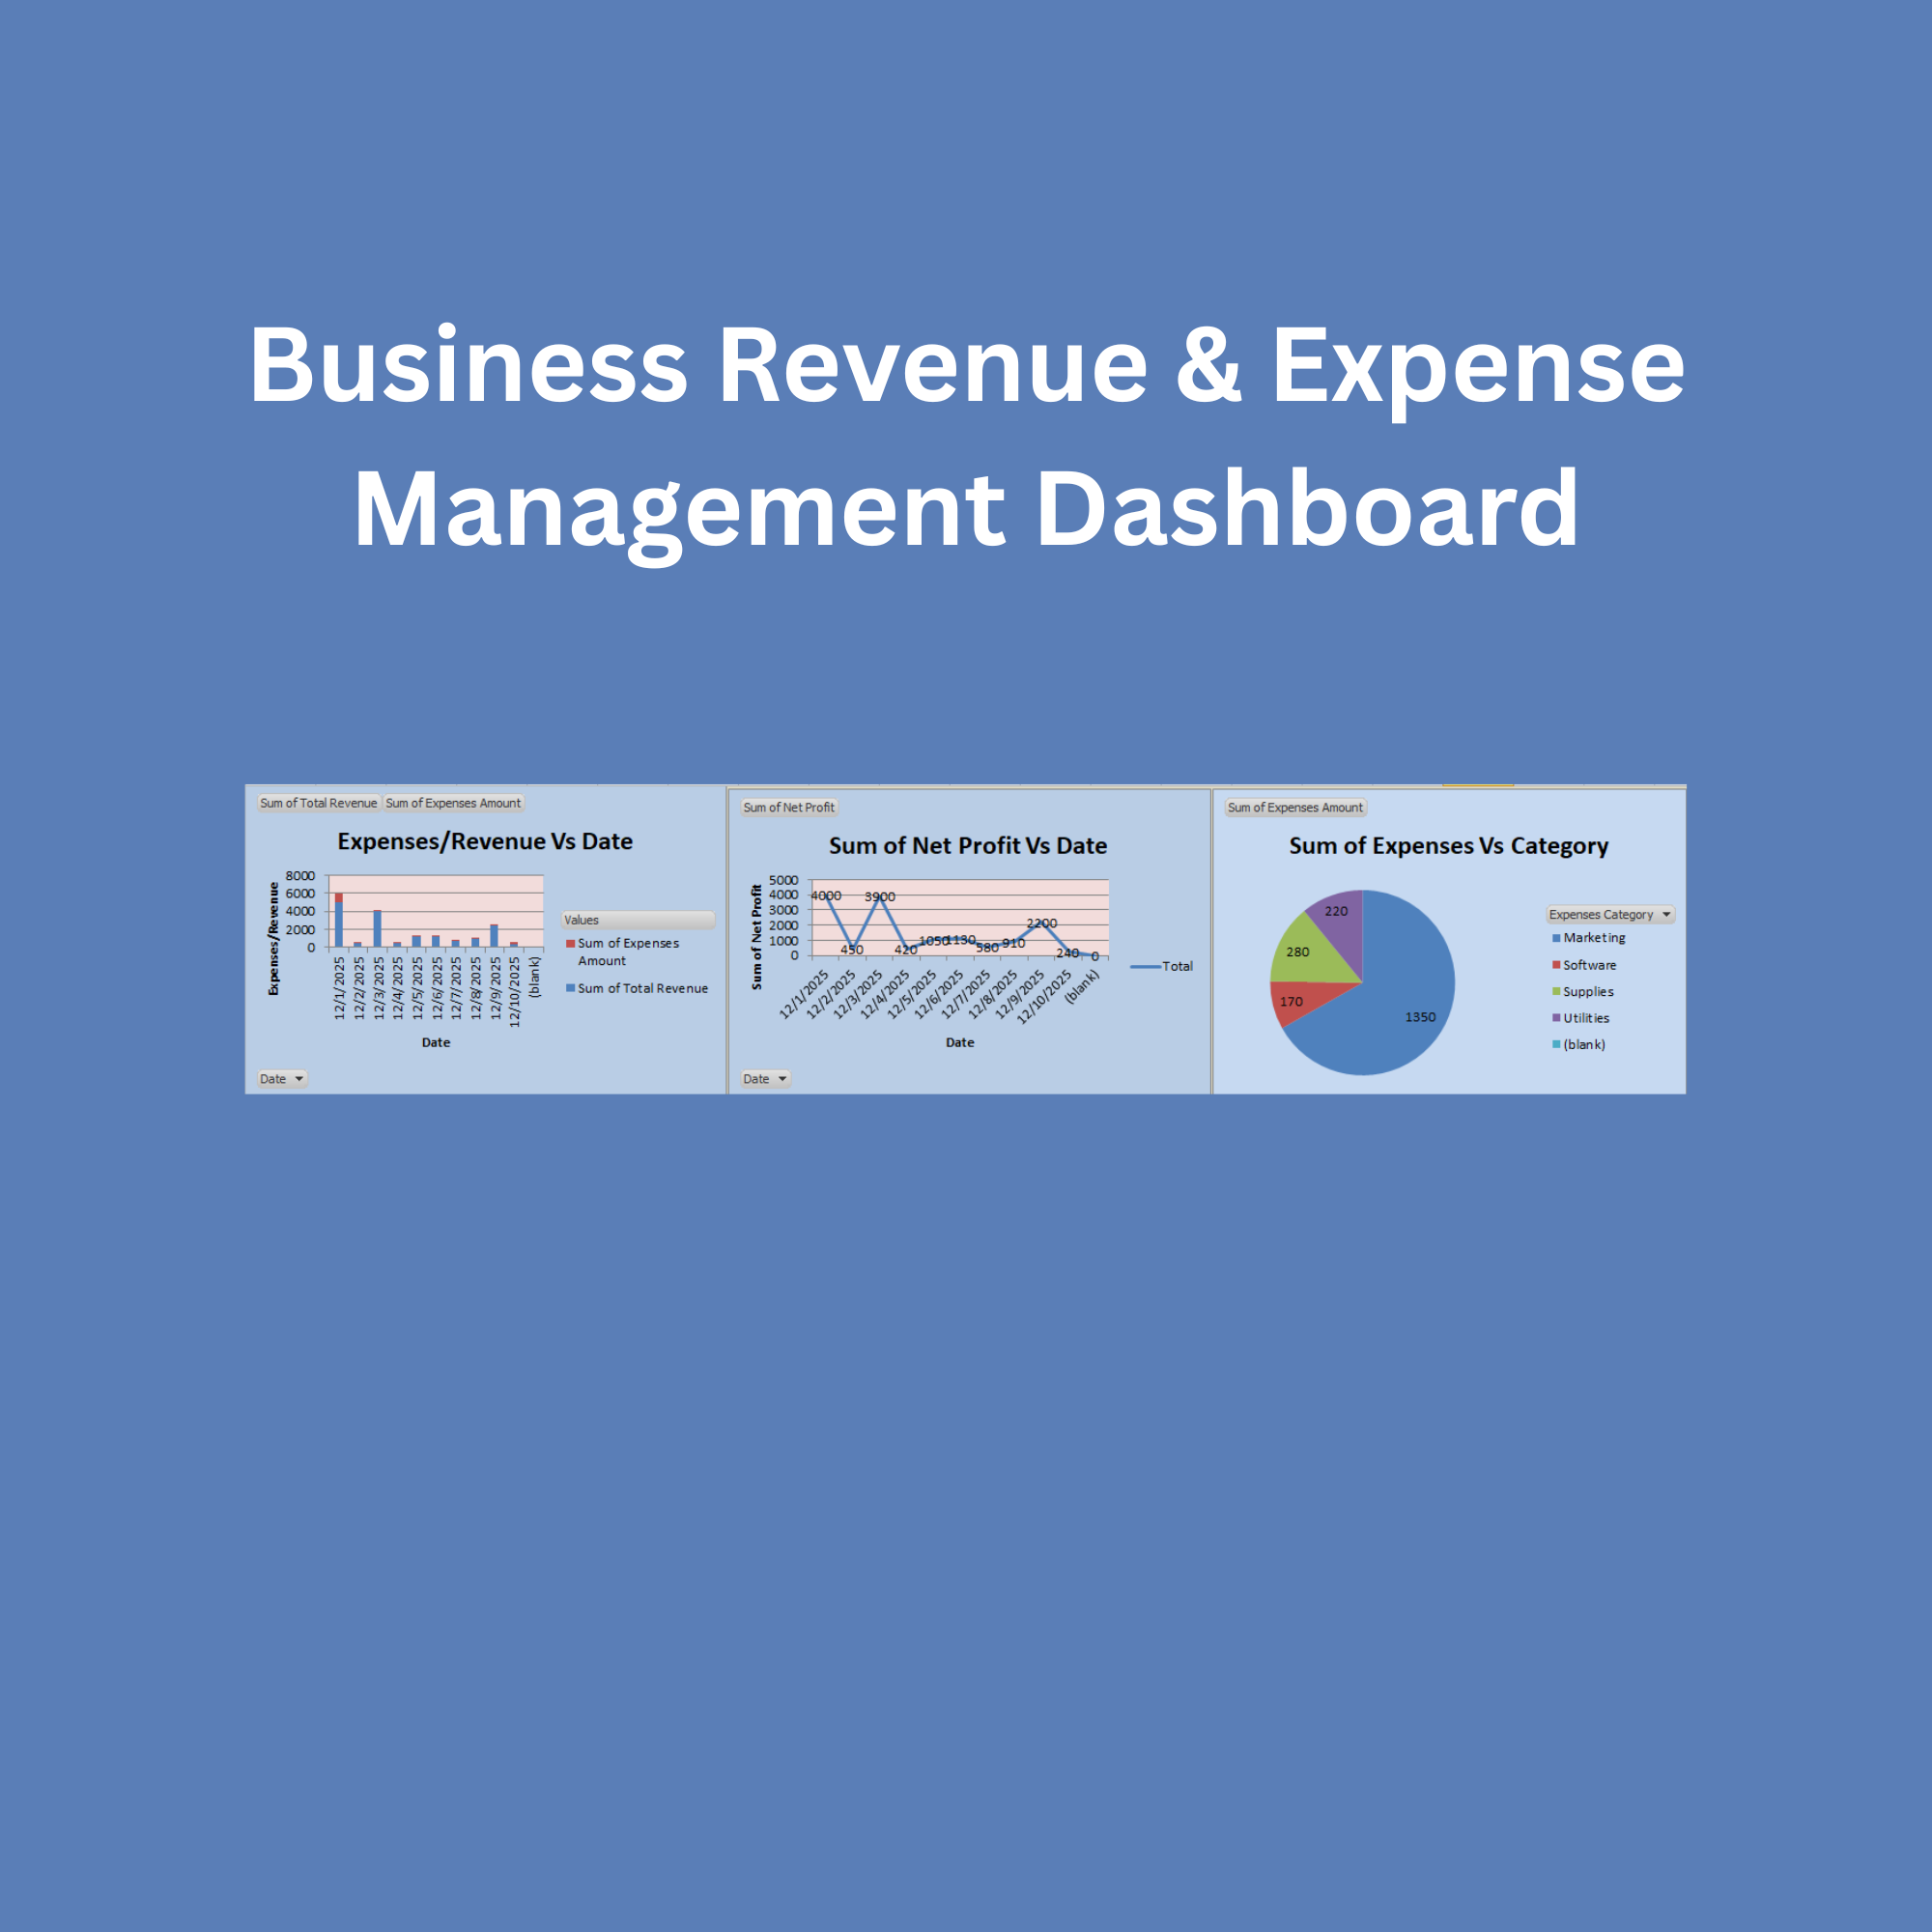
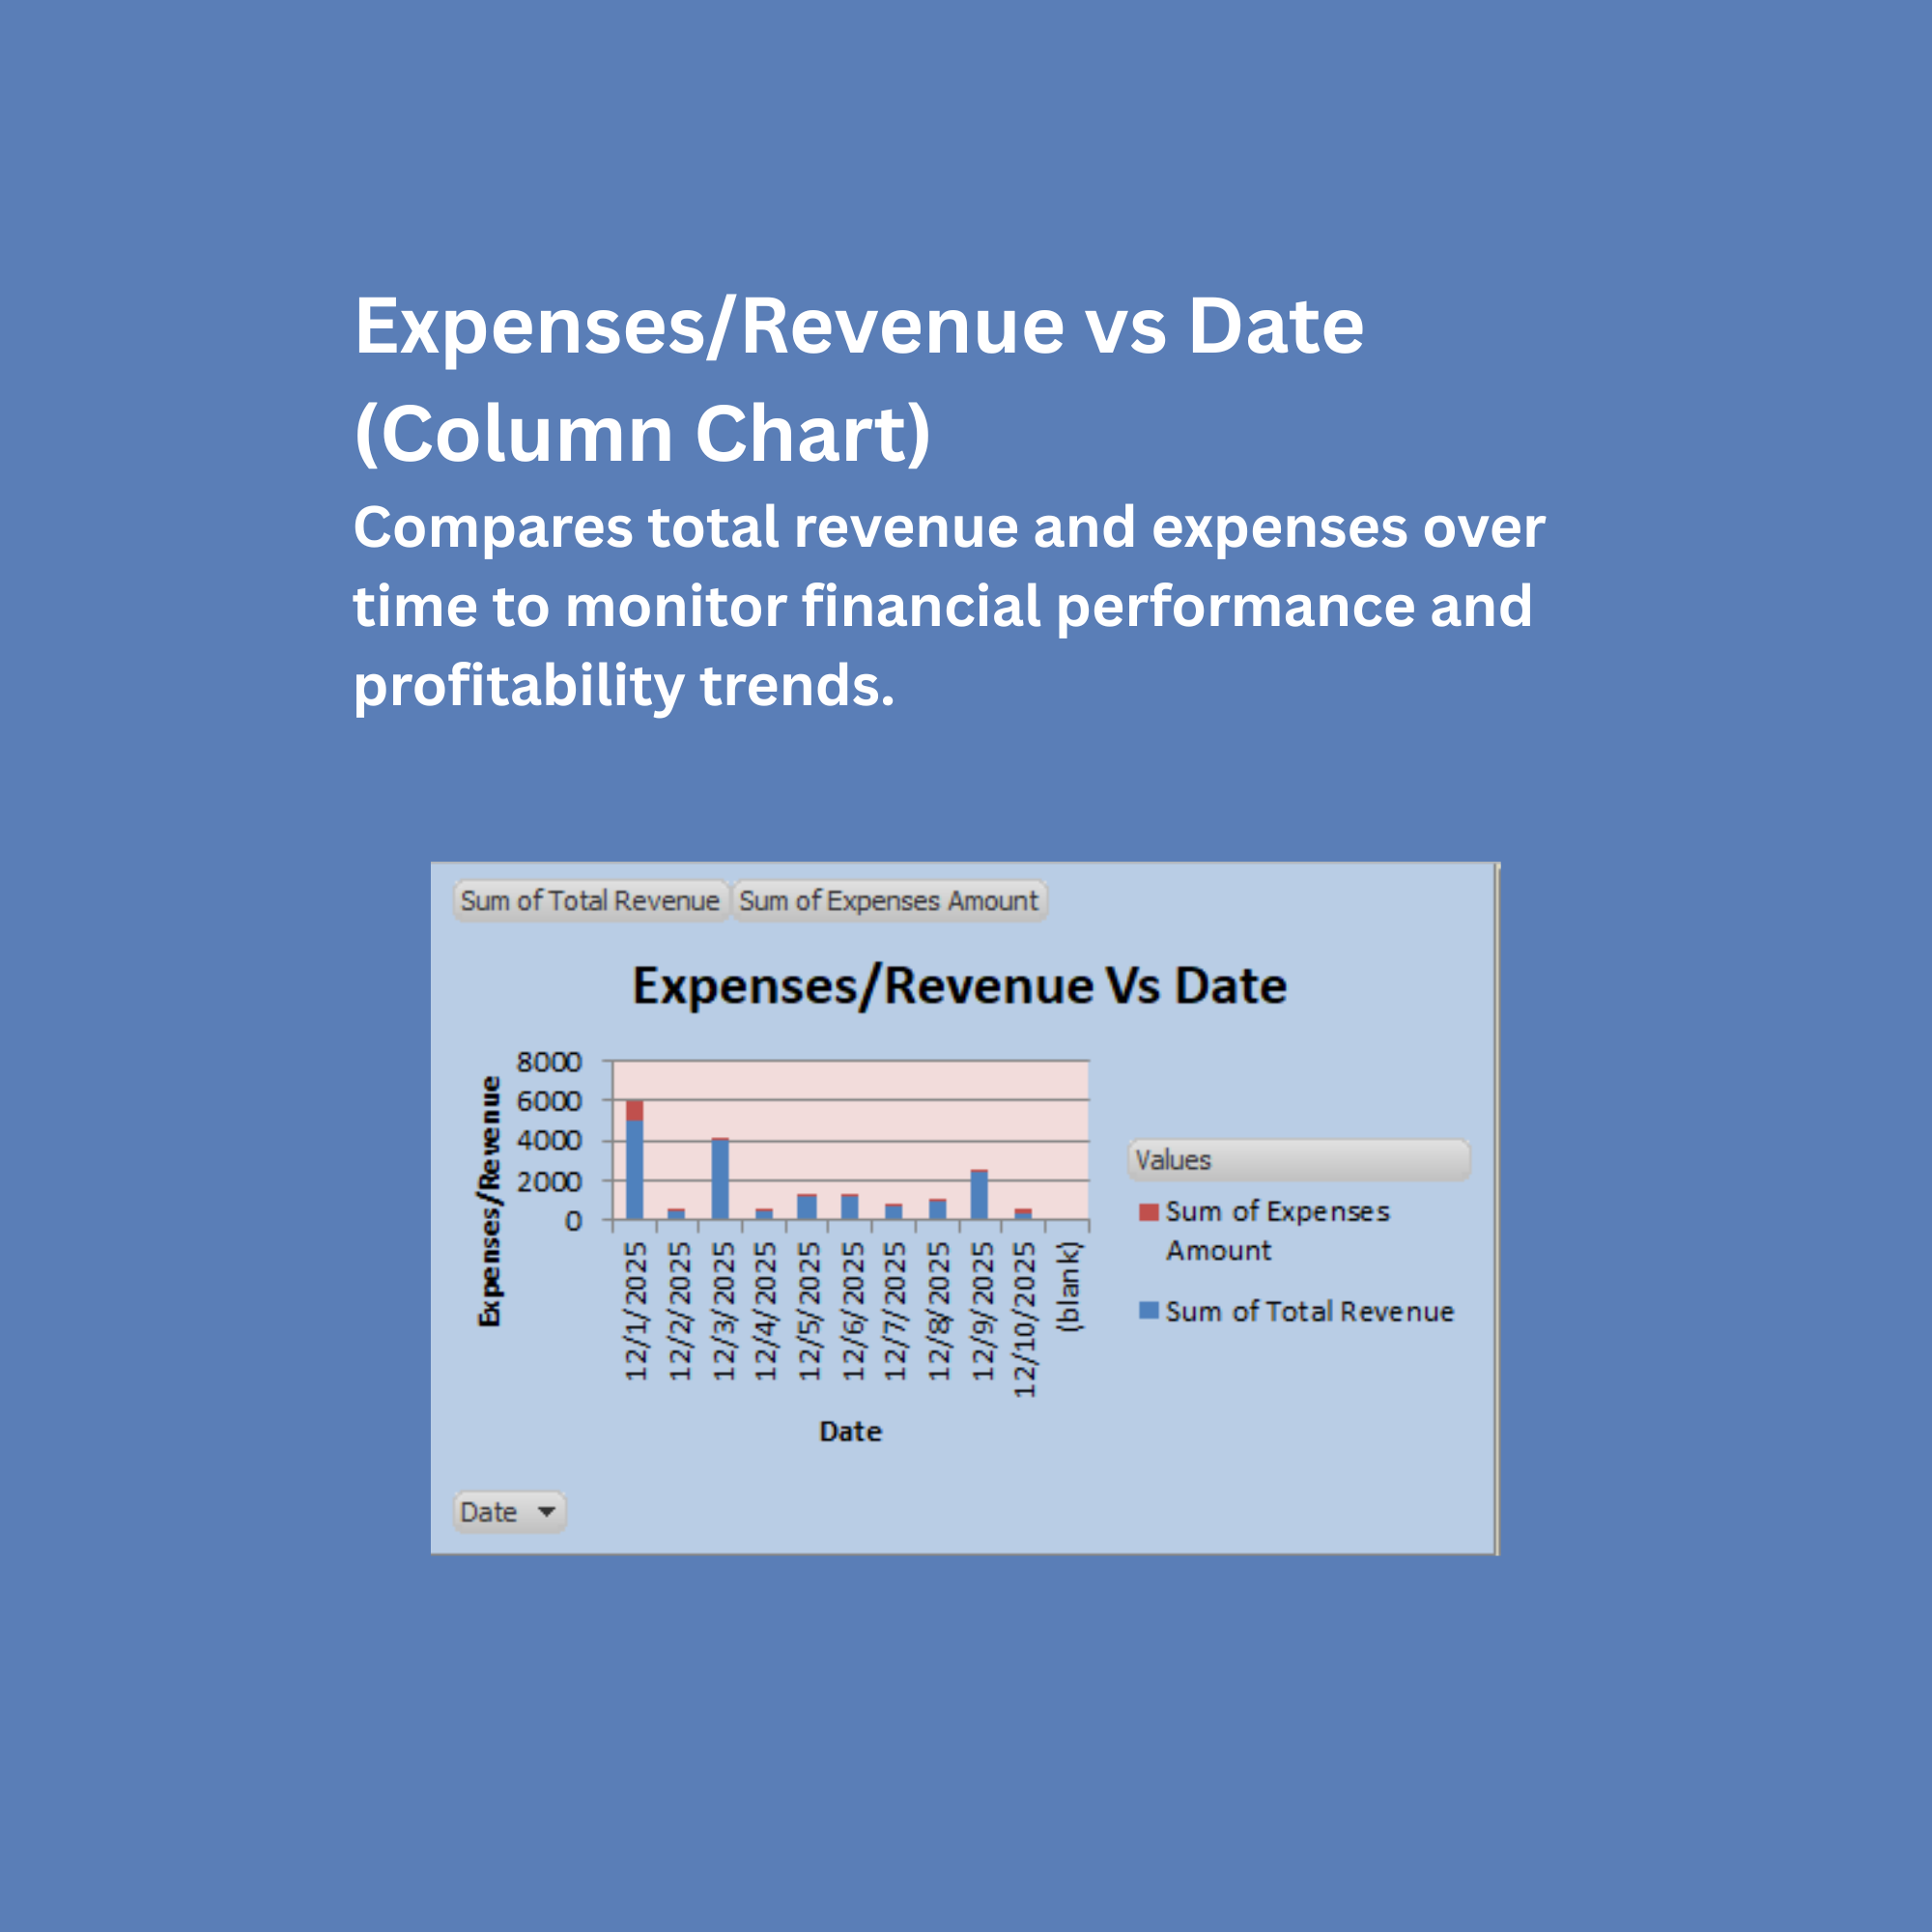
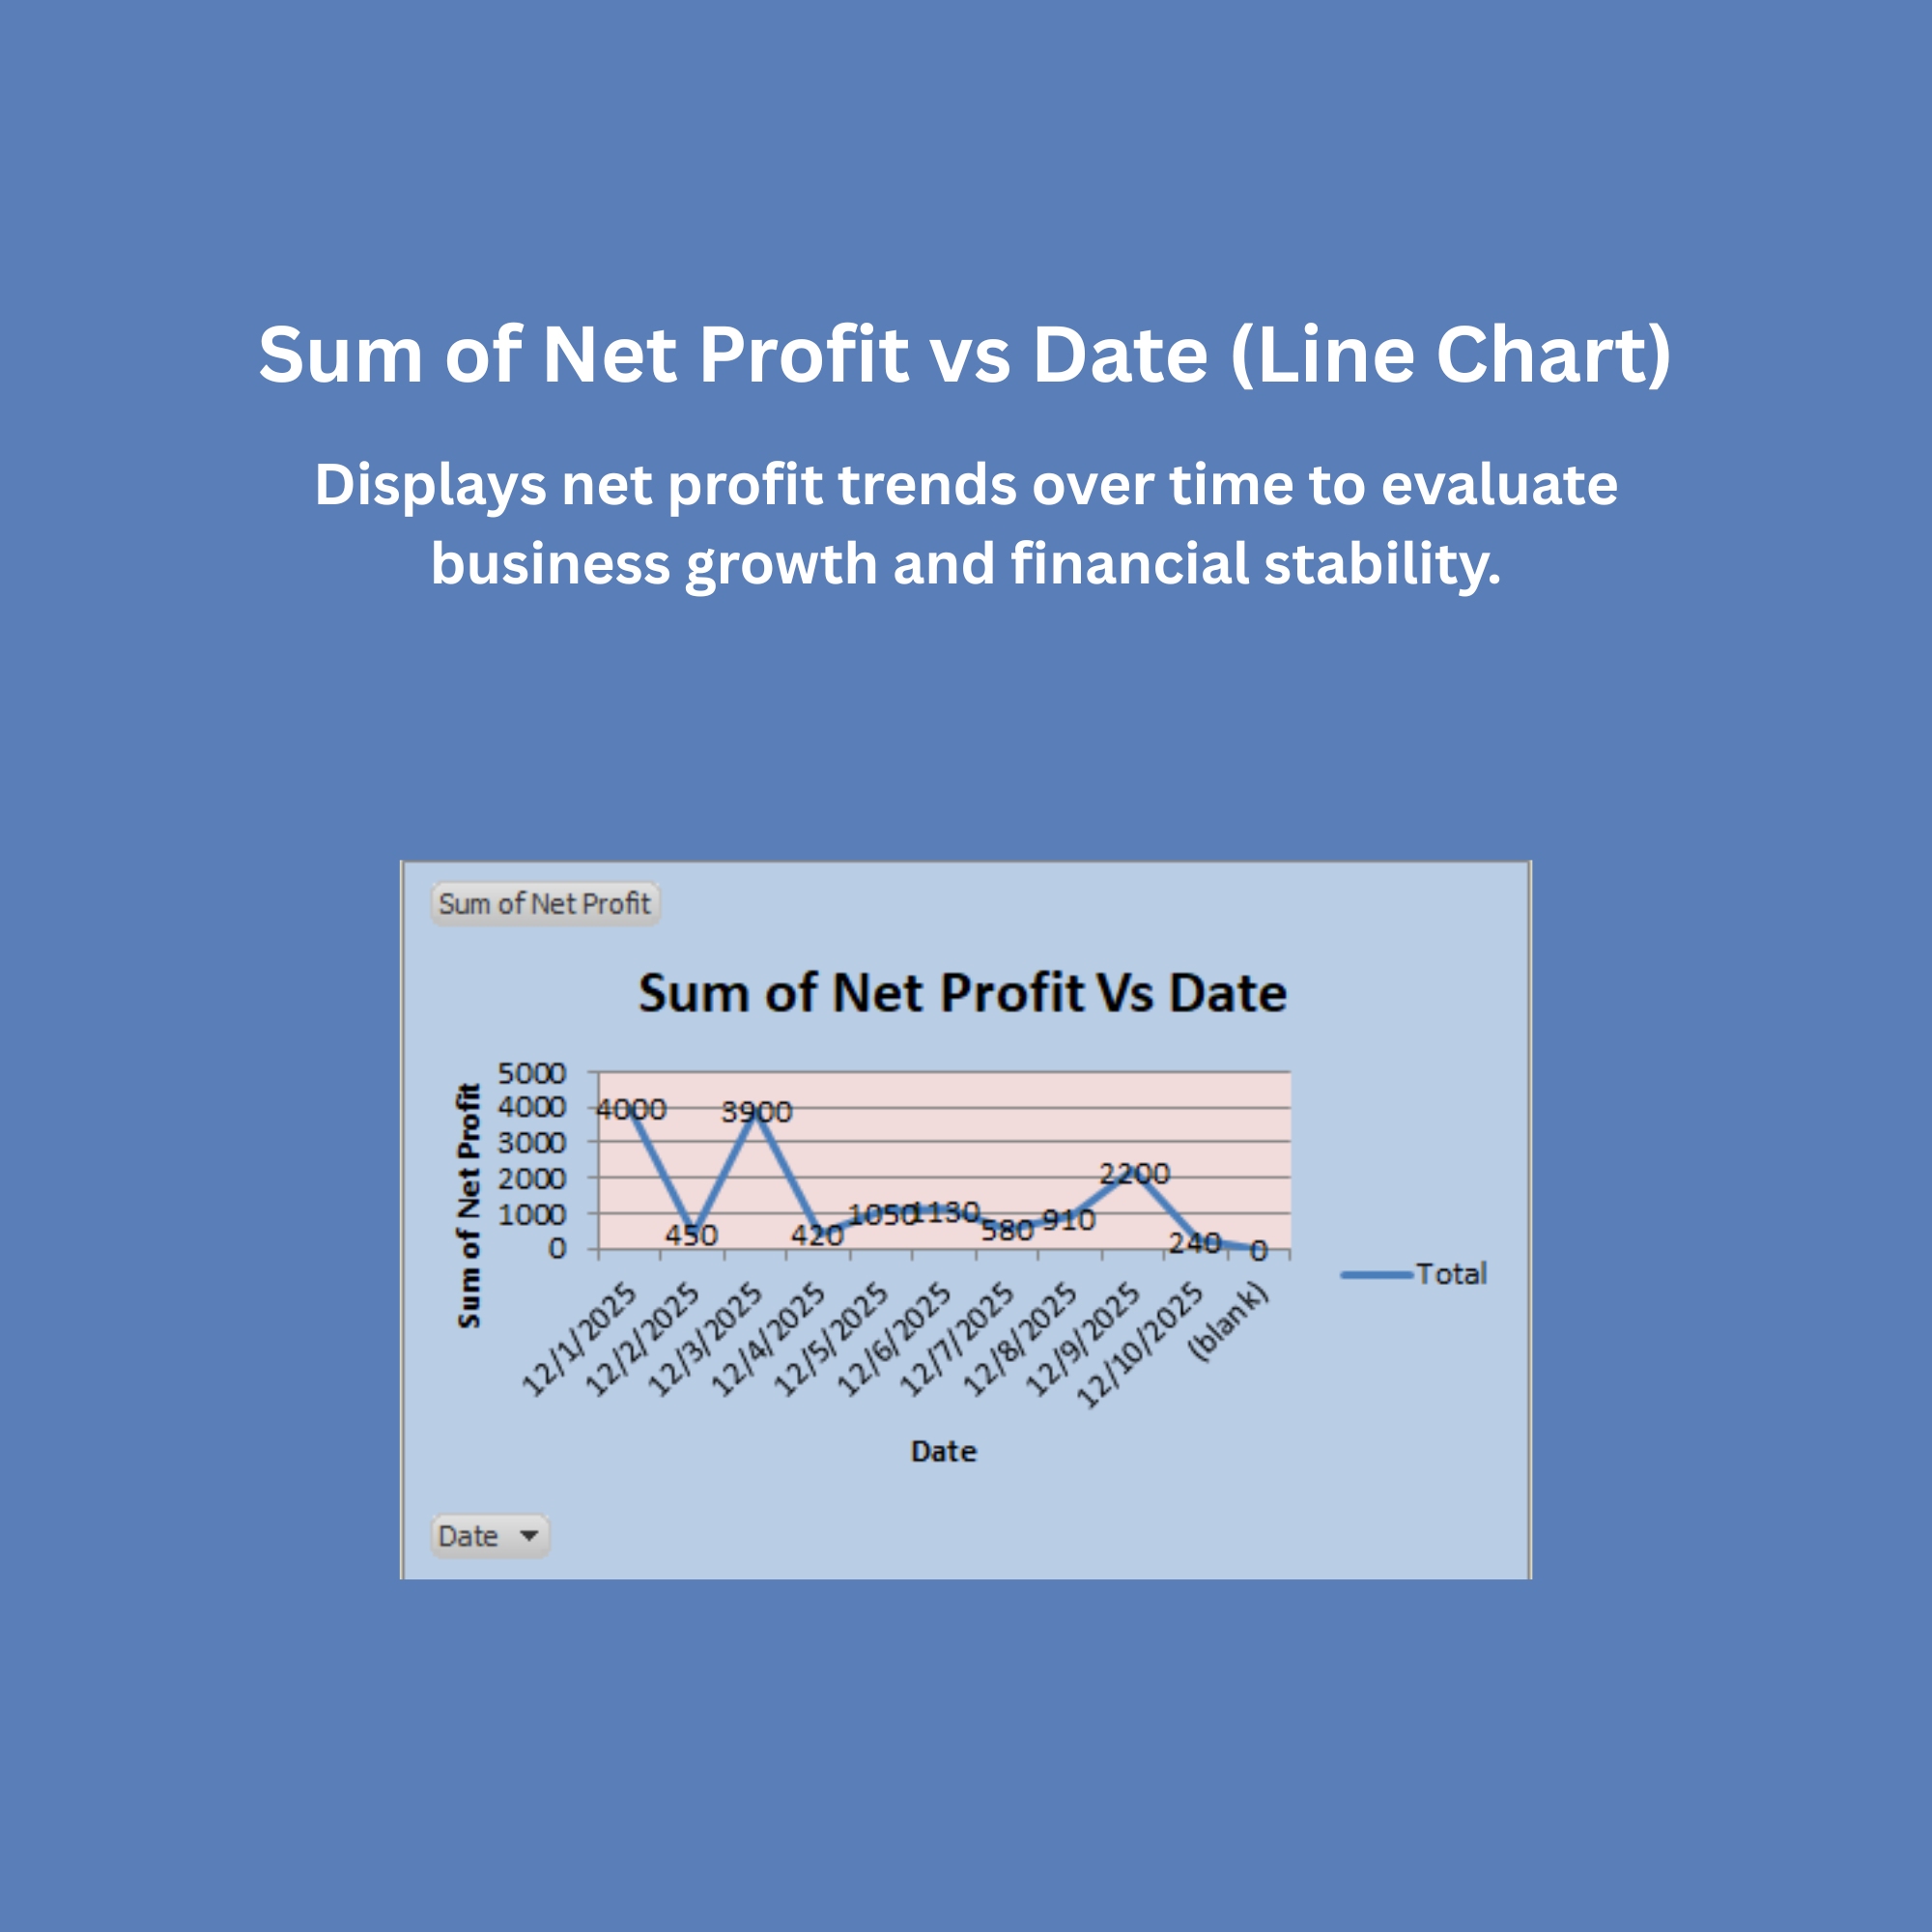
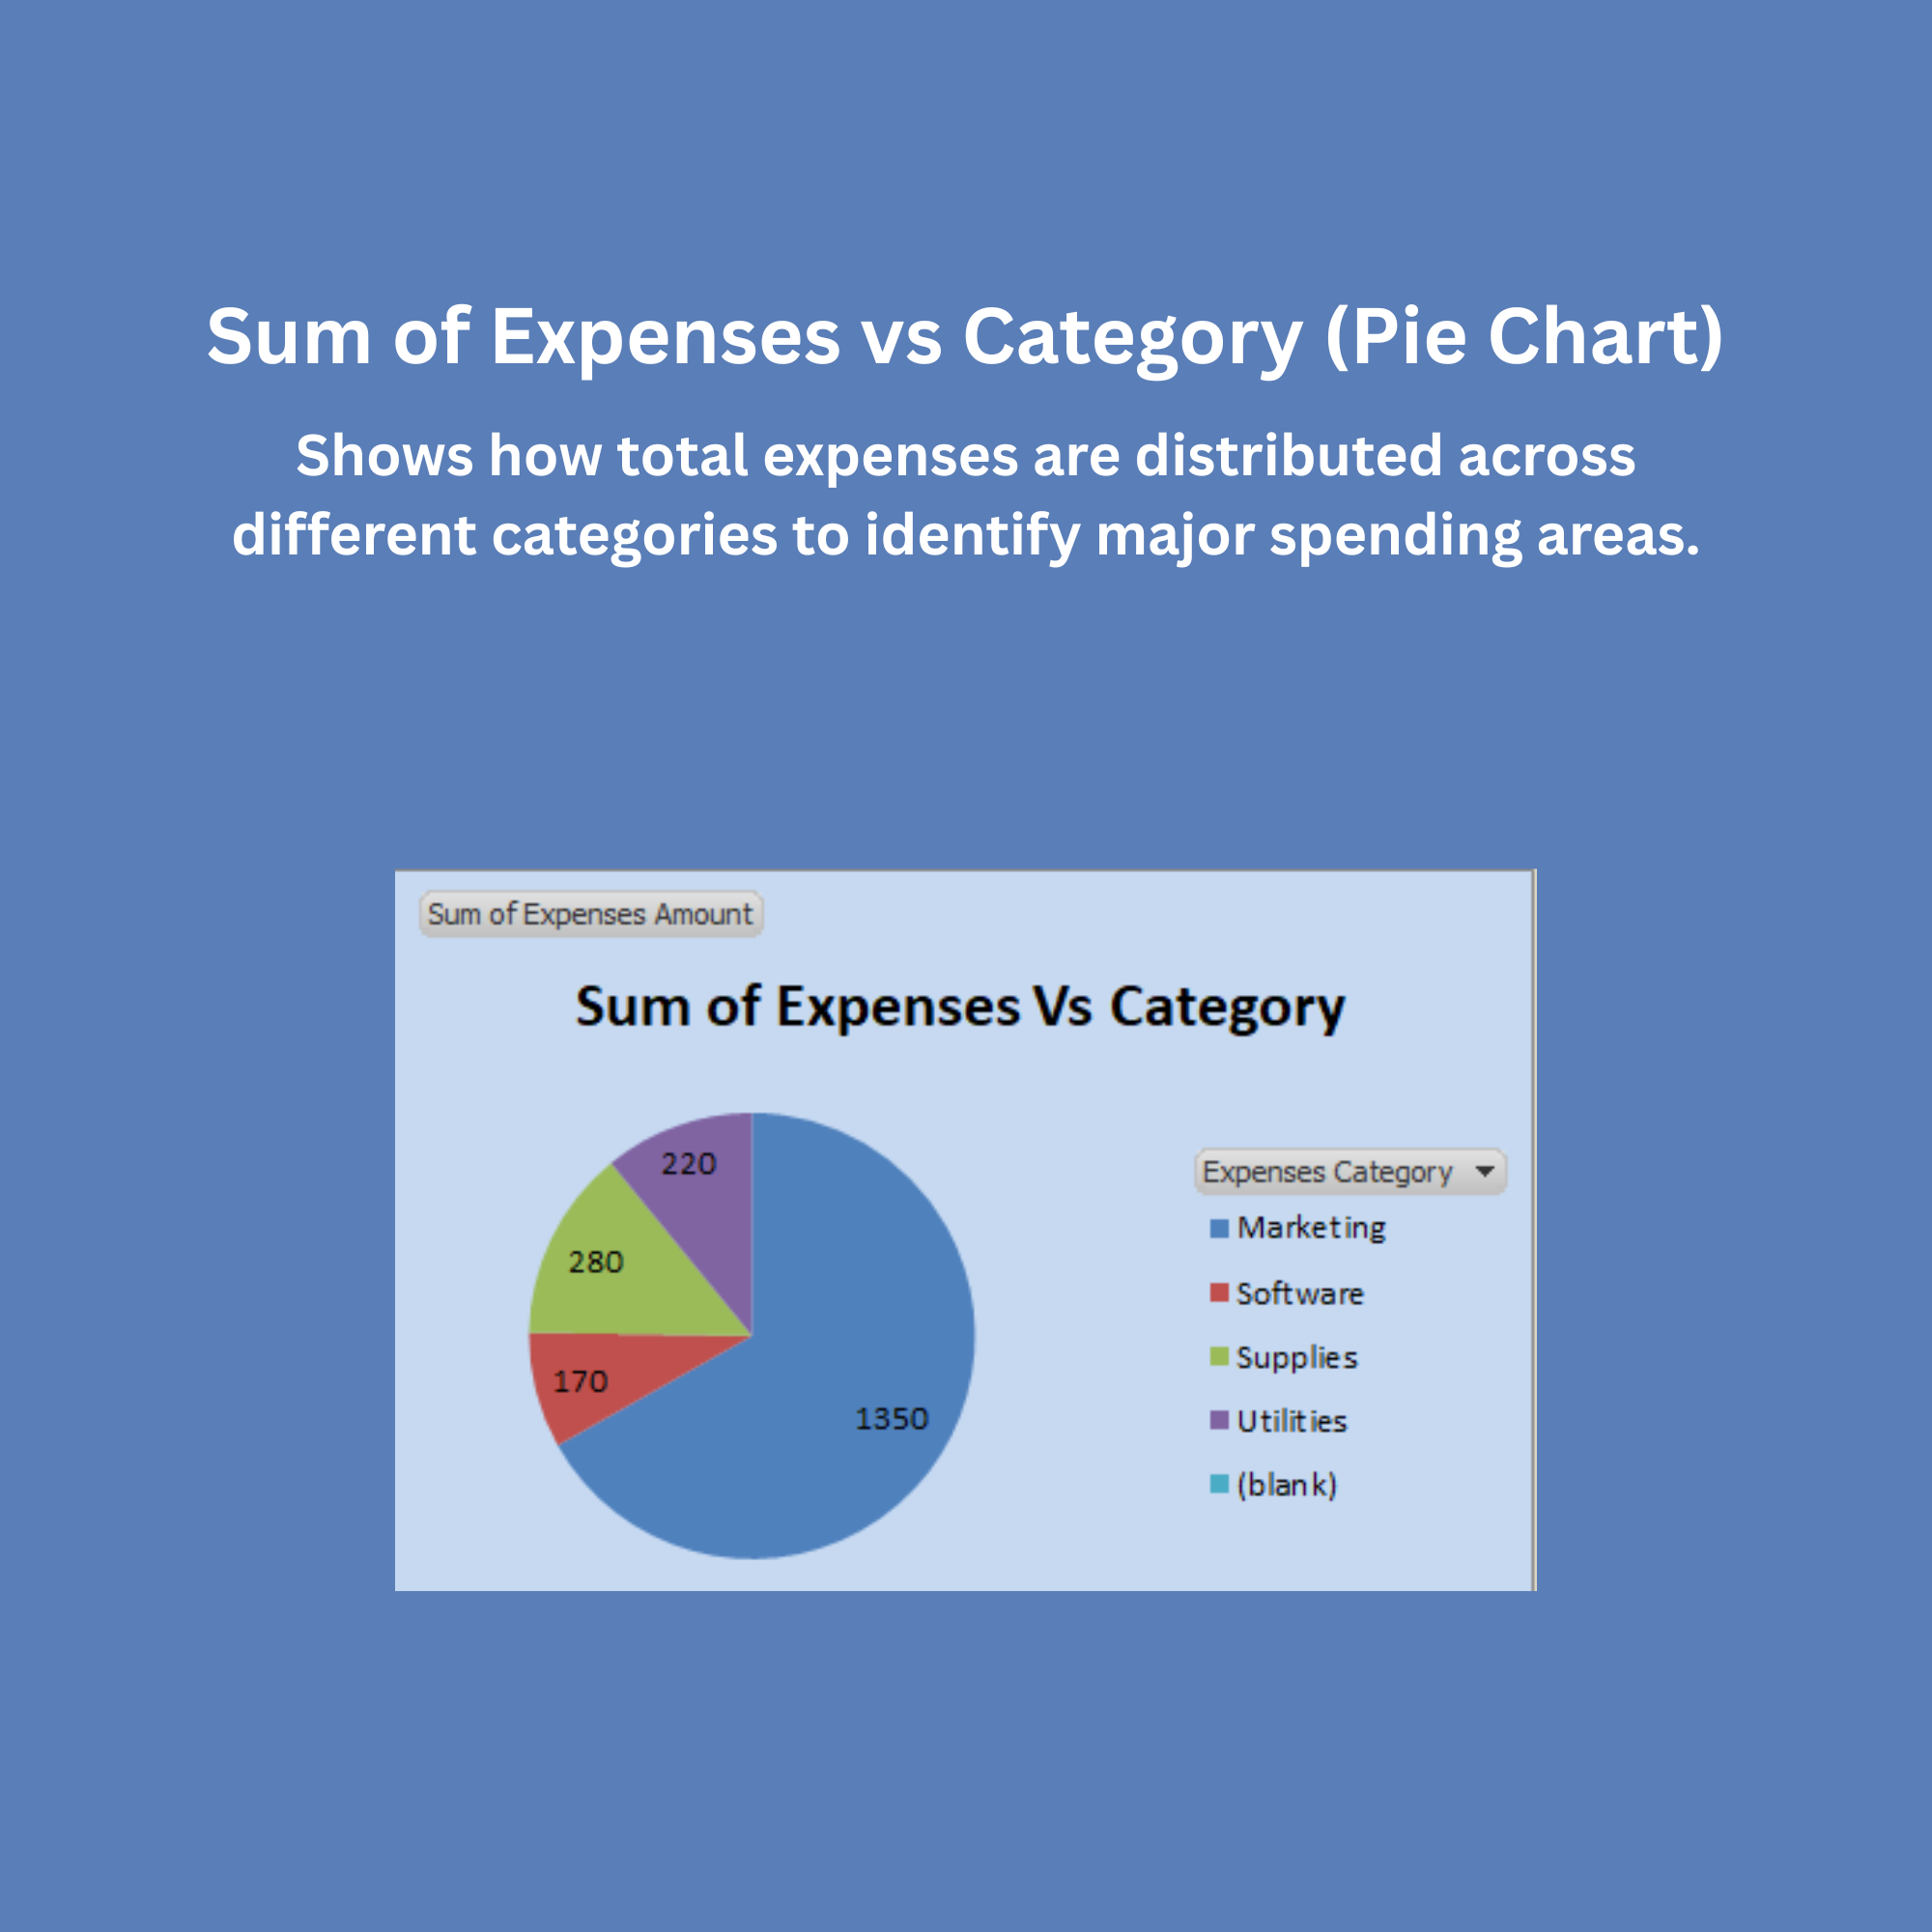
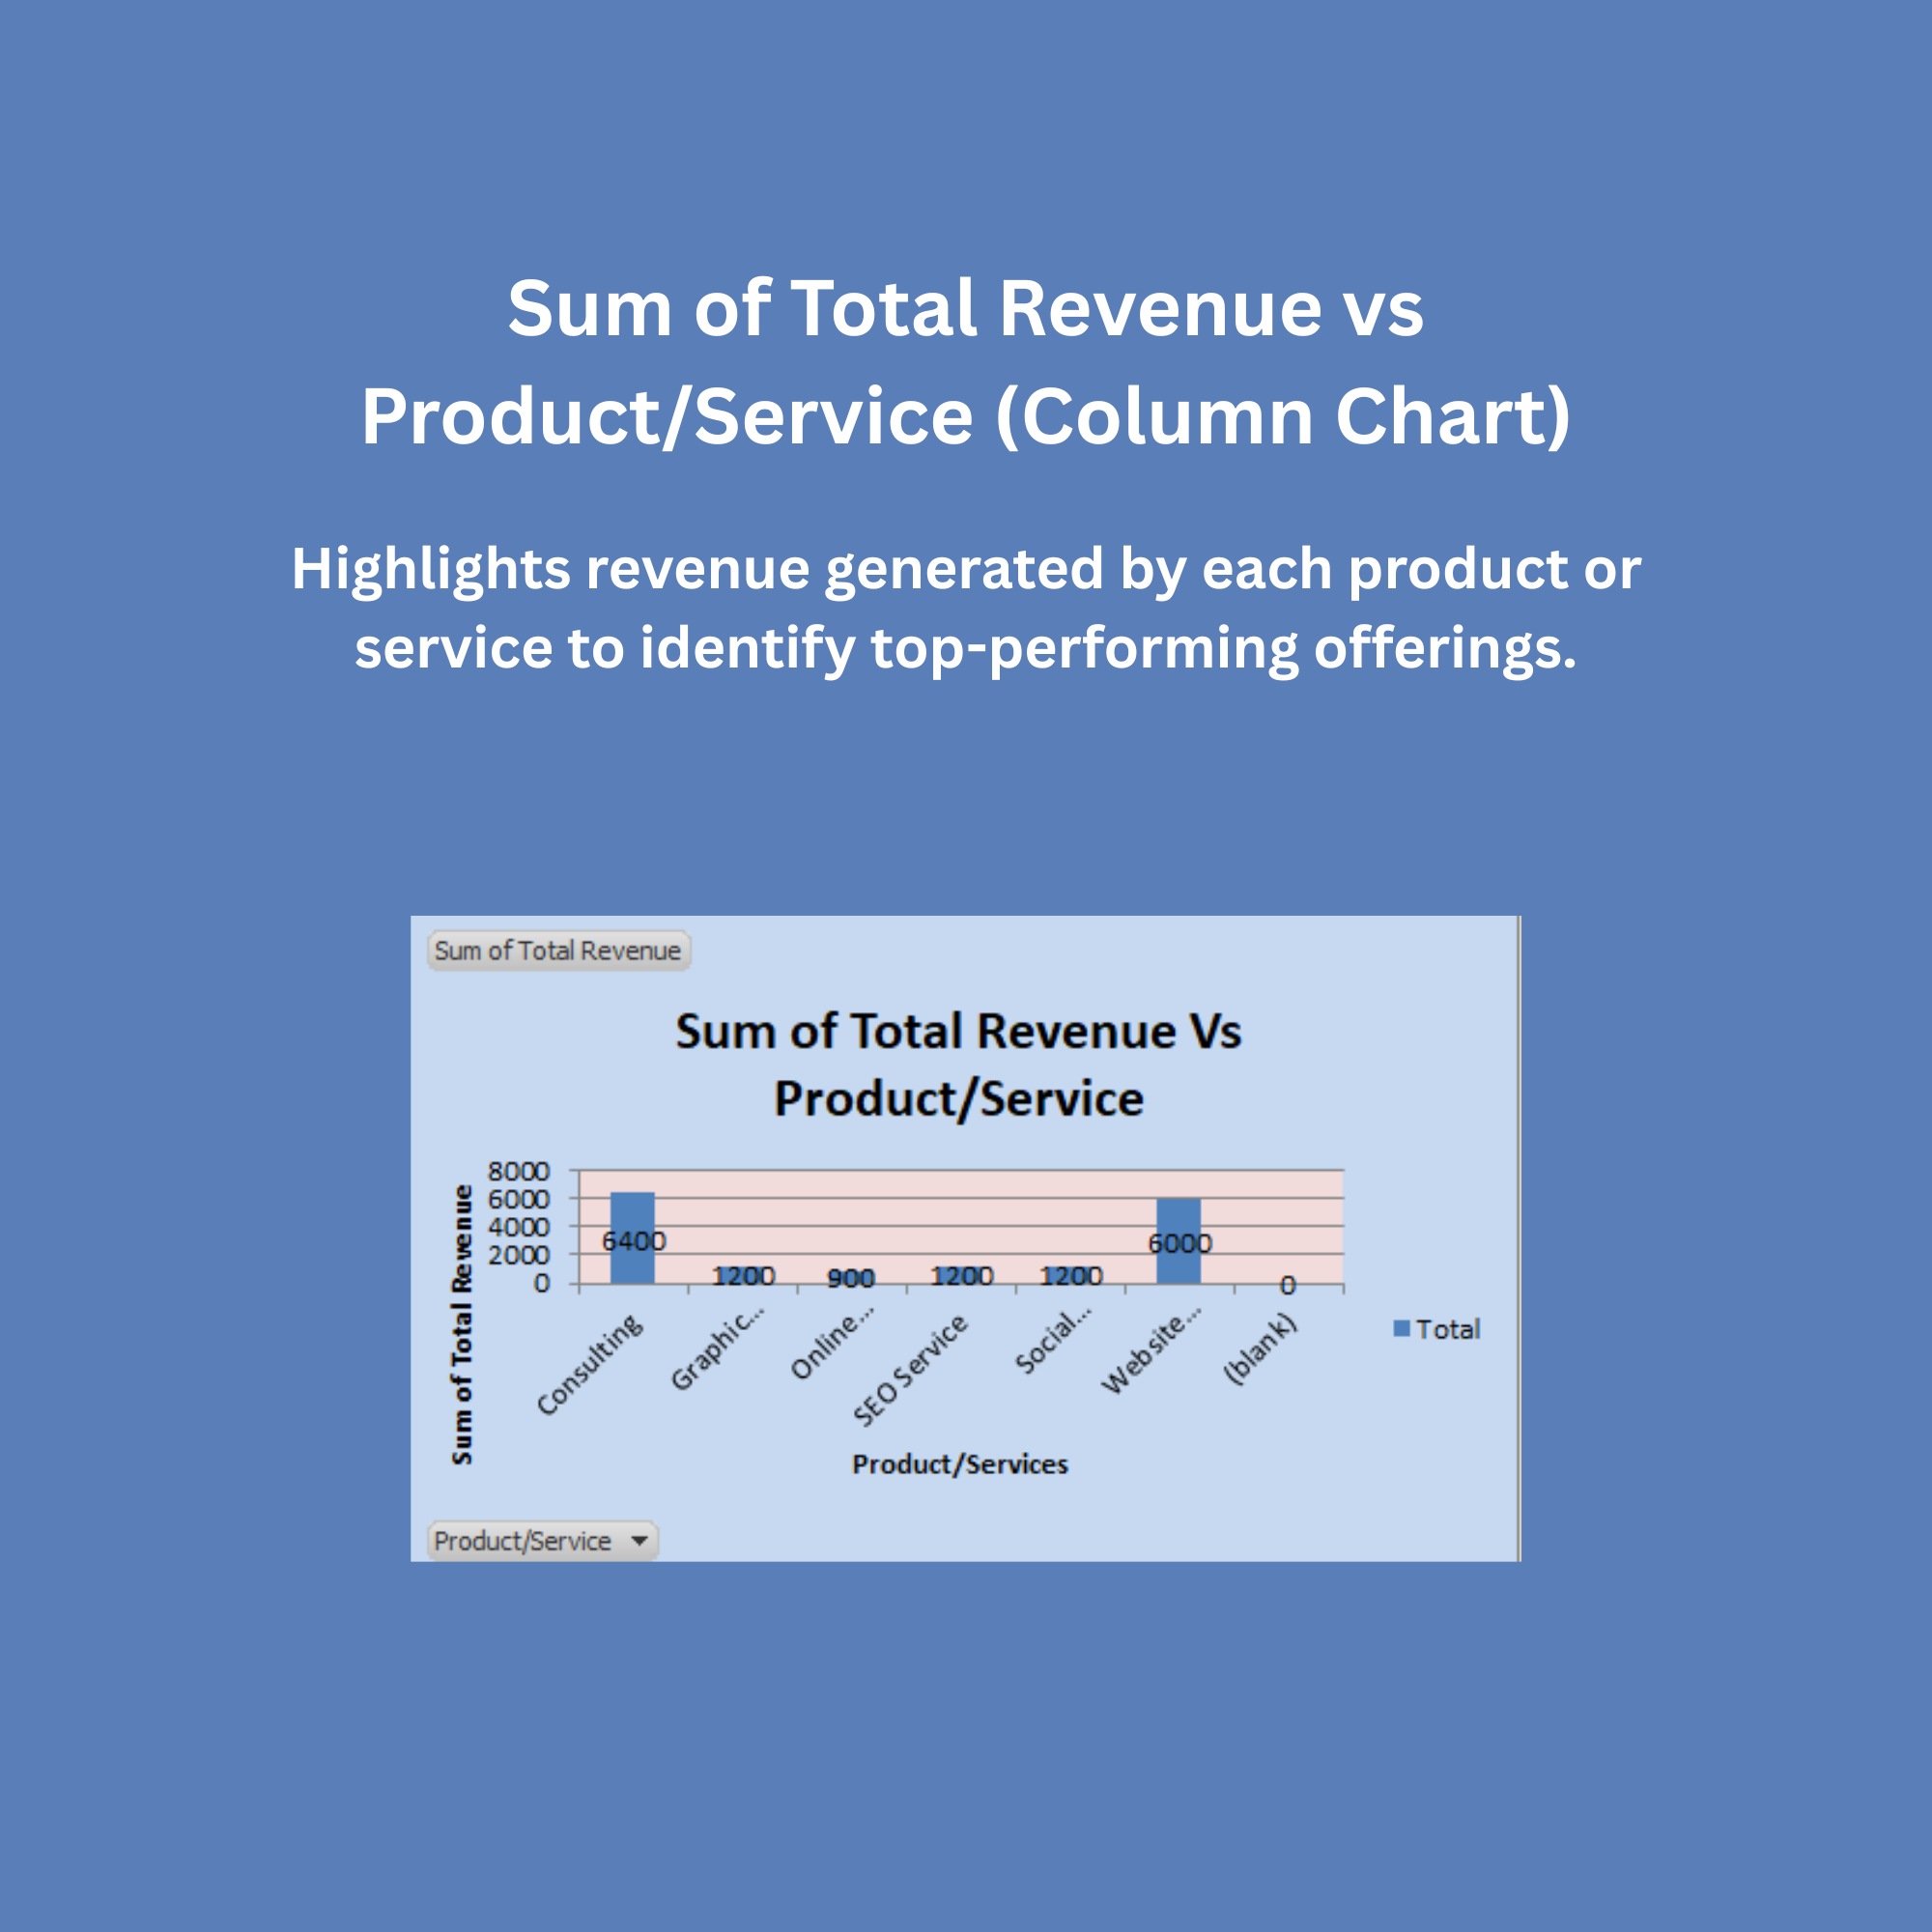
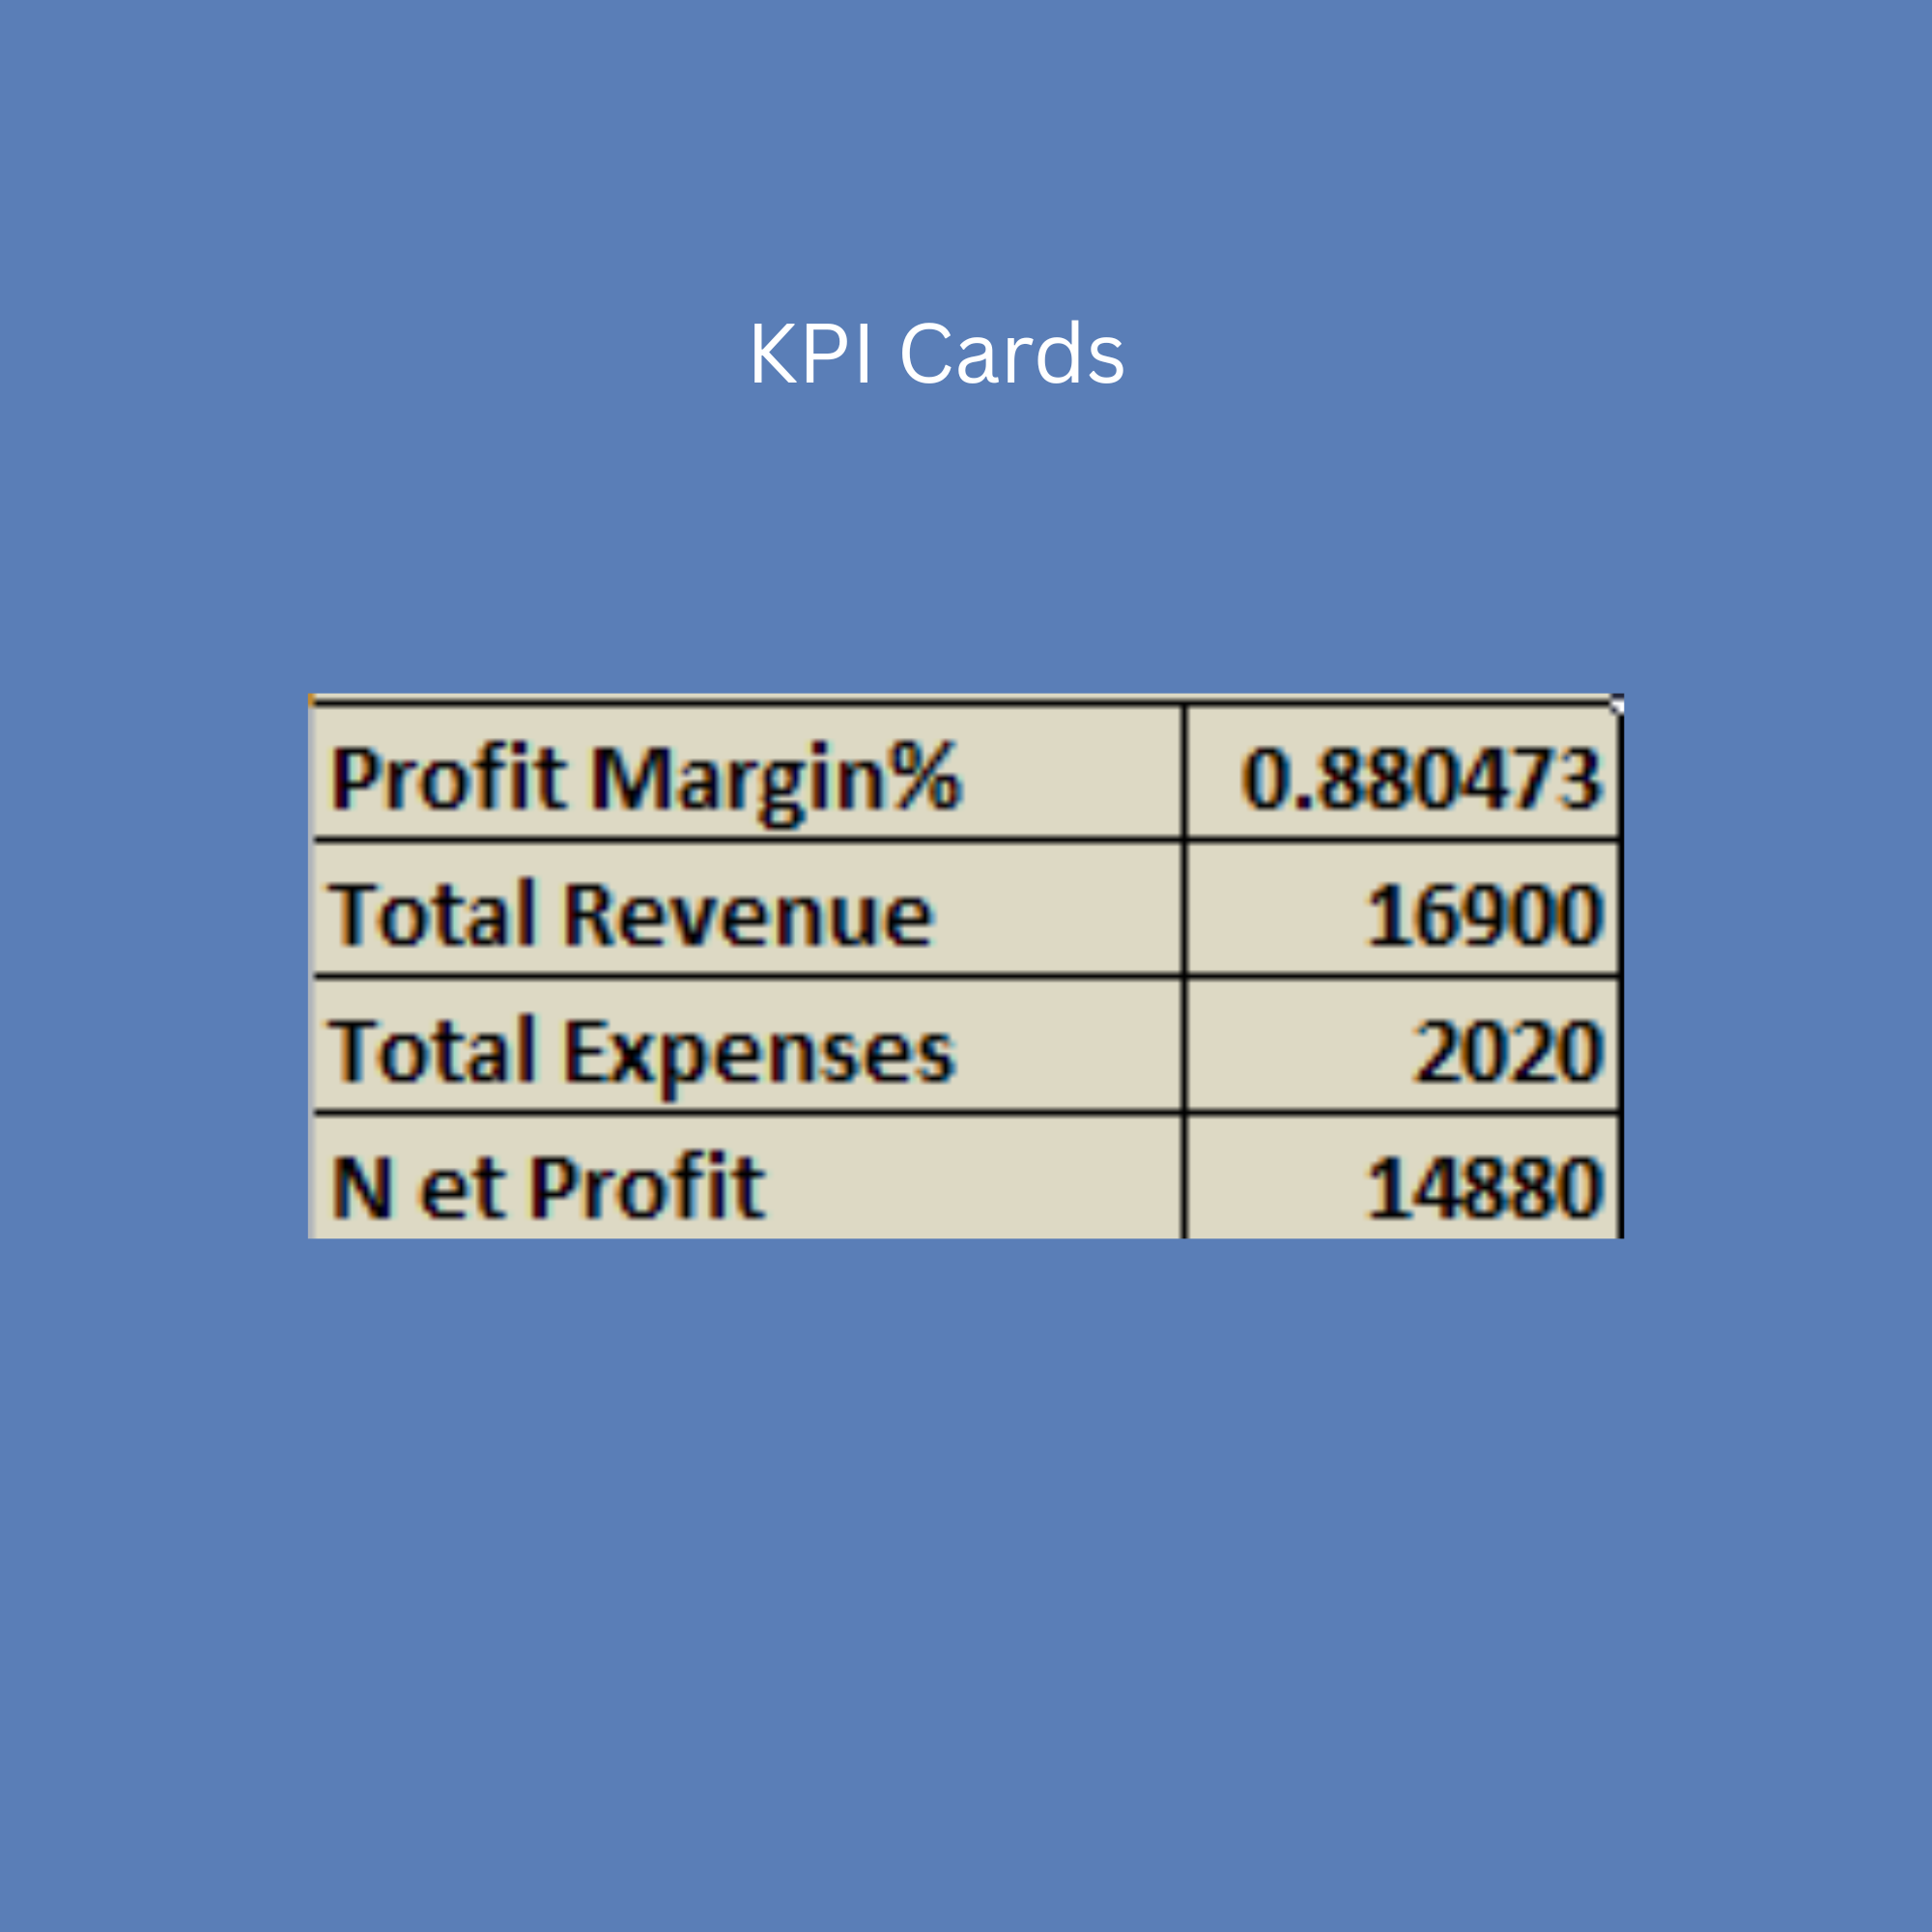
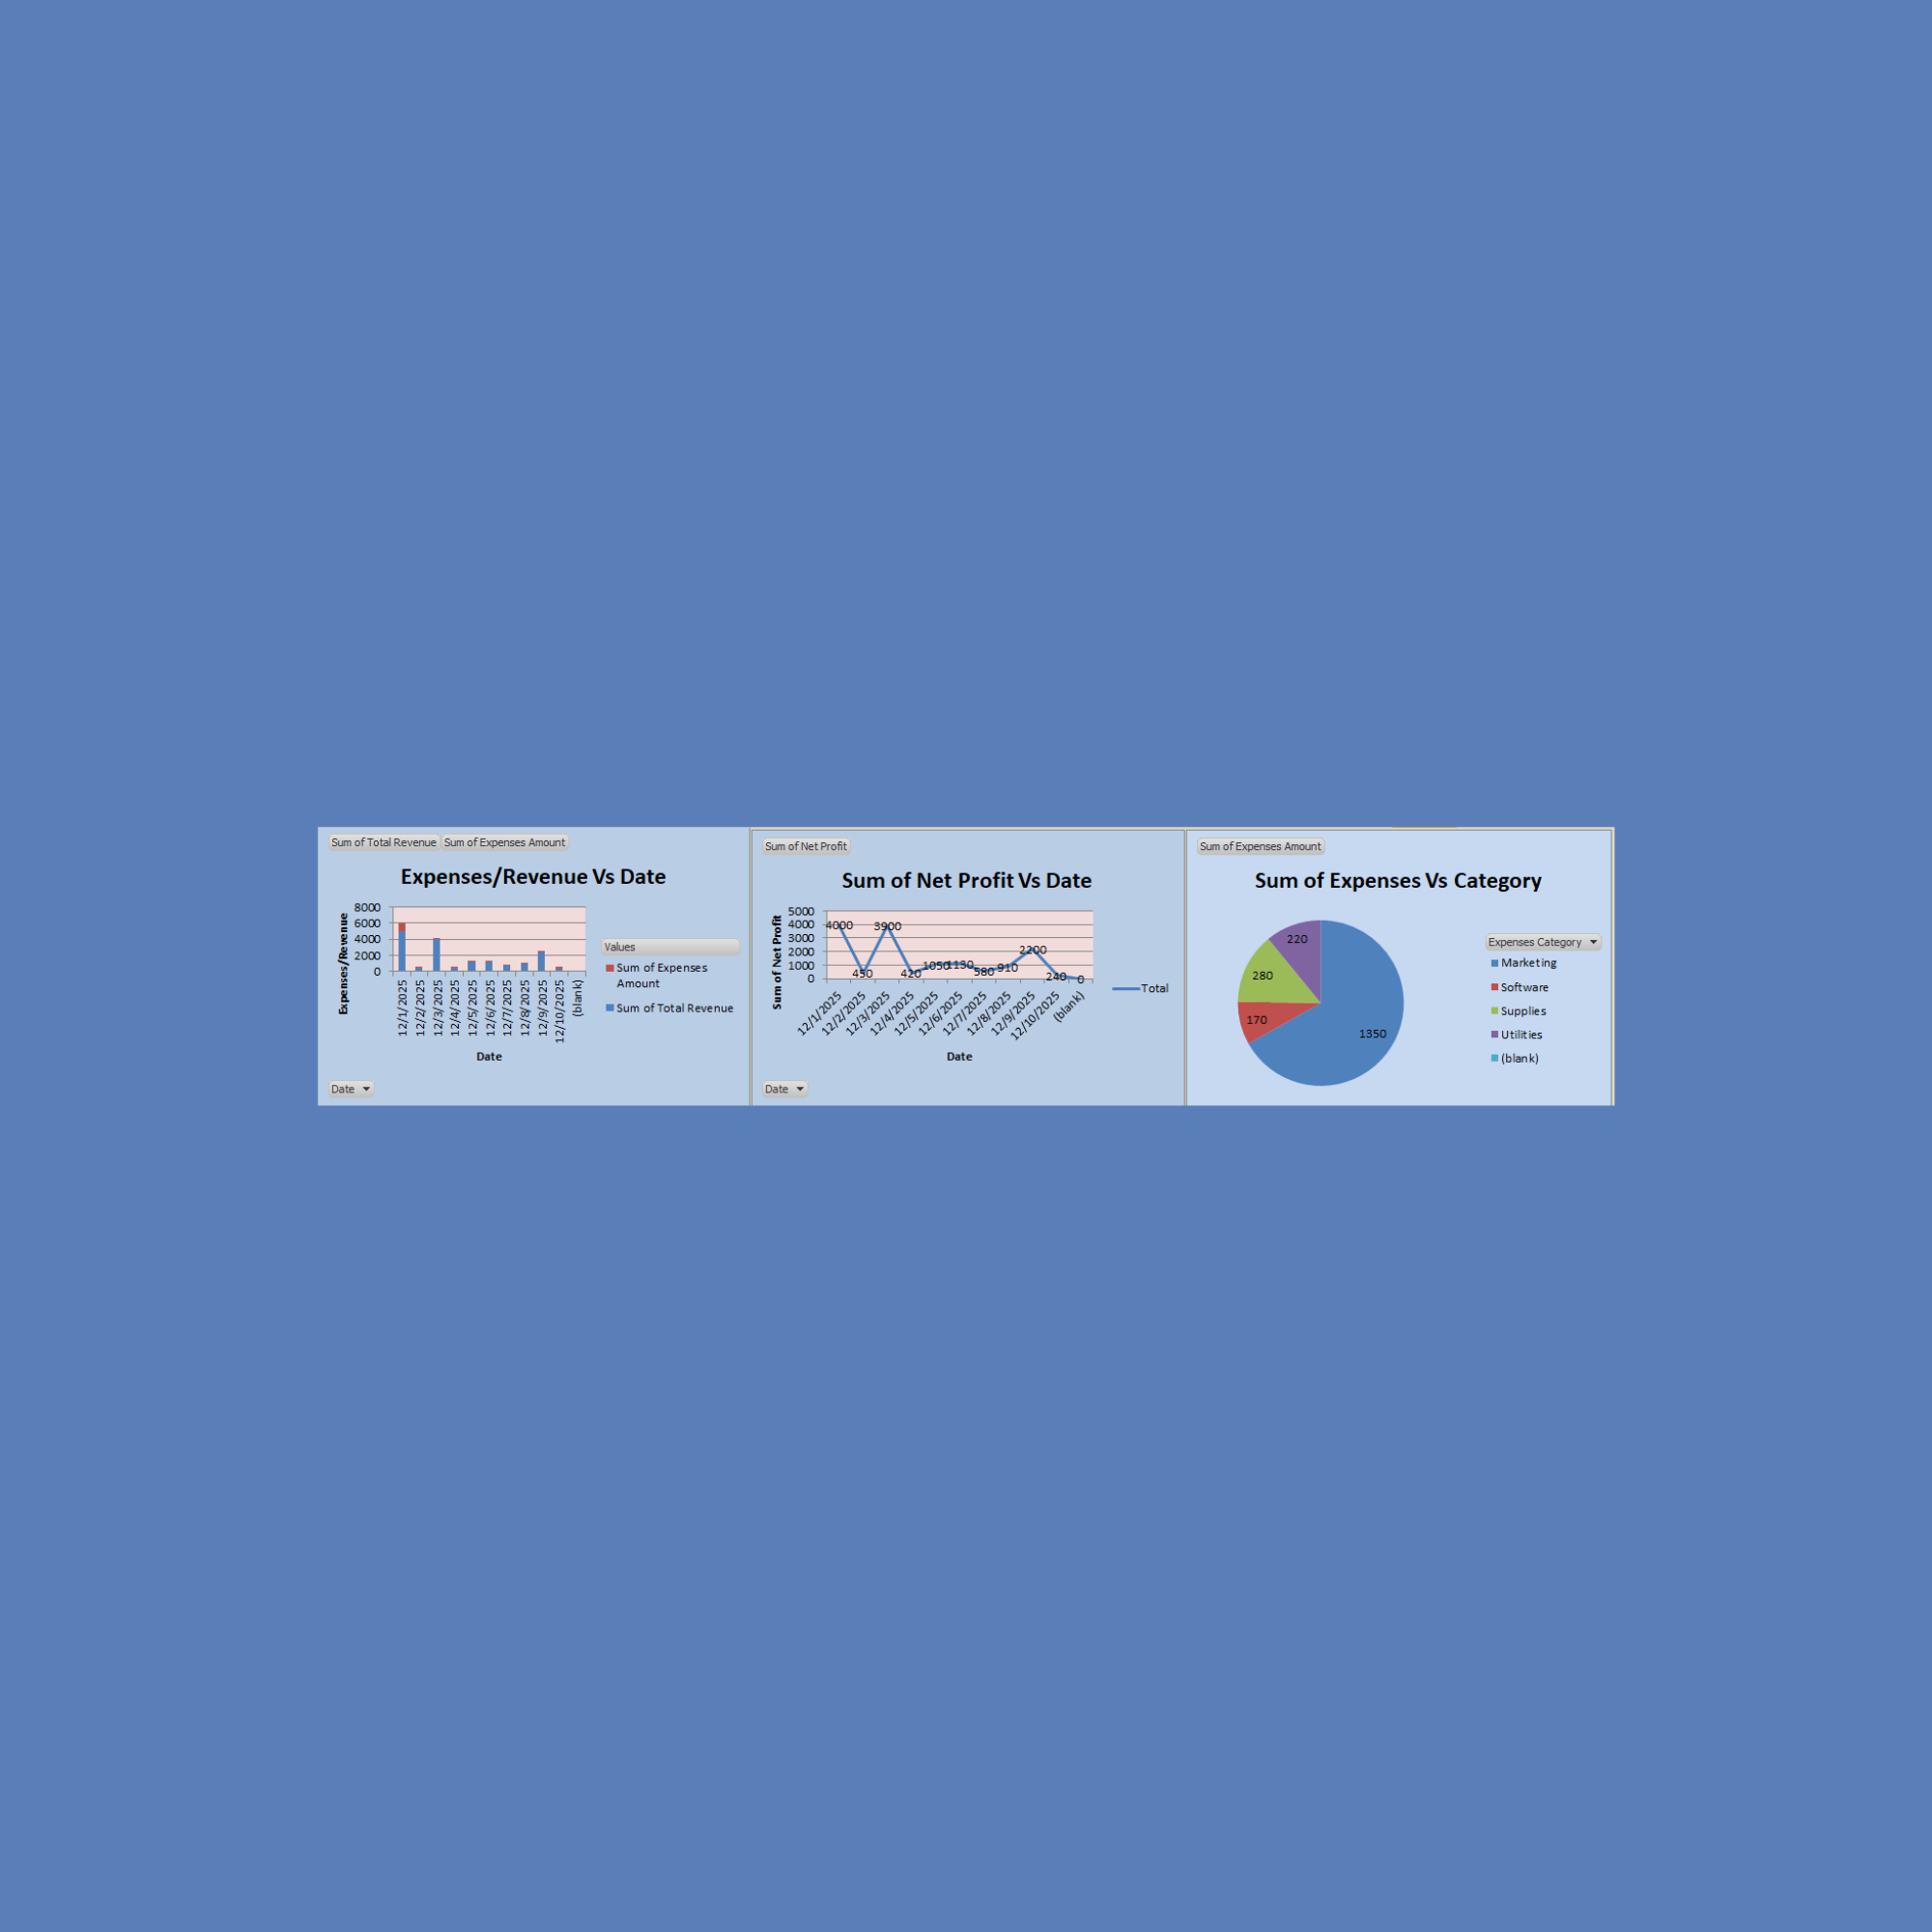
Track Revenue and Profit: Monitor total revenue, expenses, and net profit to understand business financial health.
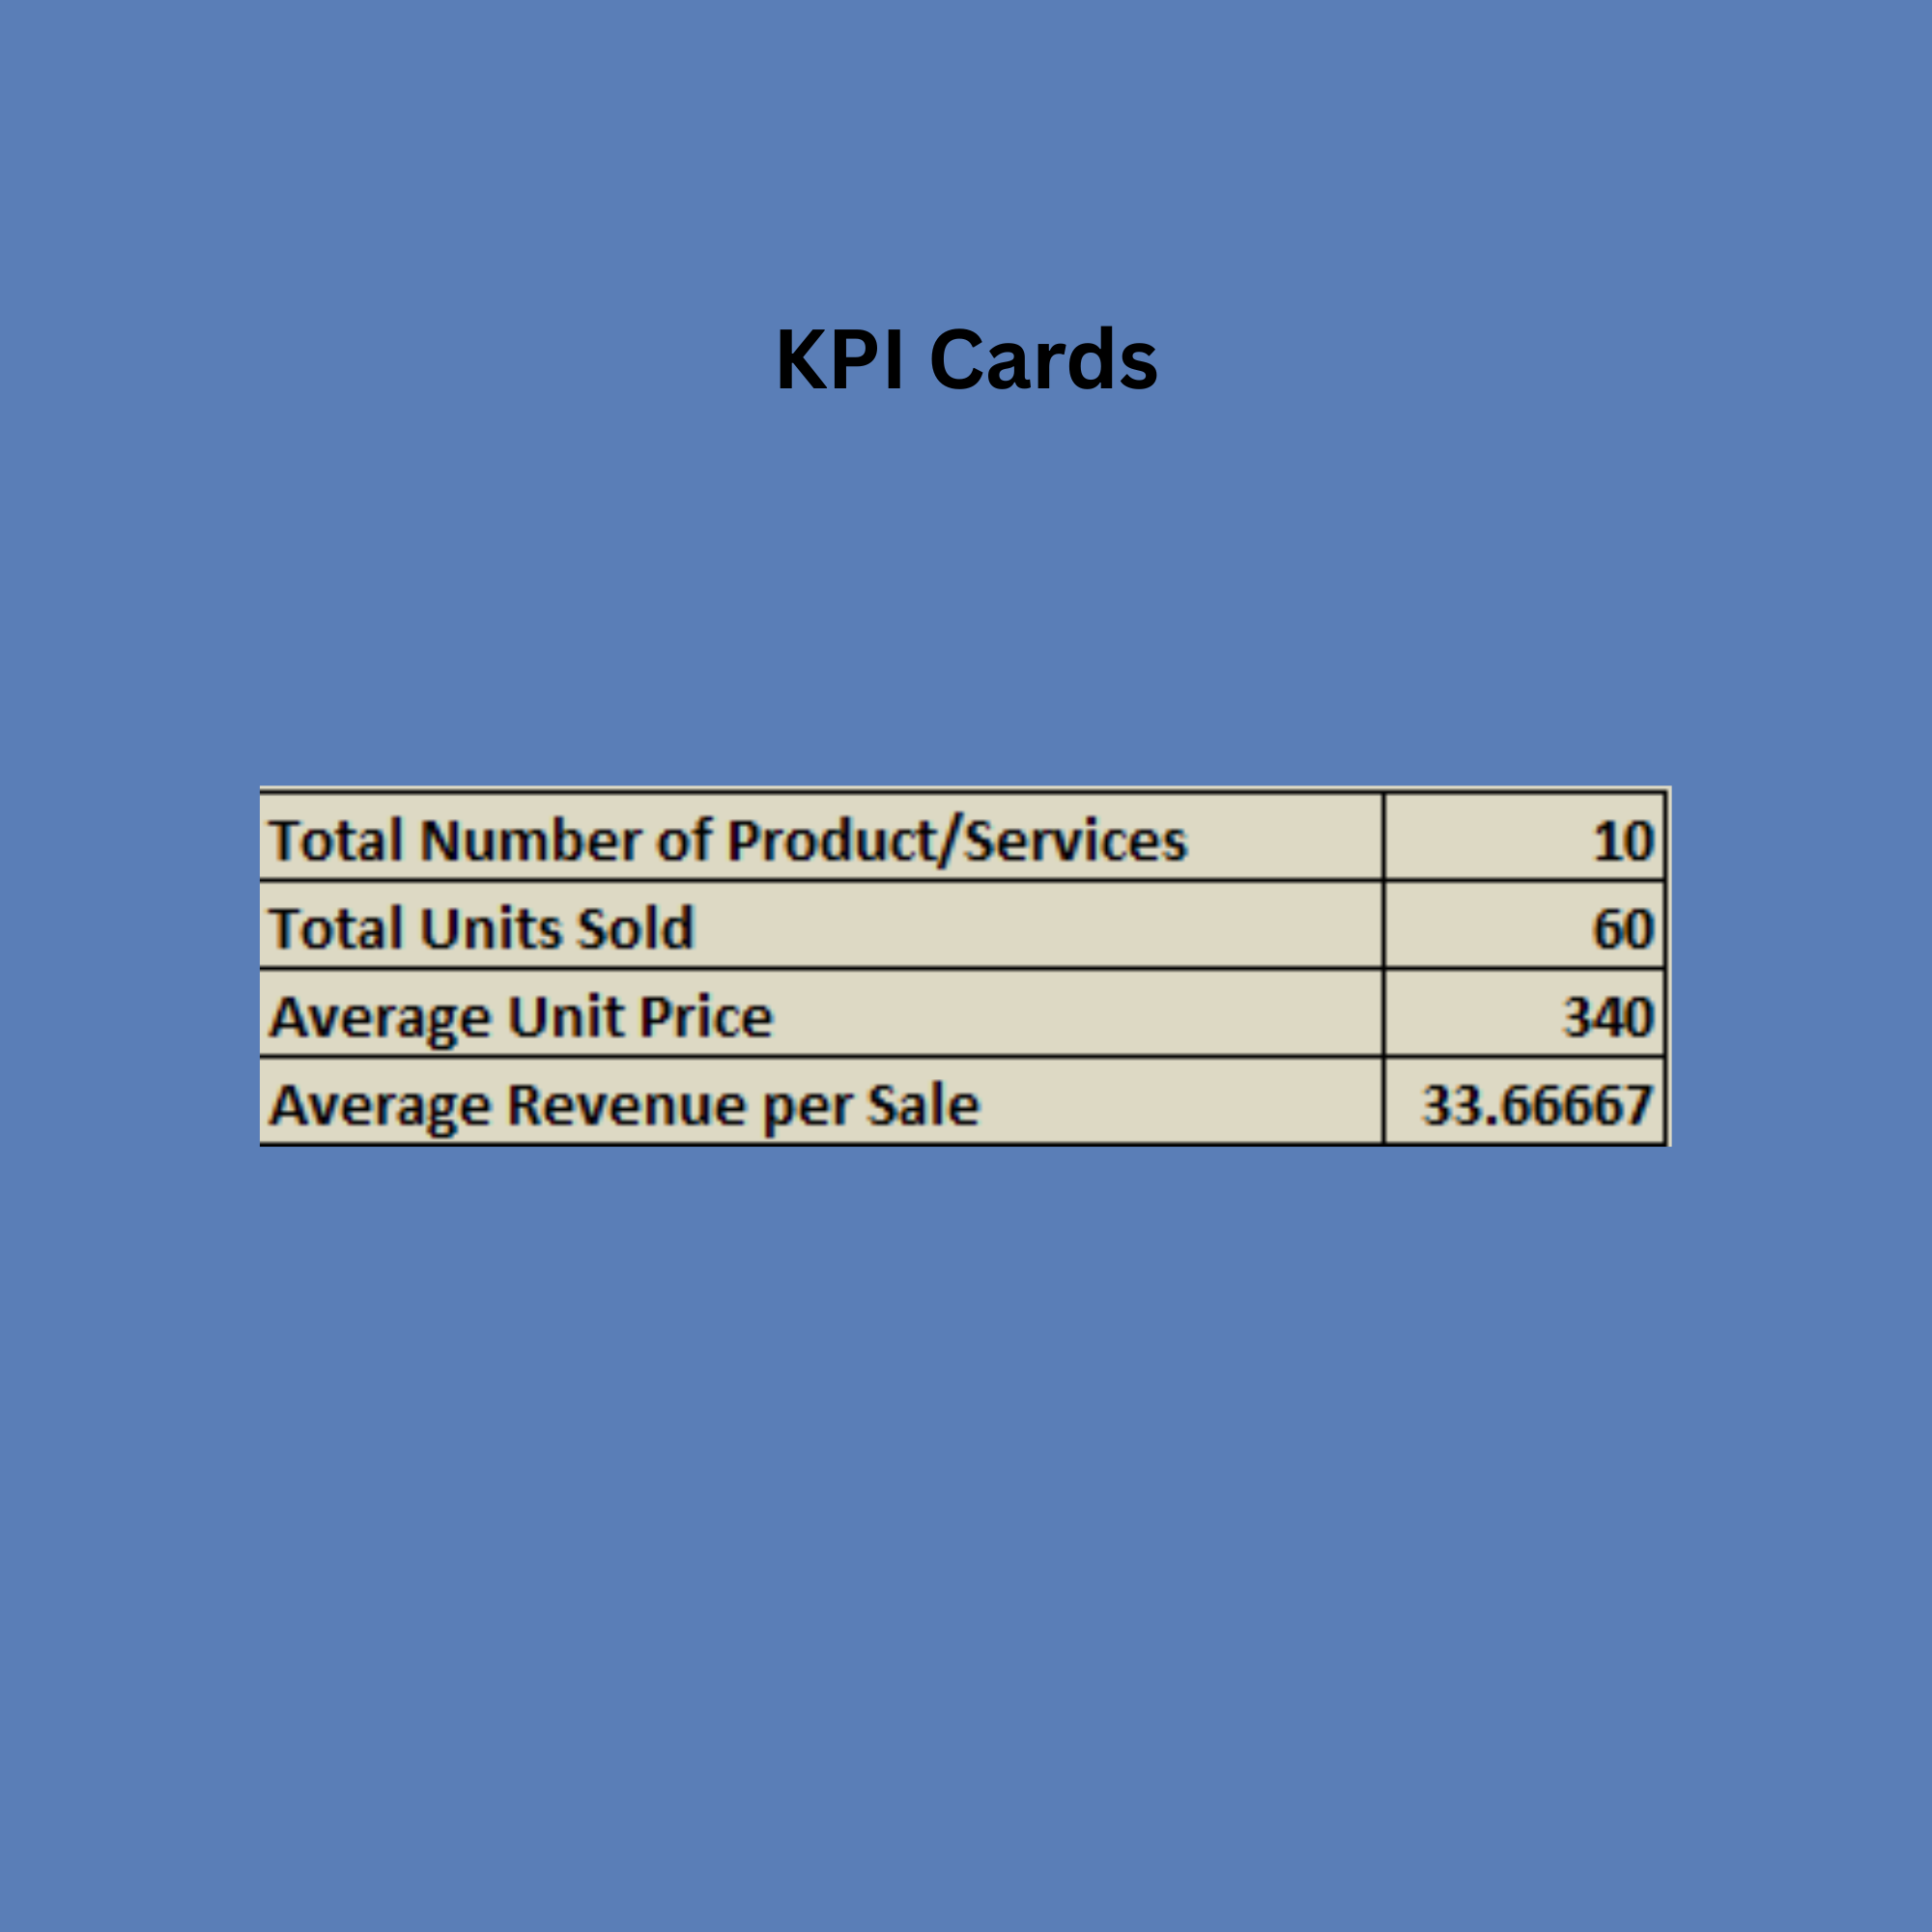
Analyze Key Performance Indicators (KPIs): Quickly evaluate performance metrics like profit margin, revenue growth, and expense trends.
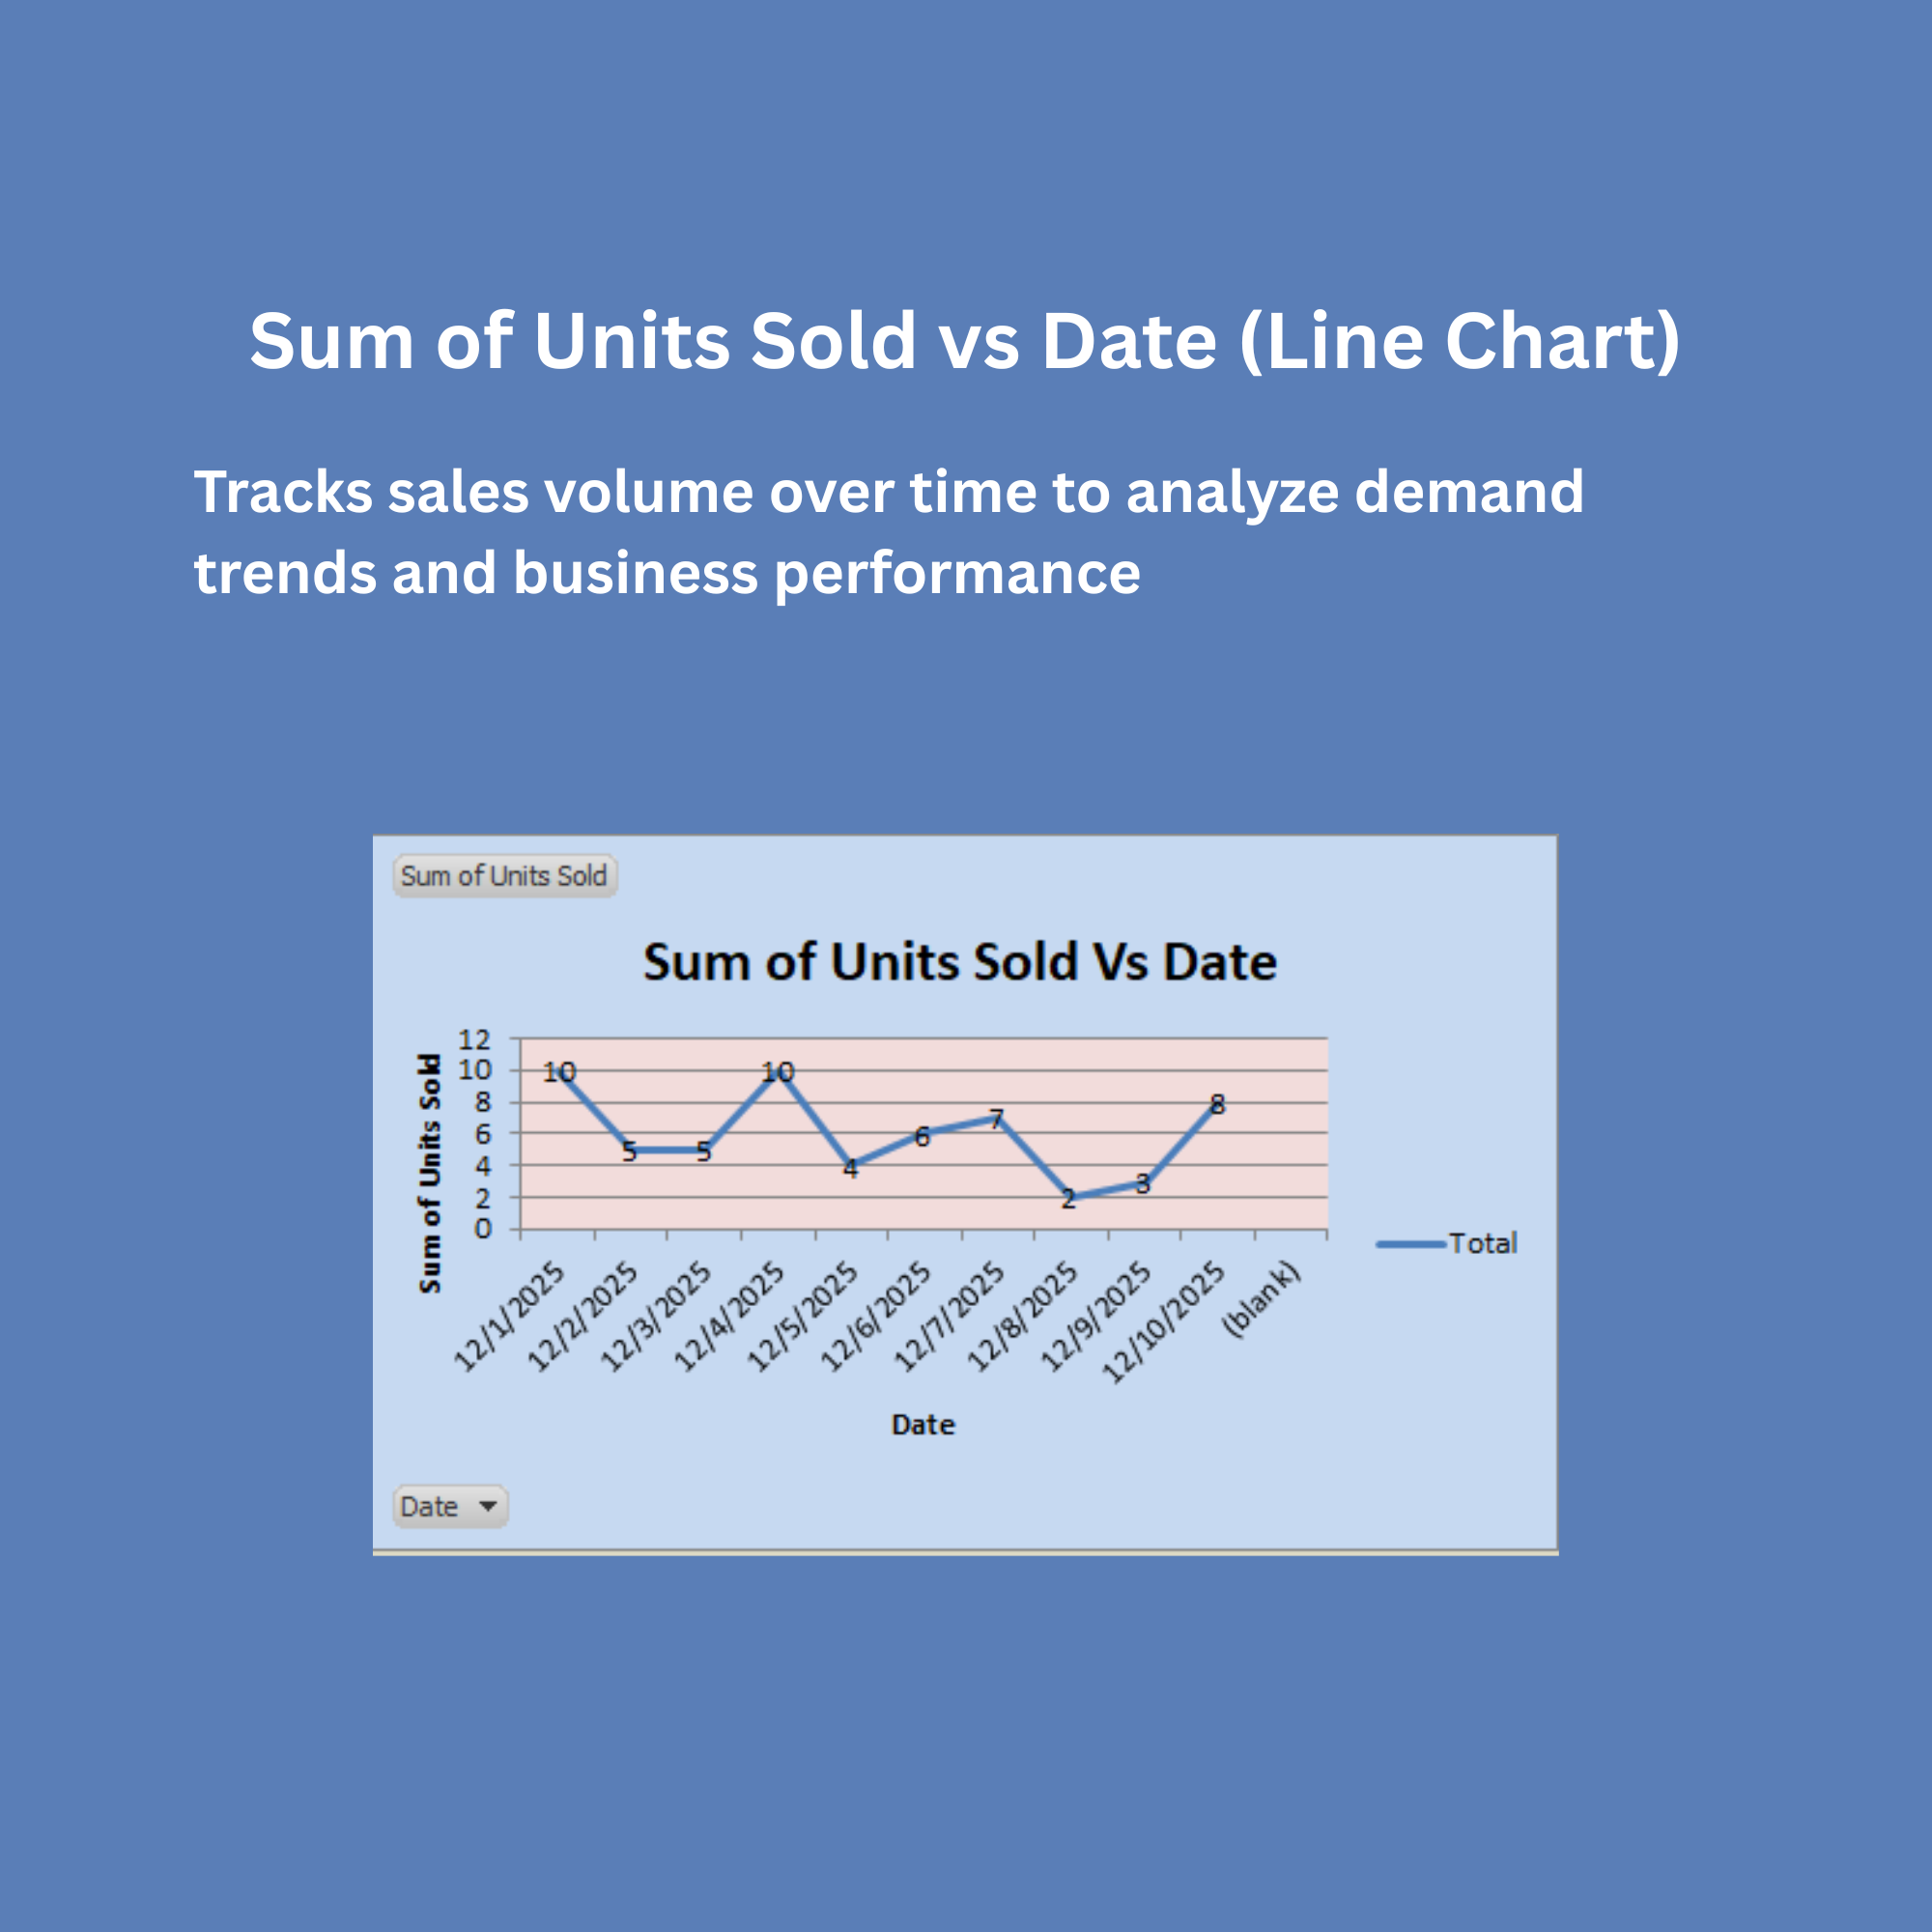
Visualize Business Data: Present data in charts, graphs, and dashboards for easier decision-making.
Identify Trends: Highlight monthly, quarterly, or yearly trends to spot growth opportunities or problem areas.
Support Strategic Decisions: Provide actionable insights to guide business planning and resource allocation.
Customize for Any Business: Flexible design to adapt to small businesses, startups, or medium-sized companies.
Save Time: Pre-built dashboard saves hours compared to building reports from scratch.
Best Practices
Input Clean Data: Ensure revenue and expense data are entered correctly for accurate results.
Update Regularly: Keep monthly or weekly updates to maintain meaningful insights.
Use Dashboard KPIs: Focus on metrics provided in charts for quick decision-making.
Protect Formulas: Lock dashboard calculations if sharing with others to avoid accidental changes.
Customize Branding: Add company name or logo for a professional touch.
Conditions for Which This Dashboard Applies
Business Size: Suitable for small to medium businesses and startups that need a simple, yet powerful way to track revenue and financial performance.
Data Availability: Works best if you have accurate and structured revenue, expense, and sales data ready to input.
Decision-Making Needs: Ideal for businesses that want to analyze KPIs, monitor trends, and make data-driven decisions.
Reporting Frequency: Designed for weekly, monthly, quarterly, or yearly reporting, depending on your business needs.
Software Requirements: Requires Microsoft Excel 2016 or later (or compatible spreadsheet software).
User Skill Level: Suitable for users with basic to intermediate Excel knowledge, including chart interpretation and simple customization.
Customization Needs: Can be adapted to different industries, products, or services by modifying data tables, charts, and labels.
Purpose: Primarily for financial tracking, revenue management, business analysis, and KPI monitoring.
Large Enterprise Systems: Not intended for very large corporations with complex ERP systems like SAP or Oracle.
Incomplete or Messy Data: Will not work properly if your revenue, expense, or sales data is inaccurate, missing, or unstructured.
Non-Financial Analysis: Not suitable for tasks unrelated to business revenue, profit, or KPI tracking, such as HR-only analytics or project scheduling (unless adapted).
Highly Automated Reporting Needs: Not ideal for companies needing real-time, automated dashboards connected directly to databases.
Non-Excel Users: Requires Microsoft Excel 2016 or later (or compatible spreadsheet software), so it won’t work for users relying only on Google Sheets without modification.
Industry-Specific Requirements: May not perfectly fit highly specialized industries (e.g., pharmaceutical compliance reporting, banking regulatory dashboards) without customization.
Minimal Customization: If you need a fully plug-and-play solution for every unique business process, additional adjustment may be required.
This section helps set realistic expectations for buyers, reduce support requests, and increases buyer satisfaction.
