

Last version published: 12/06/2026 11:39
Publication number: ELQ-82892-4
View all versions & Certificate

Midstream Oil & Gas Financial Model 20 Year w/ DCF, Sensitivity Analysis, WACC & IRR
Midstream Oil & Gas Terminal Financial Model 20-year w/ DCF & WACC
AllFinancialModels offer a curated selection of high-quality yet financial model templates designed to support a wide range of business needs.Follow
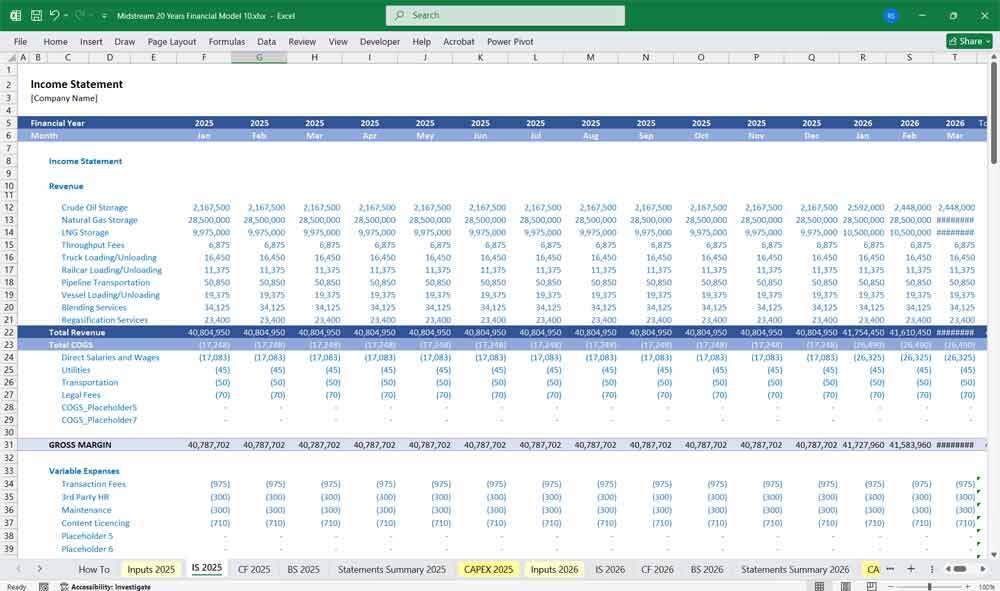
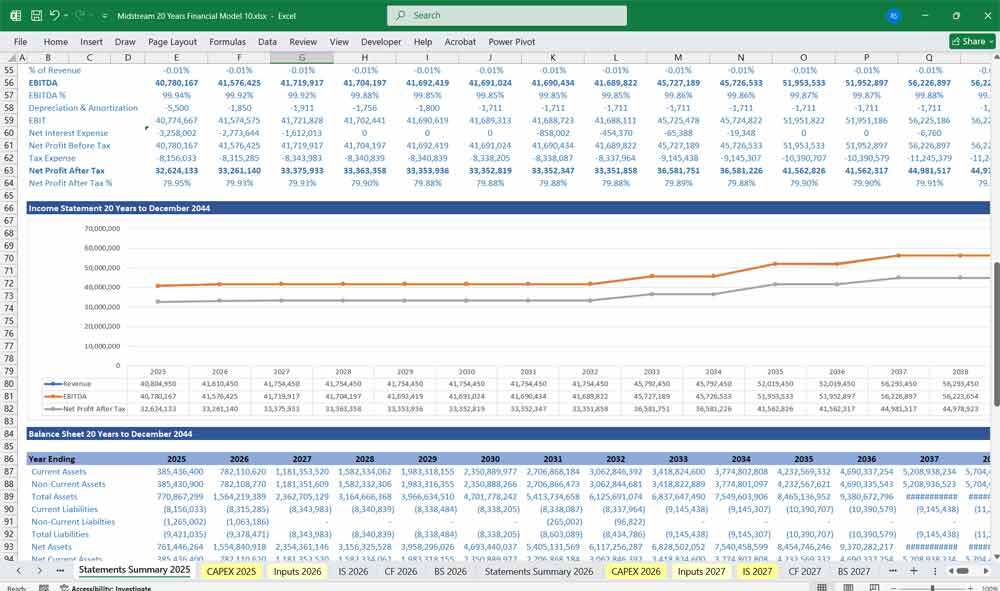
Income Statement (Profit & Loss)The Income Statement Reflecting revenues, expenses, and profitability over a given period (monthly/quarterly/annually).
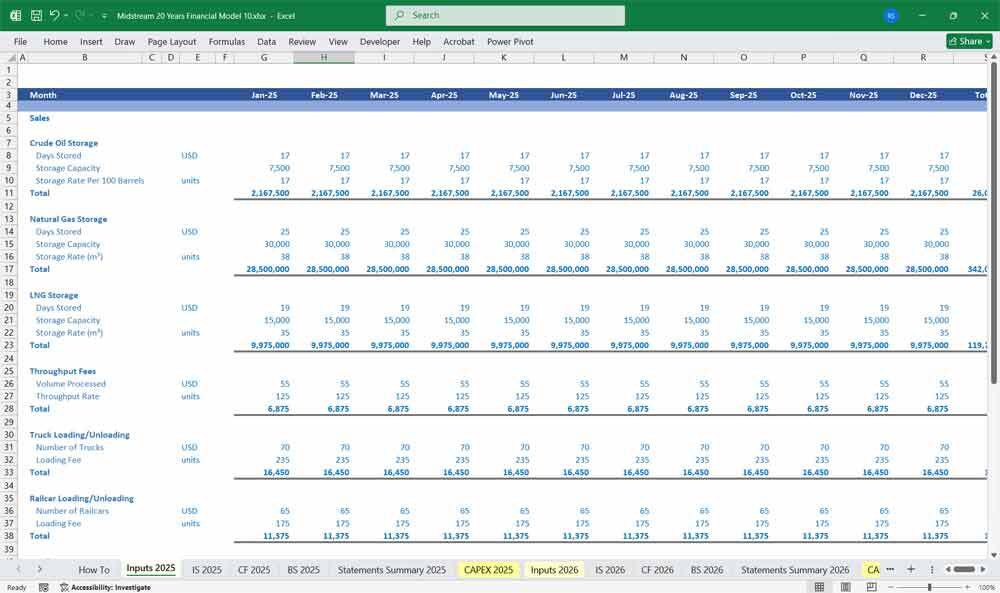
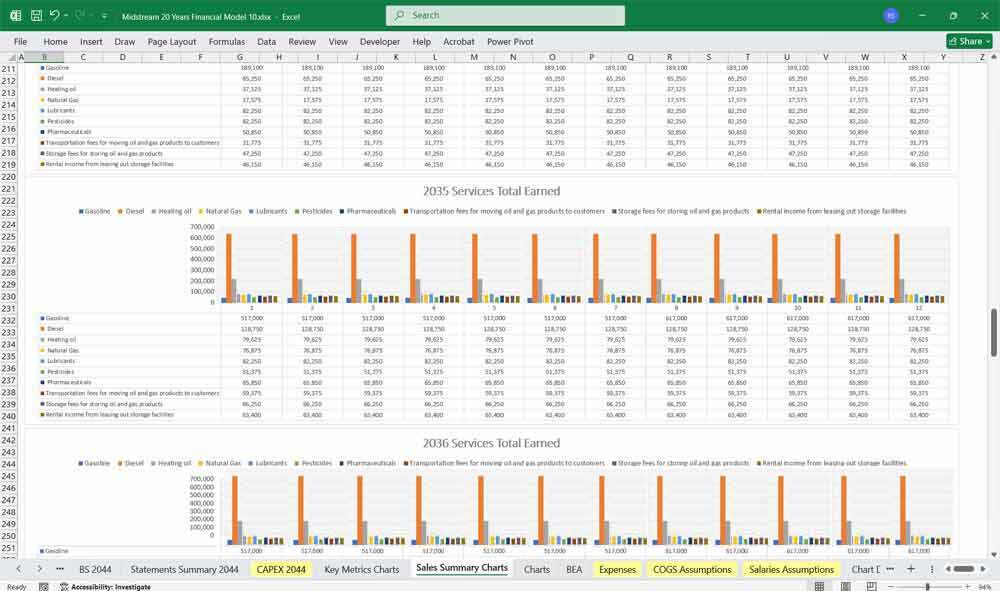
Revenue Streams
- Storage Fees – Charged per barrel/month for crude oil, refined products, or LNG.
- Formula: Storage Revenue = Total Capacity (bbl) × Utilization Rate (%) × Fee per bbl
- Formula: Storage Revenue = Total Capacity (bbl) × Utilization Rate (%) × Fee per bbl
- Throughput Fees – Fees for moving product in/out of the terminal.
- Formula: Throughput Revenue = Volume Handled (bbl) × Fee per bbl
- Formula: Throughput Revenue = Volume Handled (bbl) × Fee per bbl
- Blending & Additive Services – Additional fees for product customization.
- Other Services – Truck/rail loading fees, vapor recovery, heating/cooling charges.
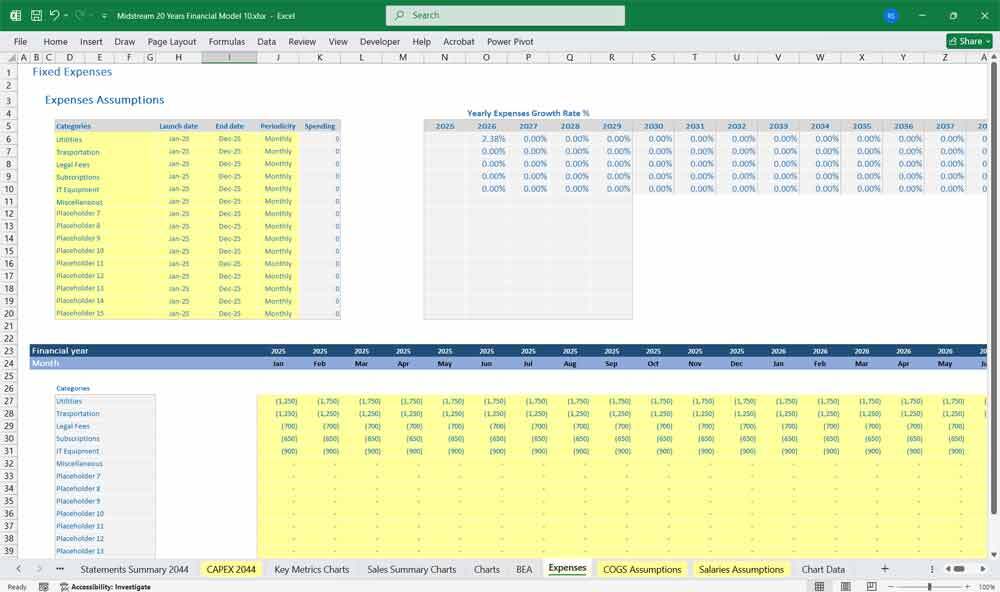
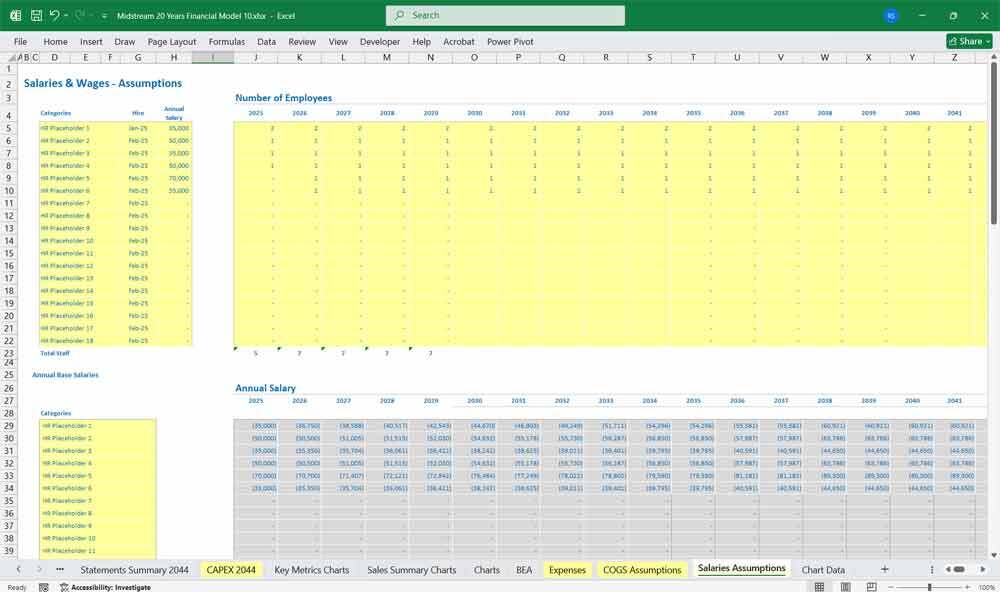
- Fixed Costs
- Labor (salaries, benefits)
- Maintenance & repairs
- Insurance & property taxes
- Utilities (electricity, water, gas)
- Security & environmental compliance
- Labor (salaries, benefits)
- Variable Costs
- Power consumption (pumps, heaters)
- Chemicals (corrosion inhibitors, additives)
- Third-party services (inspections, testing)
- Power consumption (pumps, heaters)
- Straight-line depreciation of terminal assets (tanks, pipelines, loading racks).
- Amortization of intangible assets (permits, software).
- EBITDA = Revenue – OPEX
- EBIT = EBITDA – D&A
- Net Income = EBIT – Interest – Taxes
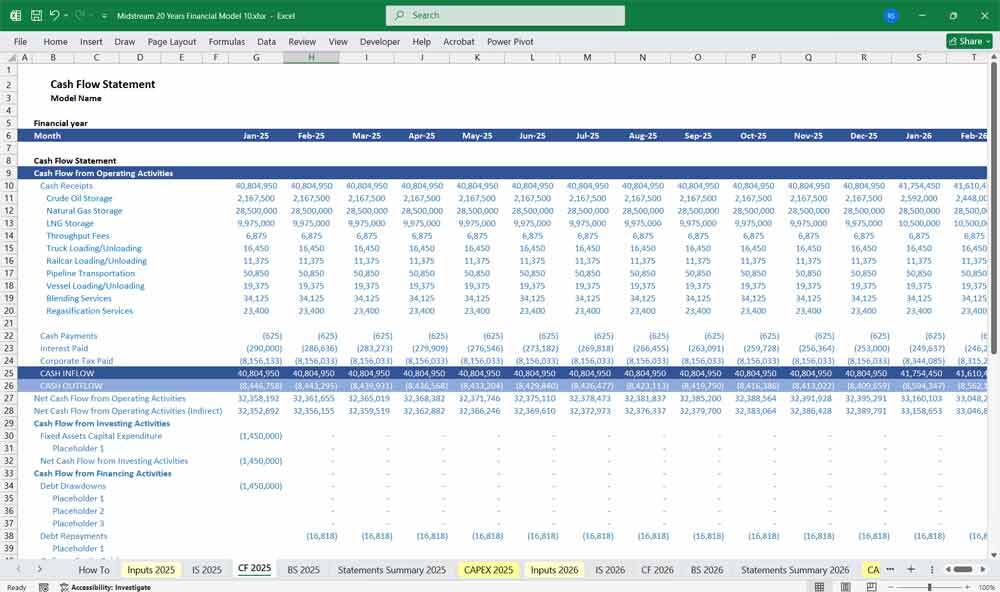
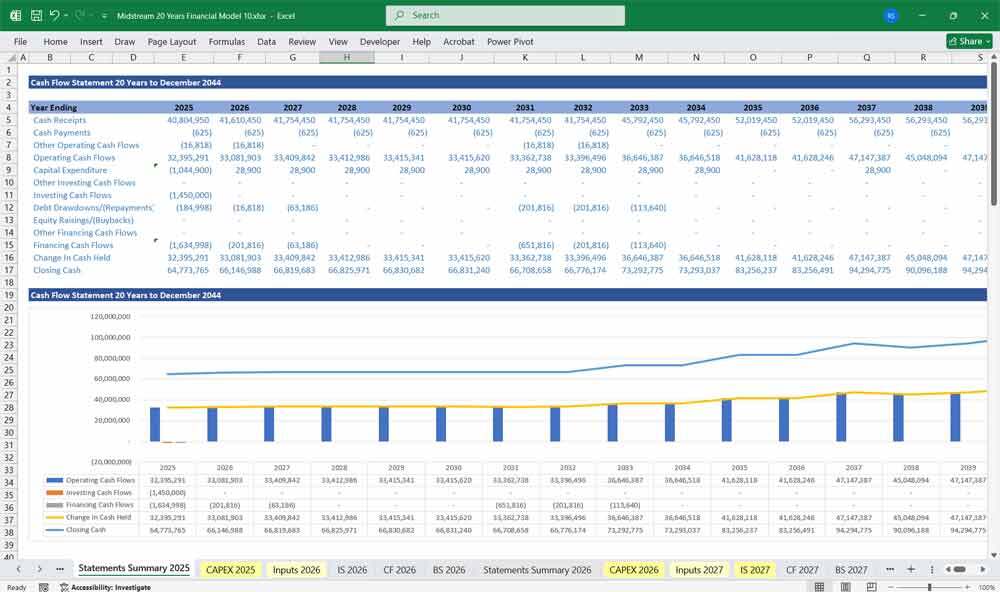
Cash Flow Statement
The Cash Flow Statement tracks actual cash inflows and outflows, split into Operating, Investing, and Financing Activities.
Operating Cash Flow (OCF)
- Cash Collections: Storage & throughput fees received.
- Cash Payments: Salaries, maintenance, utilities, taxes.
- Working Capital Changes:
- Accounts receivable (delayed customer payments)
- Inventory changes (e.g., additives, spare parts)
- Accounts payable (delayed vendor payments)
- Accounts receivable (delayed customer payments)
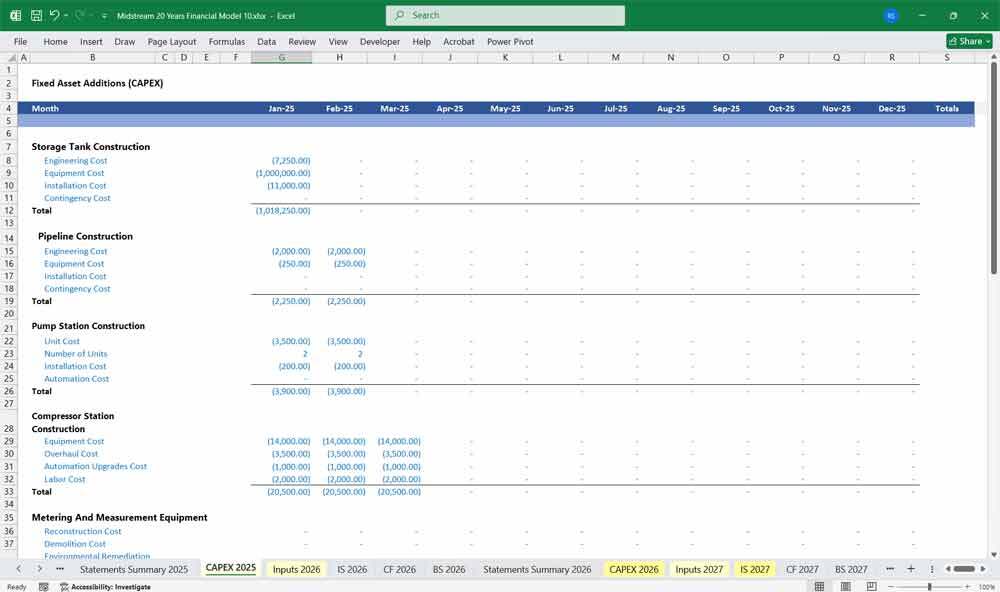
- Growth CapEx: Expansion tanks, new pipelines, automation upgrades.
- Maintenance CapEx: Tank refurbishments, pump replacements.
- Debt Issuance/Payments: Loan drawdowns, principal repayments.
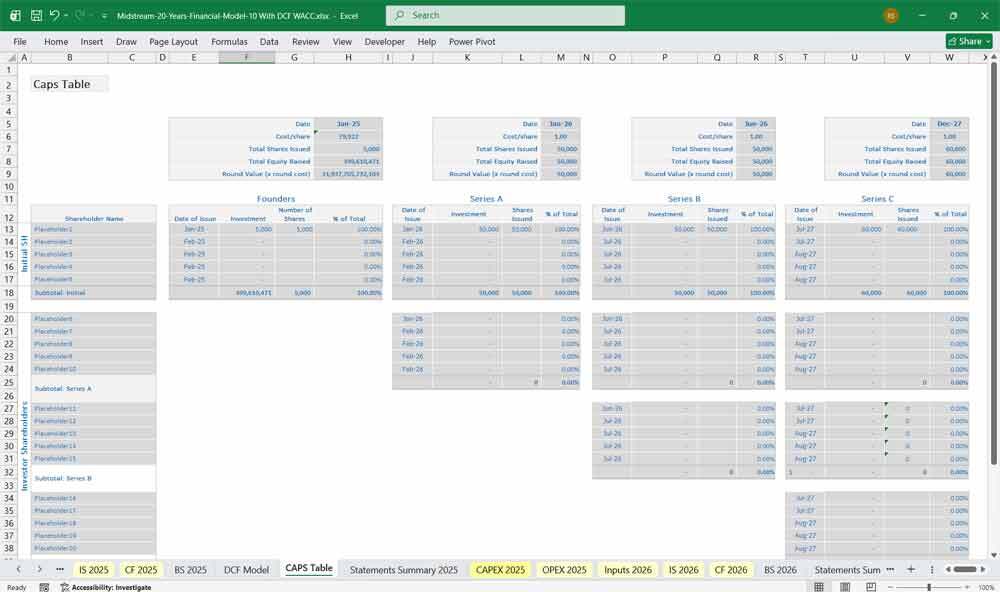
- Equity Financing: Investor capital injections.
- Dividends: Distributions to shareholders (if applicable).
Net Cash Flow = OCF + Investing CF + Financing CF
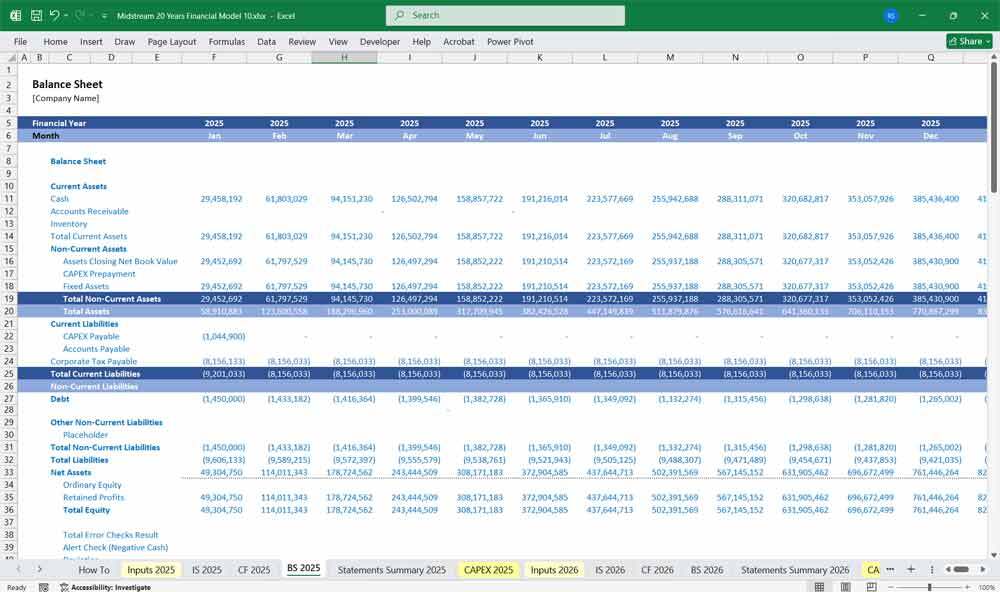
Balance Sheet
The Balance Sheet provides a snapshot of the terminal’s assets, liabilities, and equity at a point in time.
Assets
- Current Assets
- Cash & cash equivalents
- Accounts receivable (unpaid fees)
- Inventory (spare parts, chemicals)
- Cash & cash equivalents
- Non-Current Assets
- PP&E (Property, Plant & Equipment)
- Tanks, pipelines, loading racks
- Land & buildings
- Tanks, pipelines, loading racks
- Intangible Assets
- Permits, licenses, software
- Permits, licenses, software
- PP&E (Property, Plant & Equipment)
- Current Liabilities
- Accounts payable (unpaid vendors)
- Short-term debt (due within 1 year)
- Accrued expenses (wages, taxes)
- Accounts payable (unpaid vendors)
- Non-Current Liabilities
- Long-term debt (bank loans, bonds)
- Deferred tax liabilities
- Long-term debt (bank loans, bonds)
- Shareholder equity (initial capital + retained earnings)
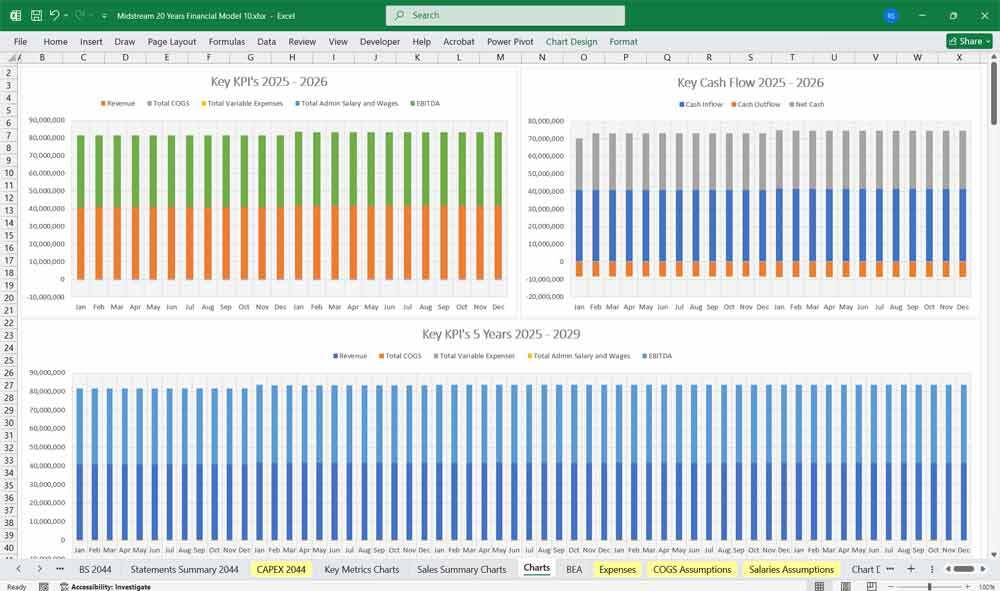
Key Financial Metrics for Midstream Terminal Valuation
- EBITDA Margin = EBITDA / Revenue
- Free Cash Flow (FCF) = OCF – Maintenance CapEx
- Debt/EBITDA Ratio = Total Debt / EBITDA
- Return on Invested Capital (ROIC) = EBIT / (Debt + Equity)
This financial model helps assess the terminal’s profitability, liquidity, and investment returns. Sensitivity analysis should be conducted on utilization rates, fee structures, and oil price volatility to evaluate risks.
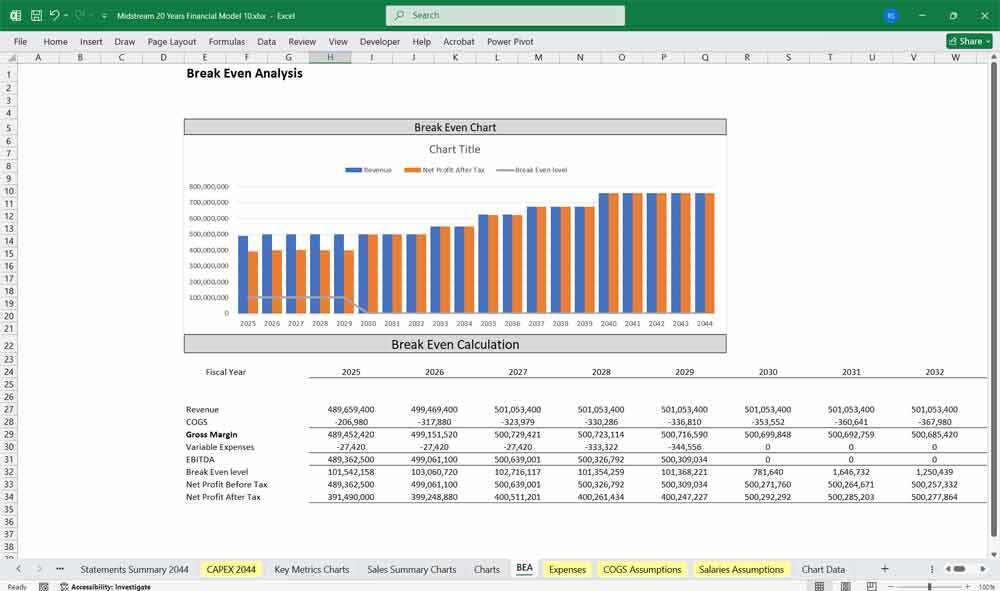
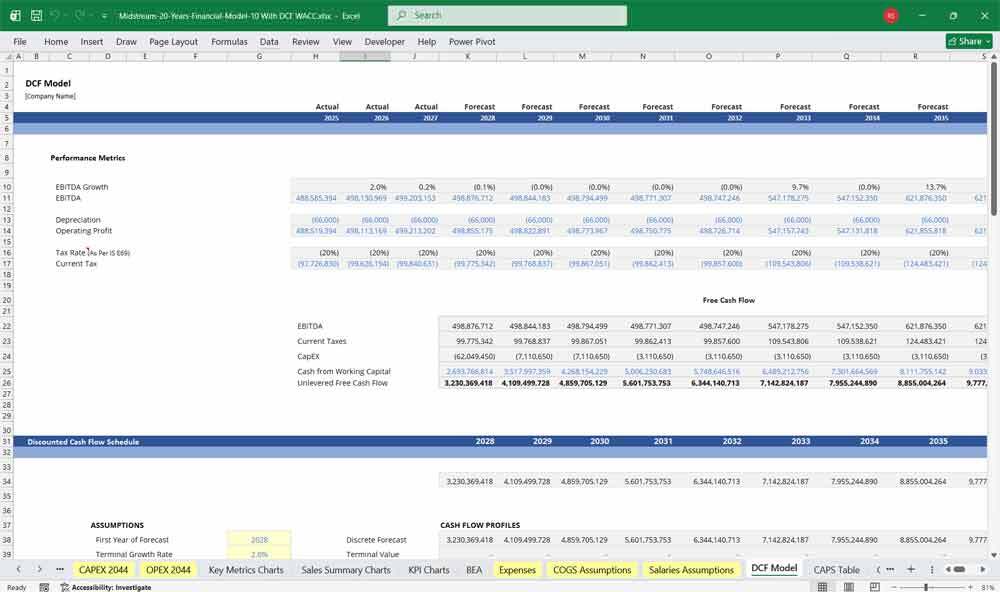
DCF in a Midstream Environment
In a midstream oil and gas terminal—where assets like storage tanks, pipelines, and loading racks generate stable, tolling-based revenue—Discounted Cash Flow (DCF) analysis is the preferred valuation method. The model projects unlevered free cash flows over the terminal’s economic life, 20 years, capturing fixed capacity fees, throughput tariffs, and occasional maintenance capital expenditures. Since these cash flows are generally less volatile than upstream production, the DCF relies heavily on the stability of long-term contracts with refineries or producers, making the choice of discount rate and terminal value critical.
Midstream WACC
The Weighted Average Cost of Capital (WACC) serves as the discount rate, reflecting the blended cost of debt and equity financing. For a midstream terminal, WACC often ranges from 6% to 10%, lower than upstream oil and gas due to lower commodity price risk. However, it varies with leverage: terminals with high fixed assets can support 50–60% debt, reducing WACC via cheaper after-tax interest. But regulatory risks, environmental liabilities, or customer concentration could raise the cost of equity. Calculating WACC precisely matters—a 1% underestimate can overvalue the terminal by 15–20%.
Midstream Terminal Sensitivity
Sensitivity analysis addresses key valuation uncertainties by testing how changes in inputs affect the DCF outcome. For a terminal, analysts flex variables like throughput volume (e.g., ±10%), operating expenses (inflation-driven), and WACC (±100–200 basis points). This helps management hedge risks—for instance, securing a 15-year take-or-pay contract reduces cash flow uncertainty, narrowing the sensitivity range and potentially lowering the WACC.
This Best Practice includes
1 Excel Financial Model
Further information
Provides thorough oversight, tracking, and reporting of Midstream Terminal finances, including updates on budget utilisation and projections.
