

Originally published: 31/12/2024 15:18
Last version published: 20/01/2025 08:13
Publication number: ELQ-98849-2
View all versions & Certificate
Last version published: 20/01/2025 08:13
Publication number: ELQ-98849-2
View all versions & Certificate

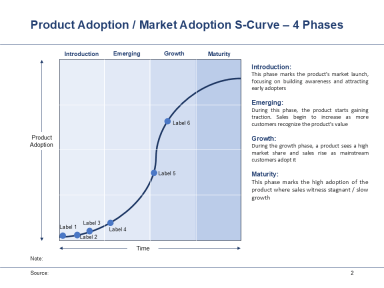
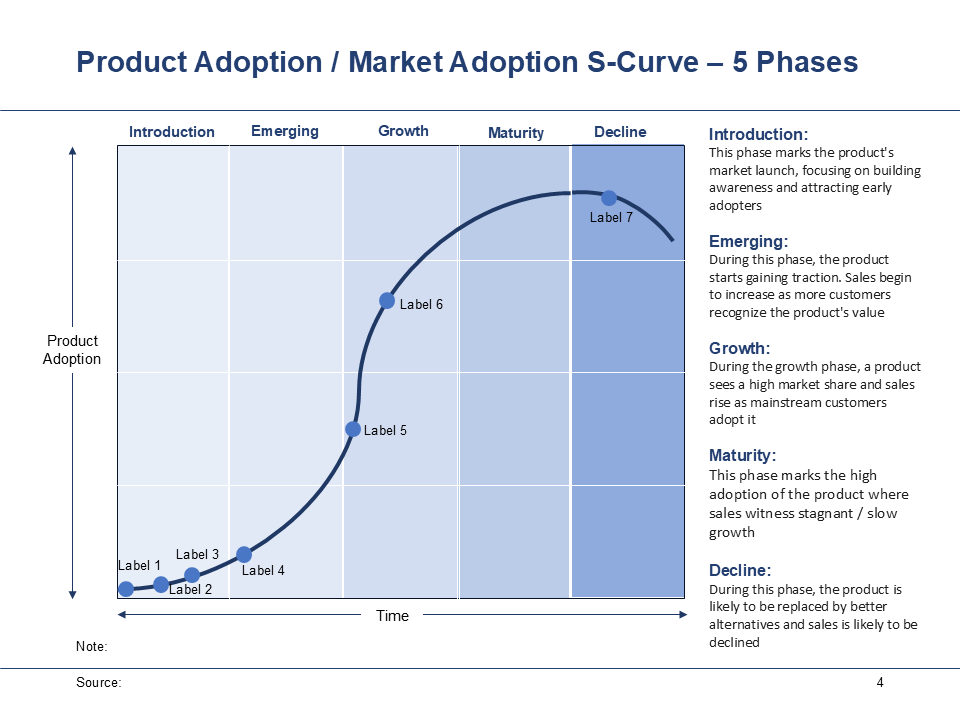
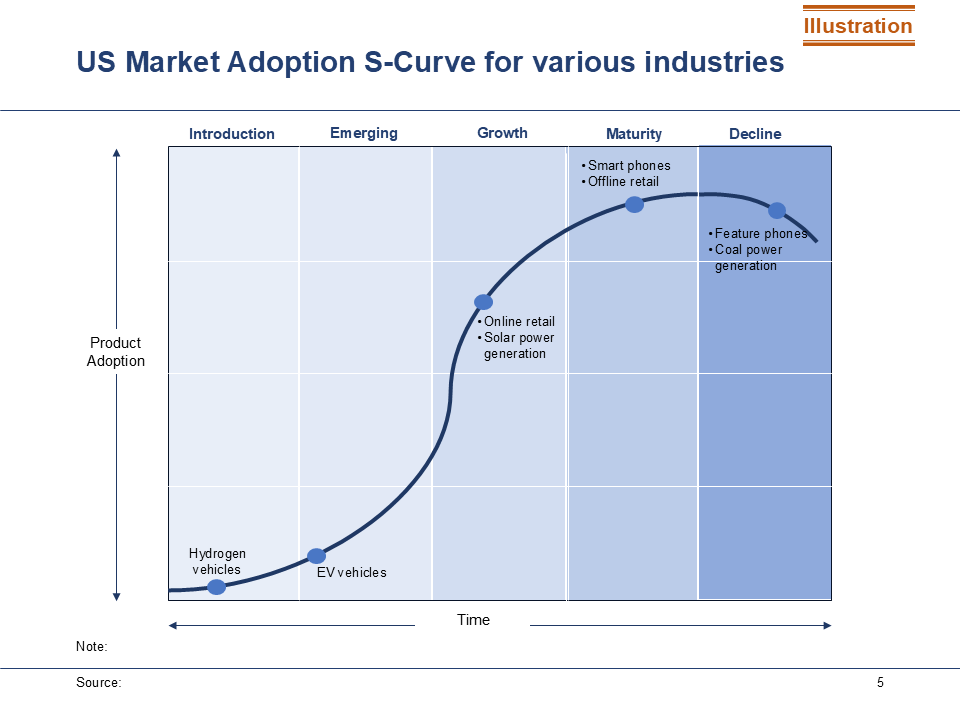
Product and Market Adoption S Curve
S-curve for market / product adoption templates (with Illustrations) for market analysis, product innovation and strategy deliverables
