Originally published: 12/03/2020 15:41
Last version published: 23/04/2021 19:34
Publication number: ELQ-63520-4
View all versions & Certificate
Last version published: 23/04/2021 19:34
Publication number: ELQ-63520-4
View all versions & Certificate

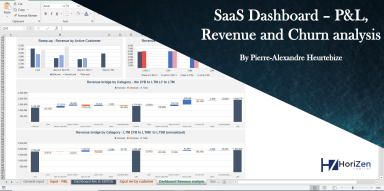
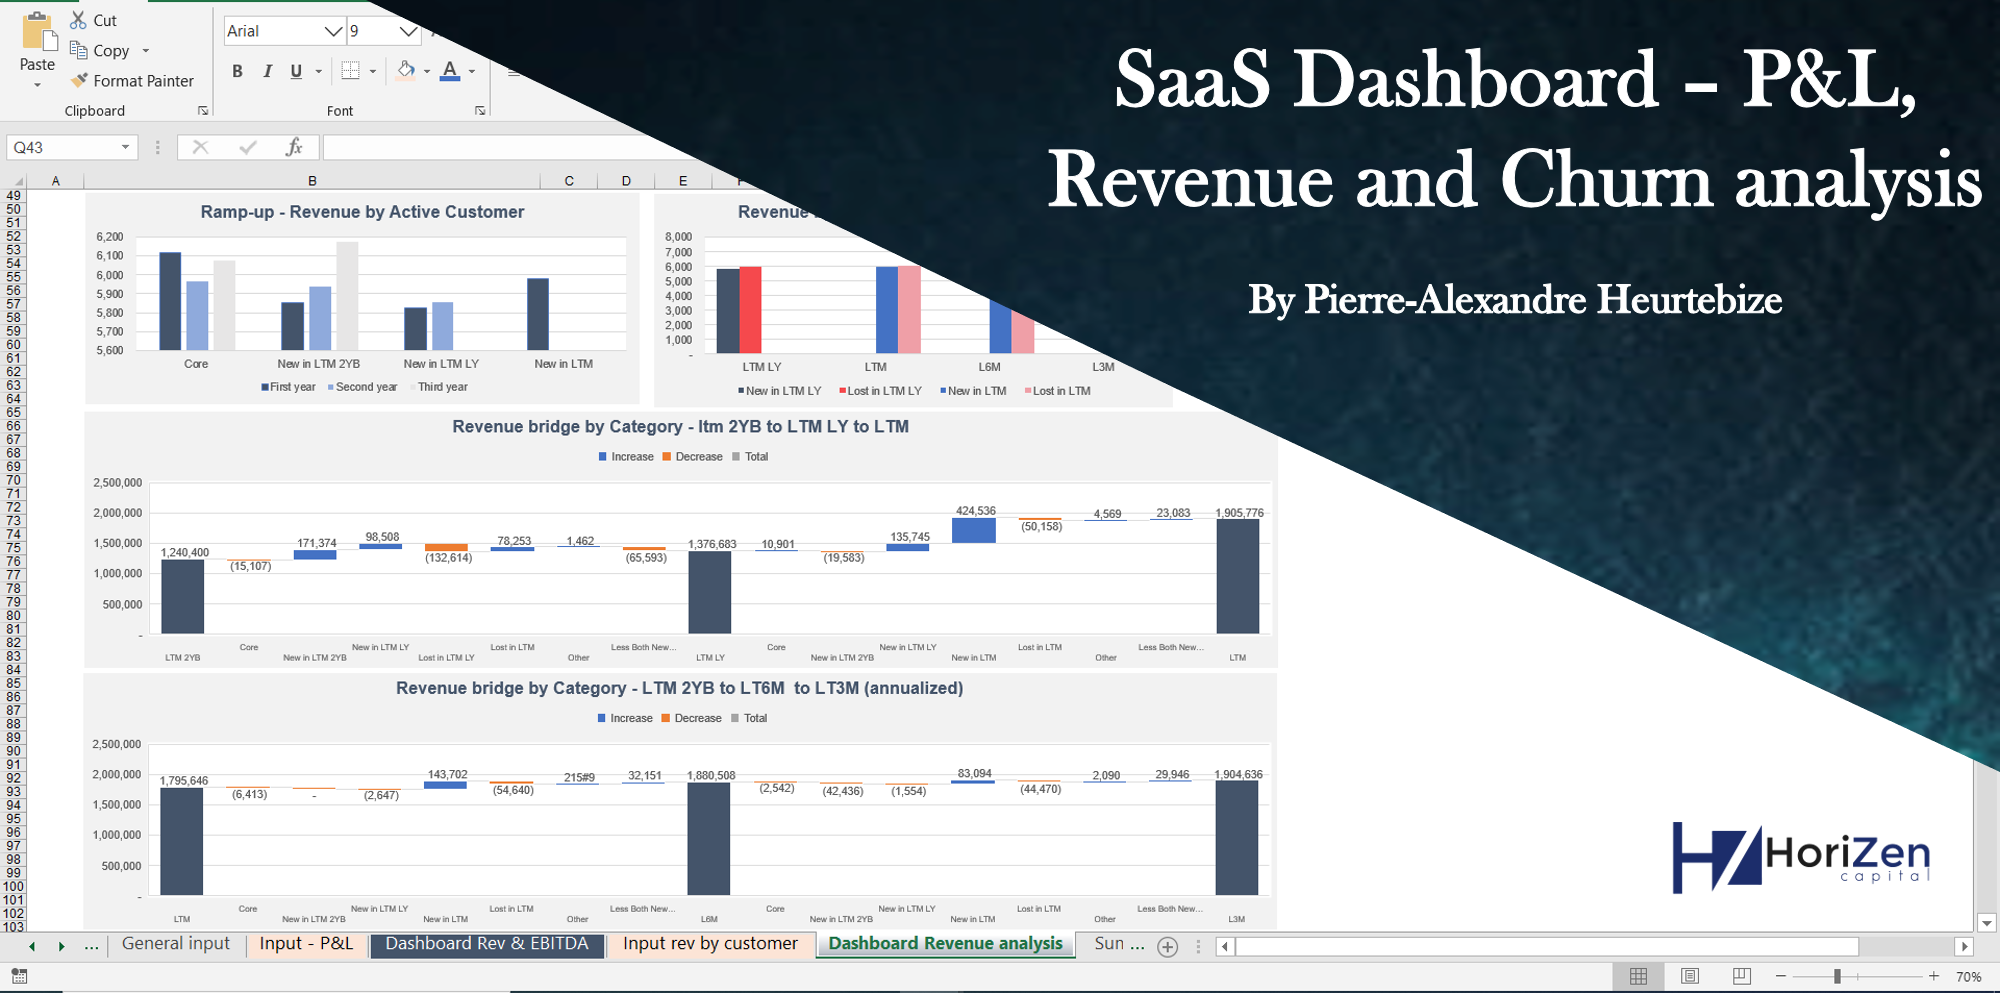
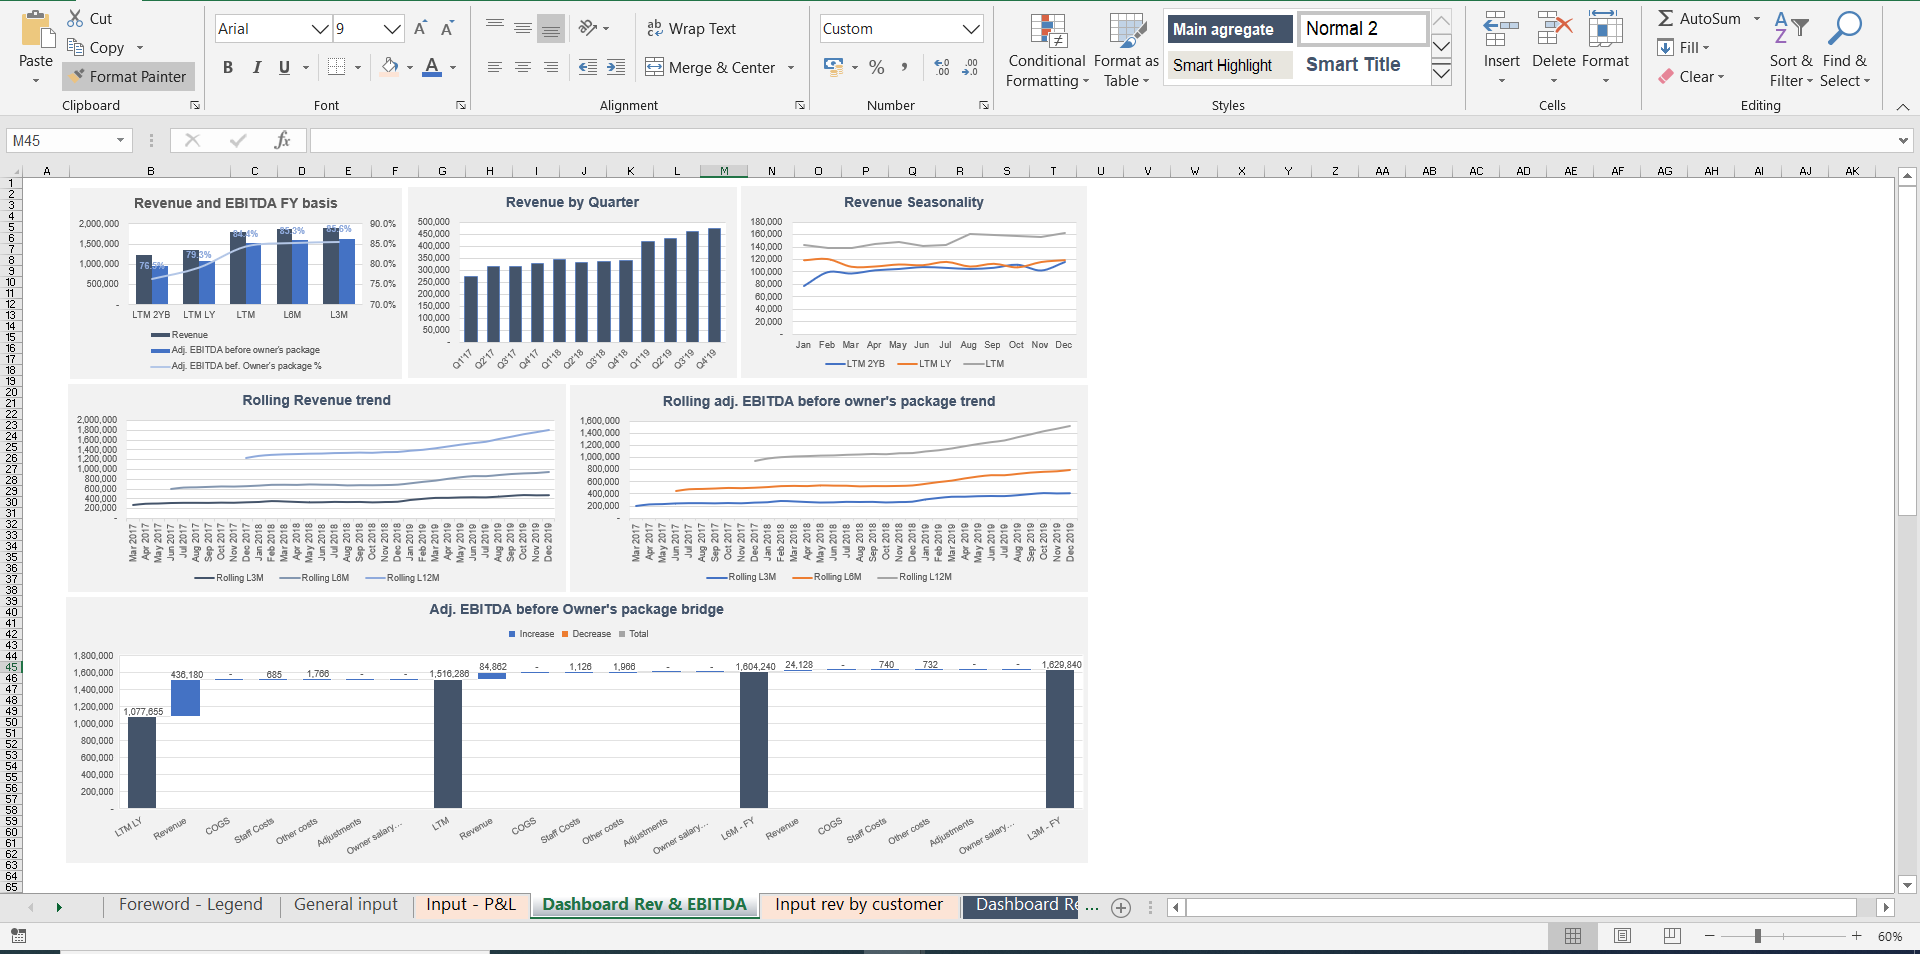
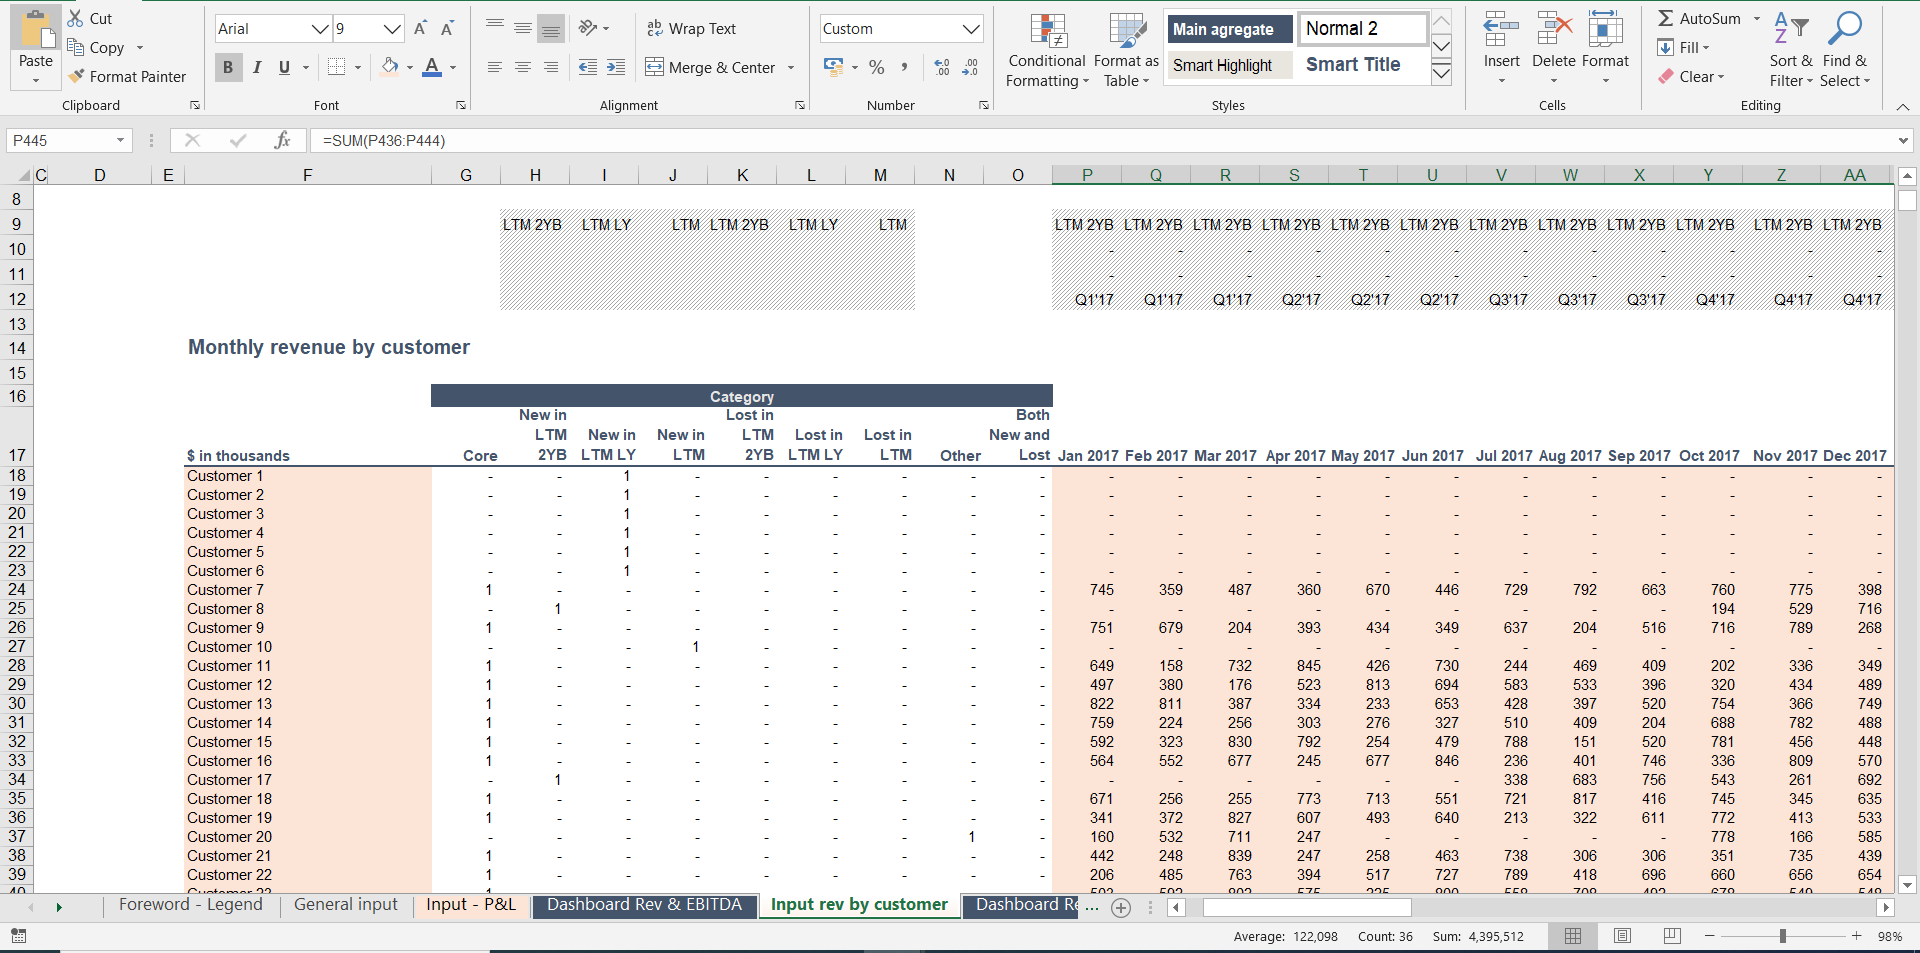
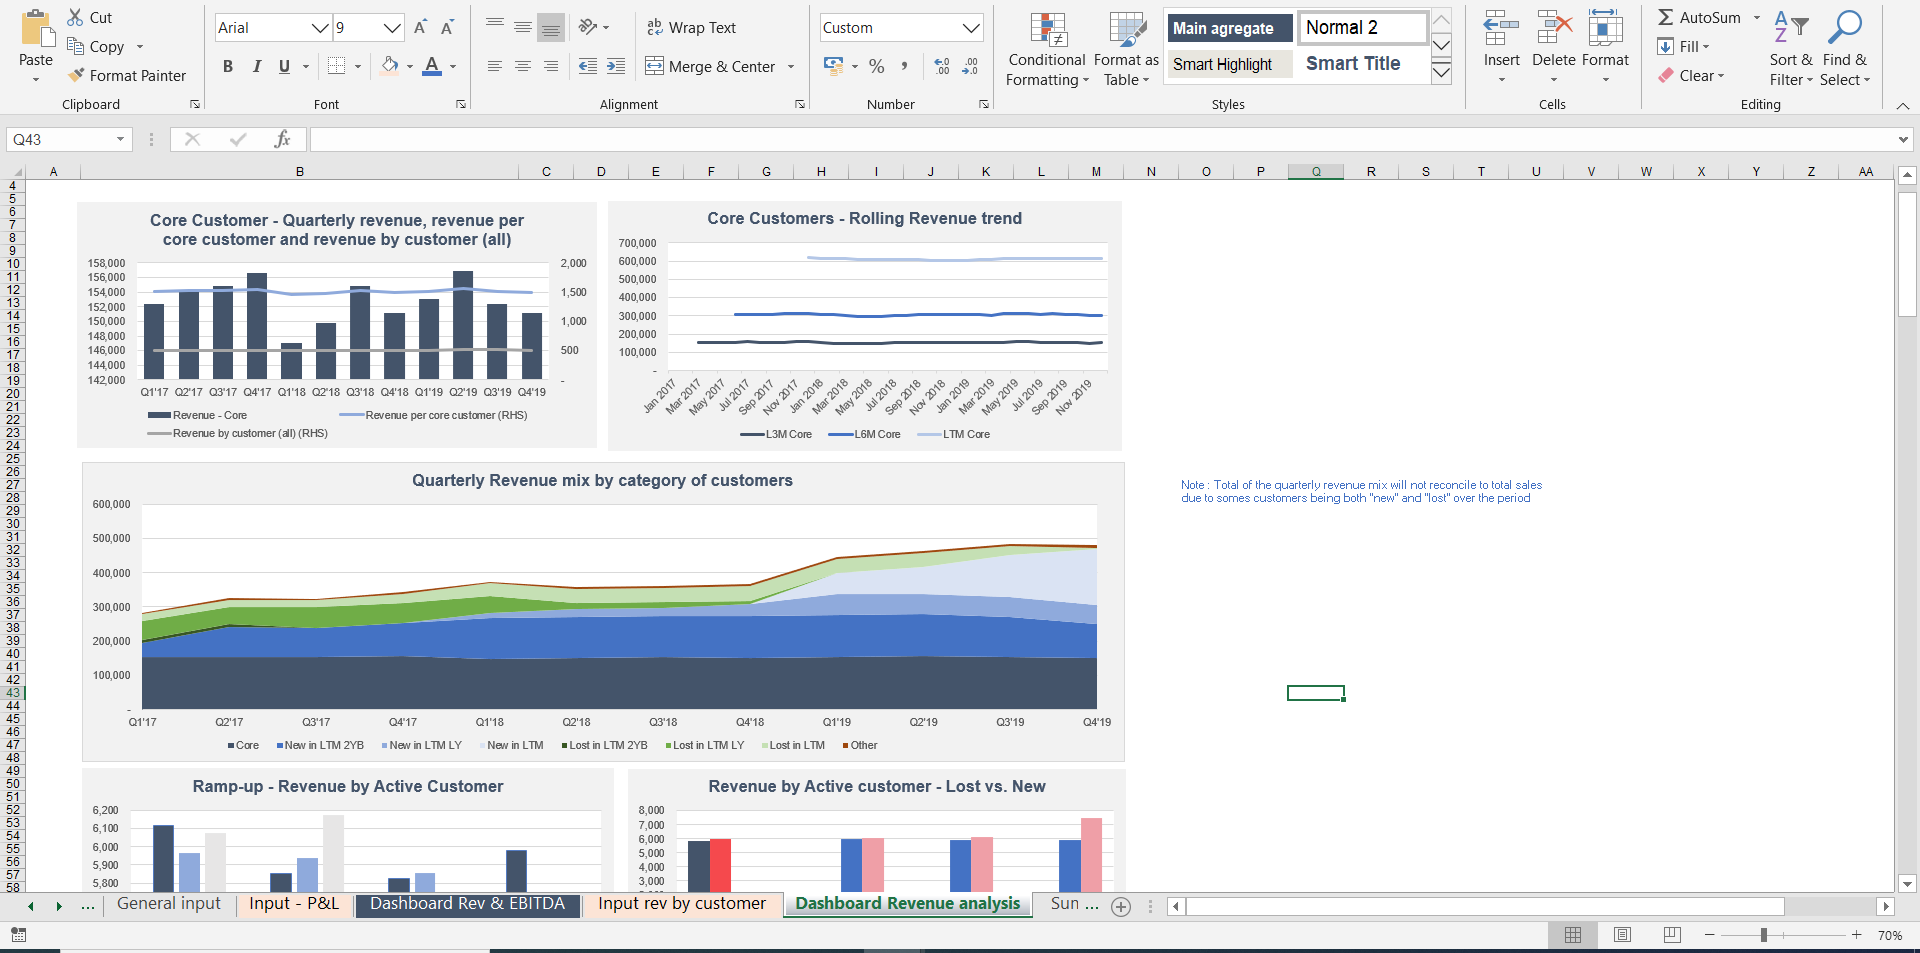
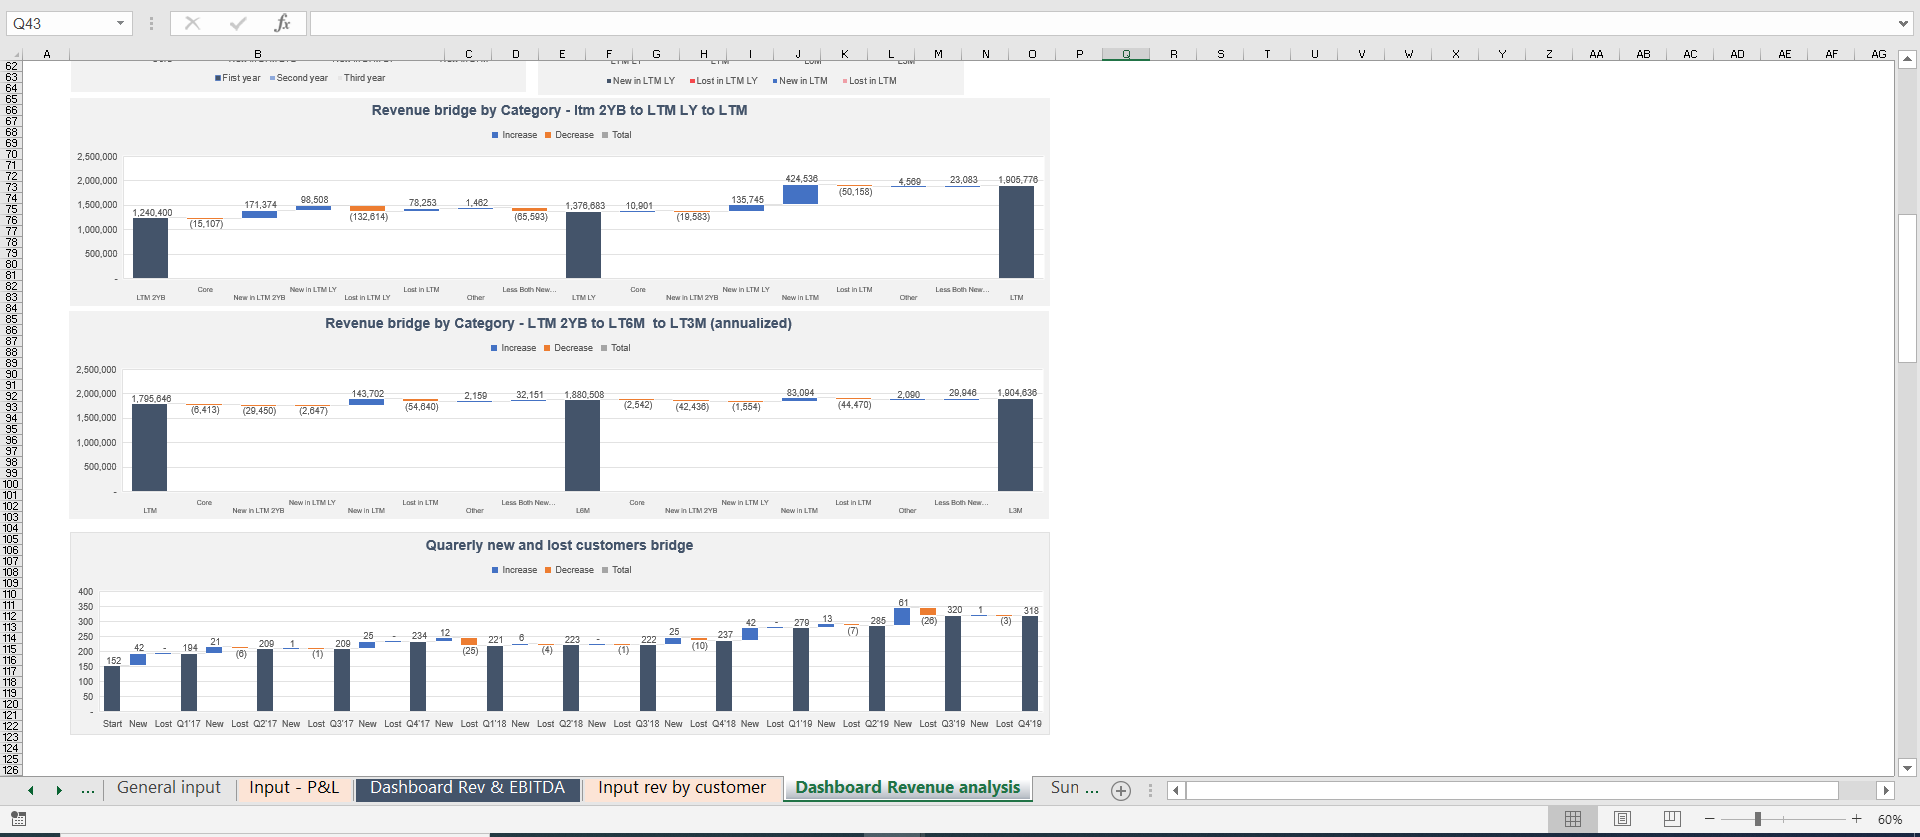
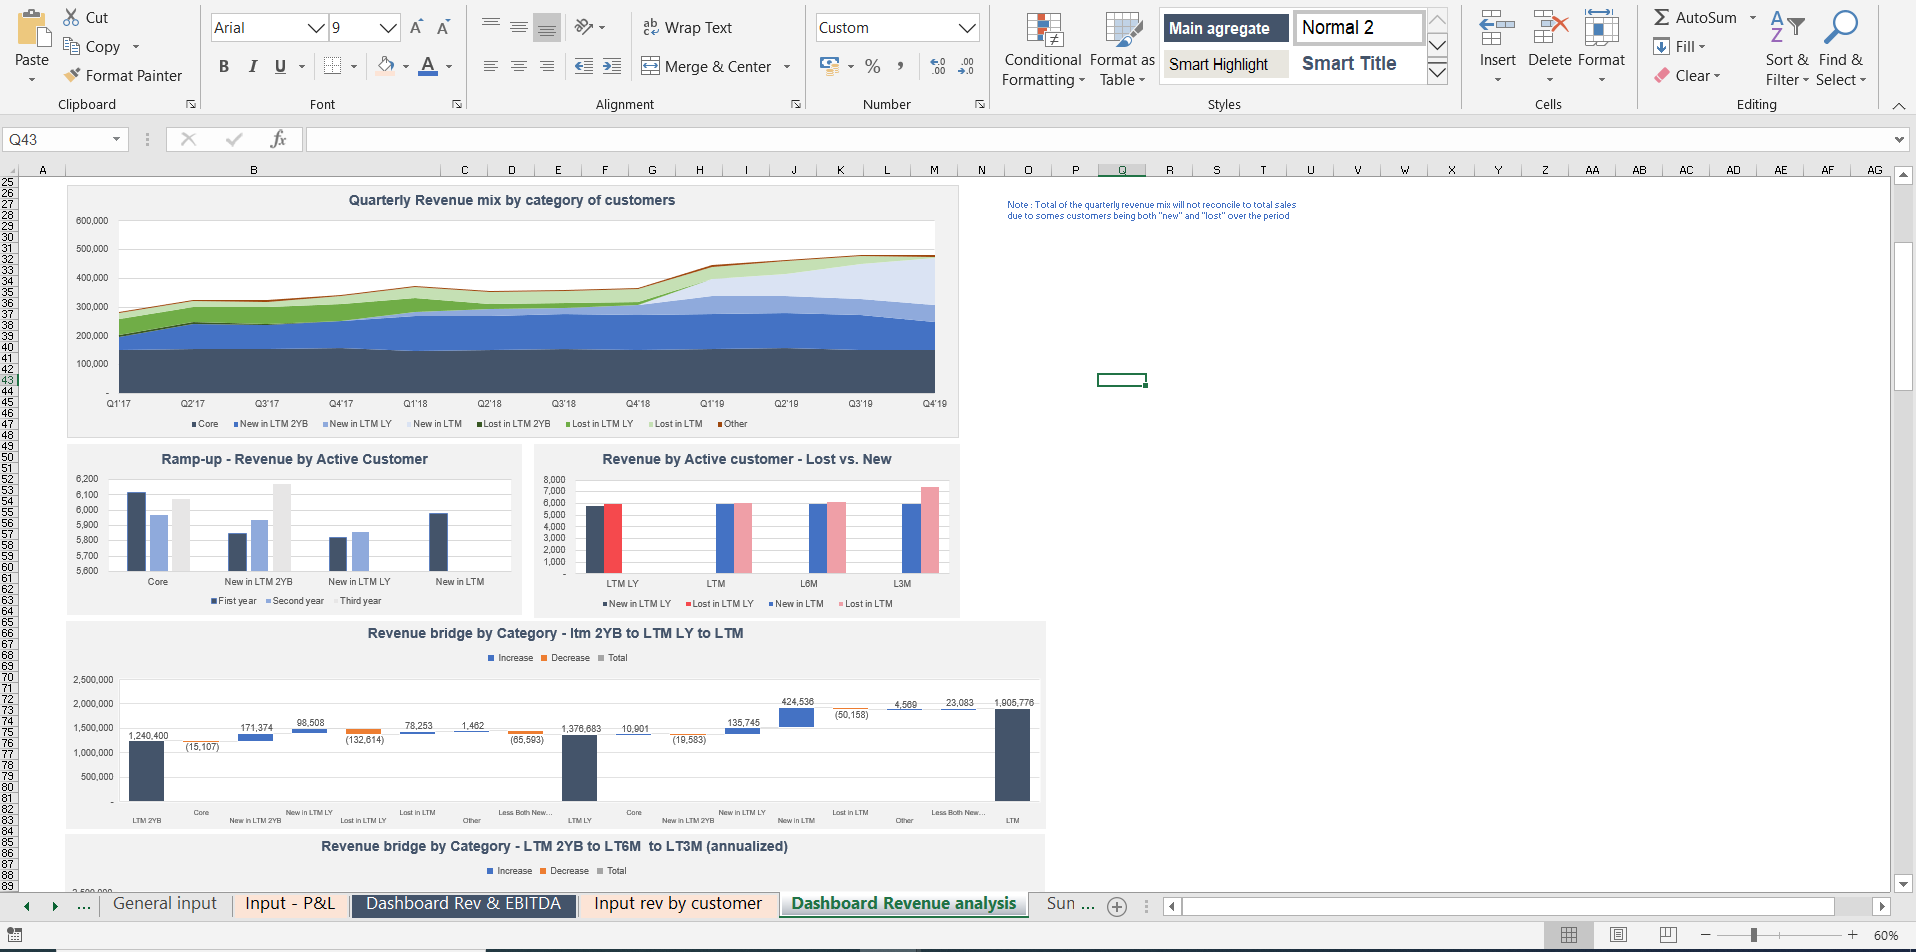
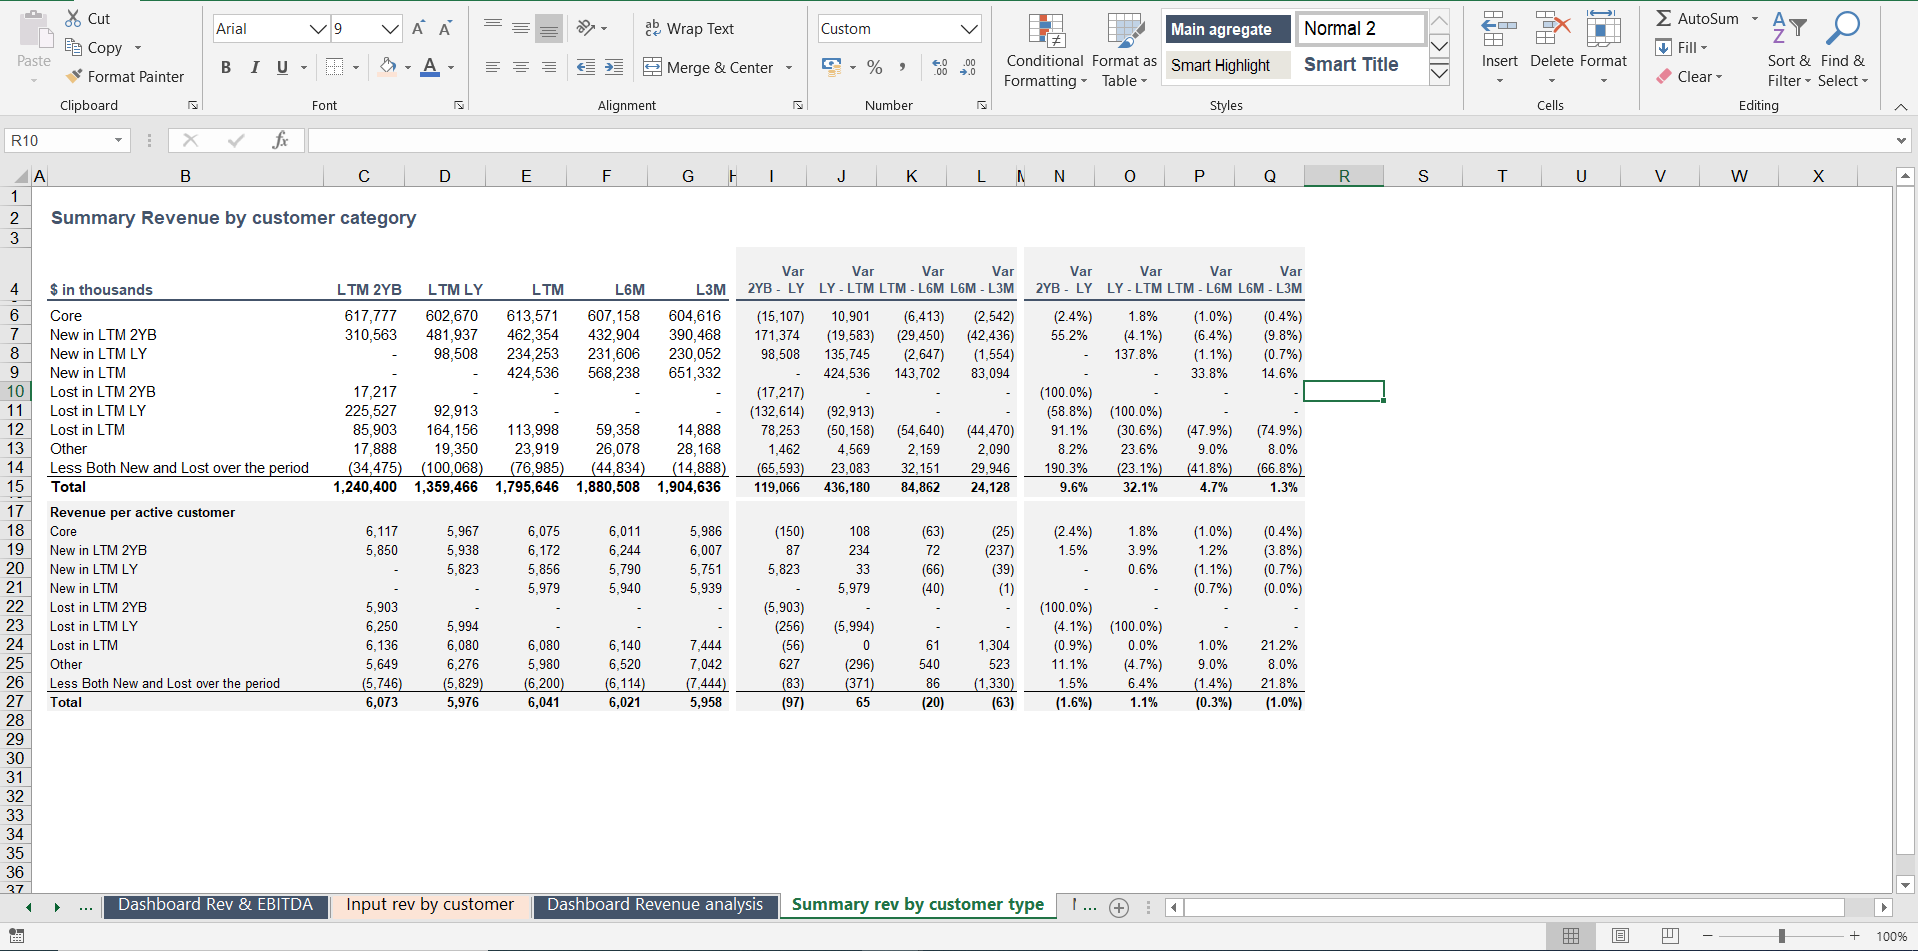
SaaS P&L, revenue and churn analysis dashboard
Dashboard for SaaS and subscription businesses to track and understand their P&L and revenue generation
Consultant - M&A, Modelling and Financial expert - M&A director at HoriZen CapitalFollow 68
Further information
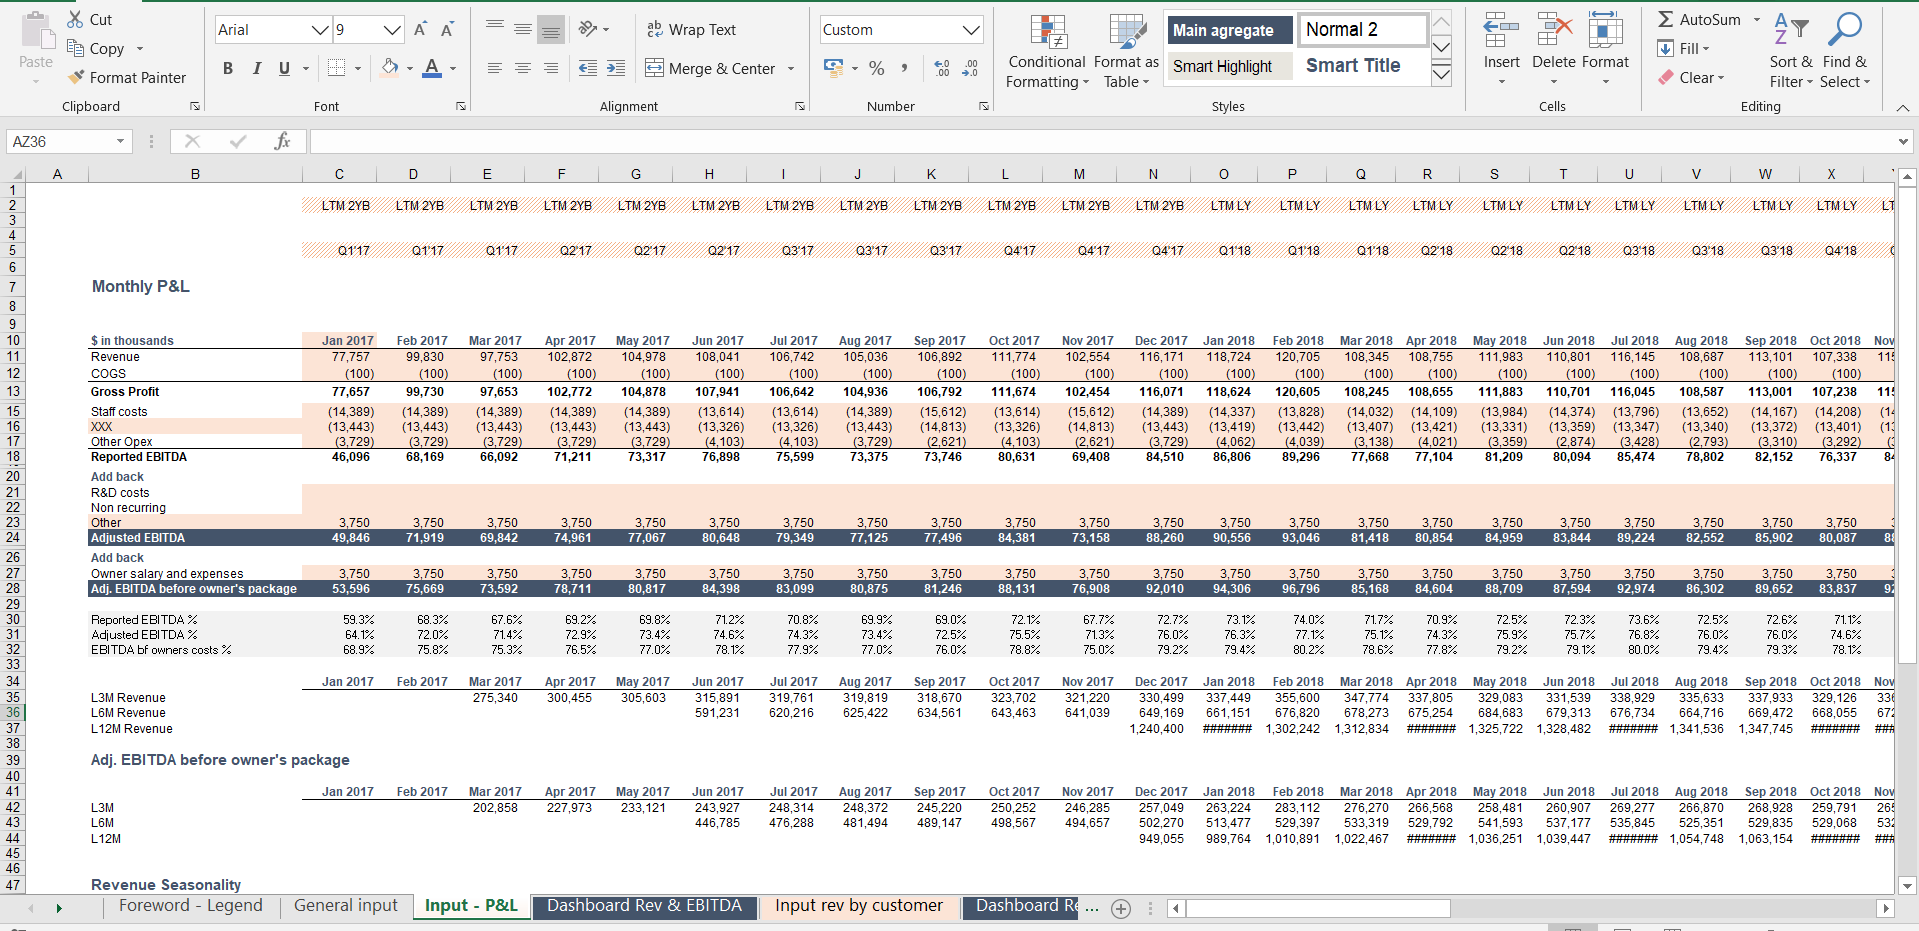
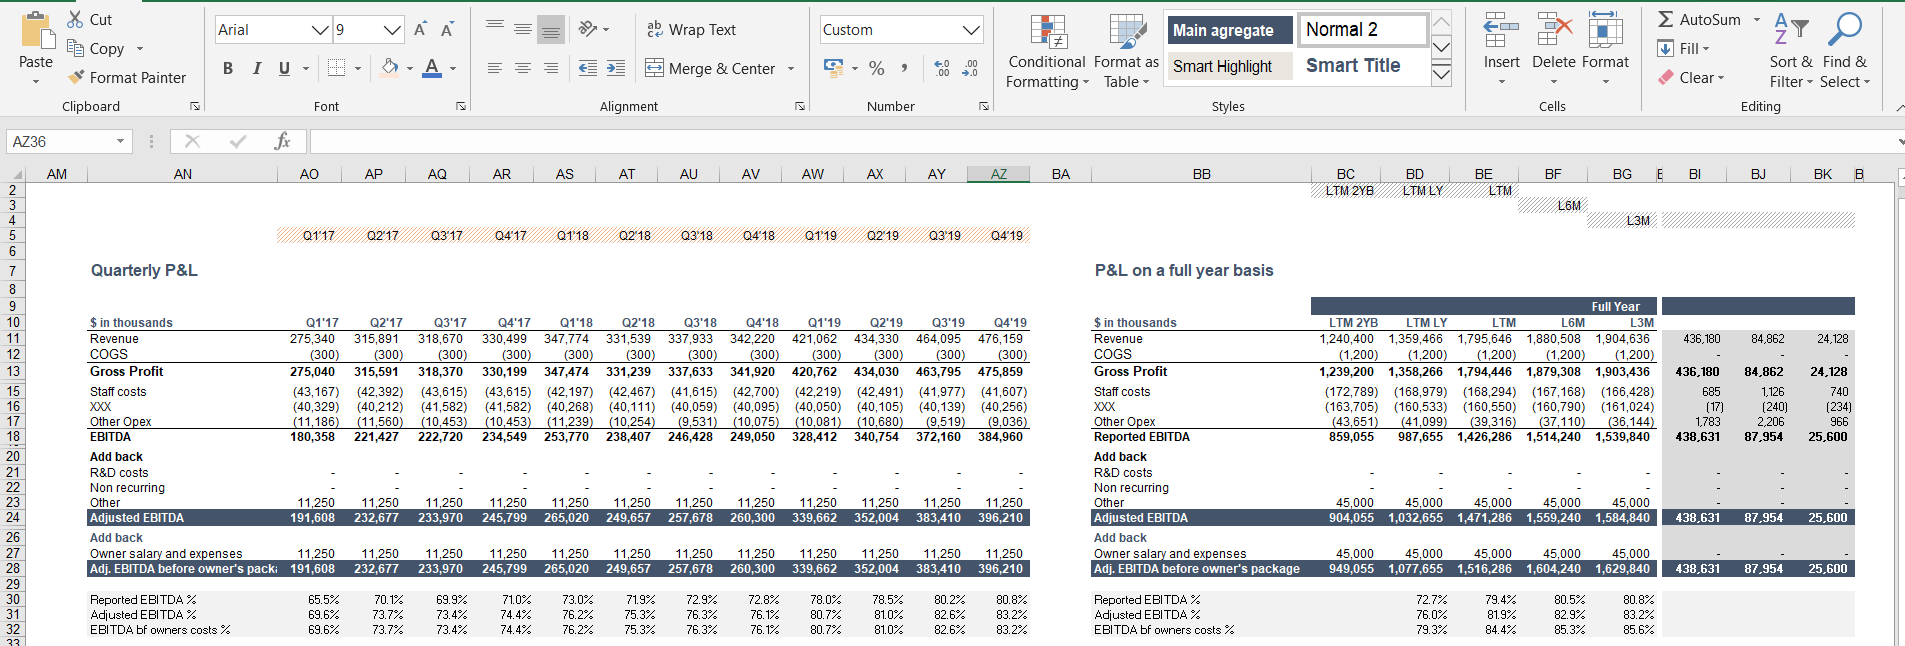
Help the investor do a deep down analysis on revenue trends of a SaaS business. Help SaaS owner better track and understand their P&L, profitability and revenue.
Business with monthly revenue and recurring customers
