Originally published: 05/02/2024 07:43
Publication number: ELQ-51801-1
View all versions & Certificate
Publication number: ELQ-51801-1
View all versions & Certificate

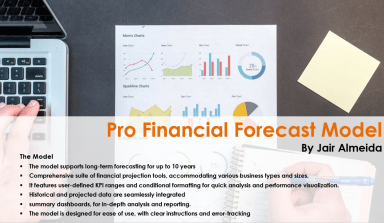
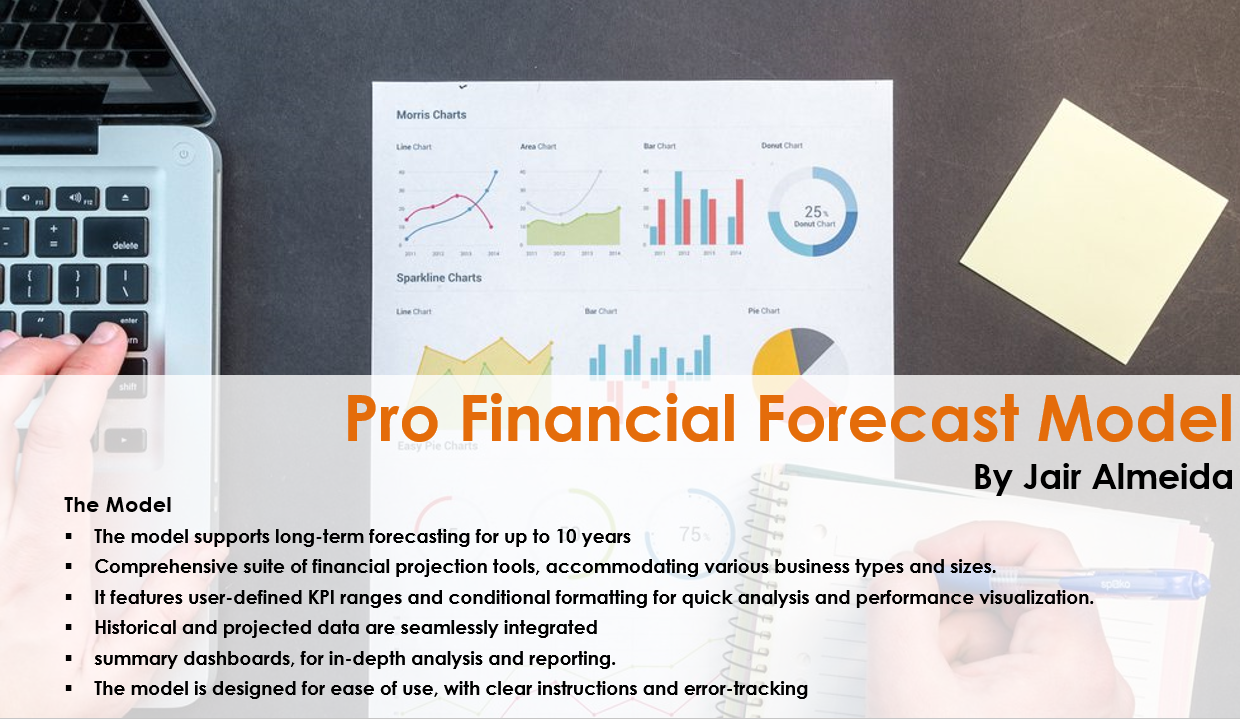
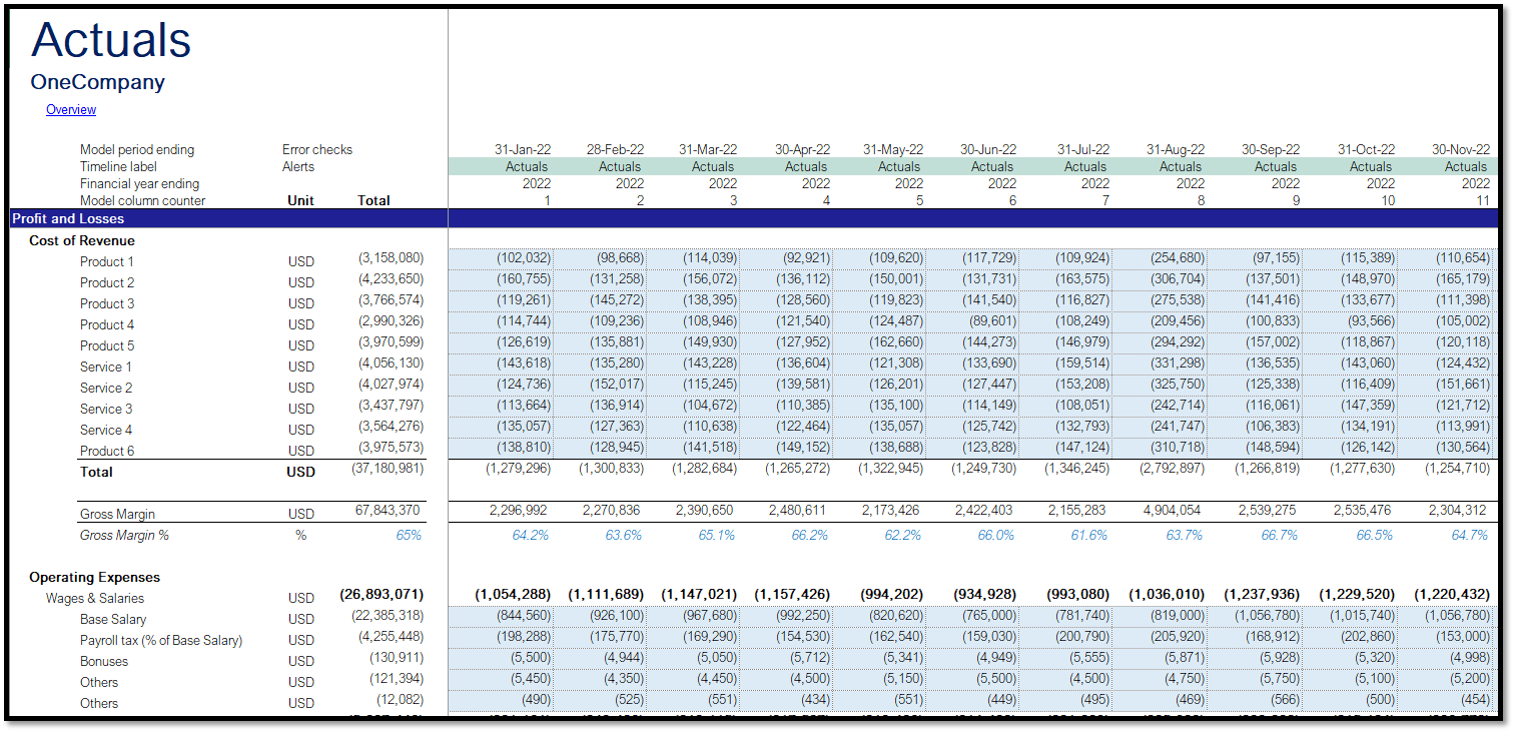
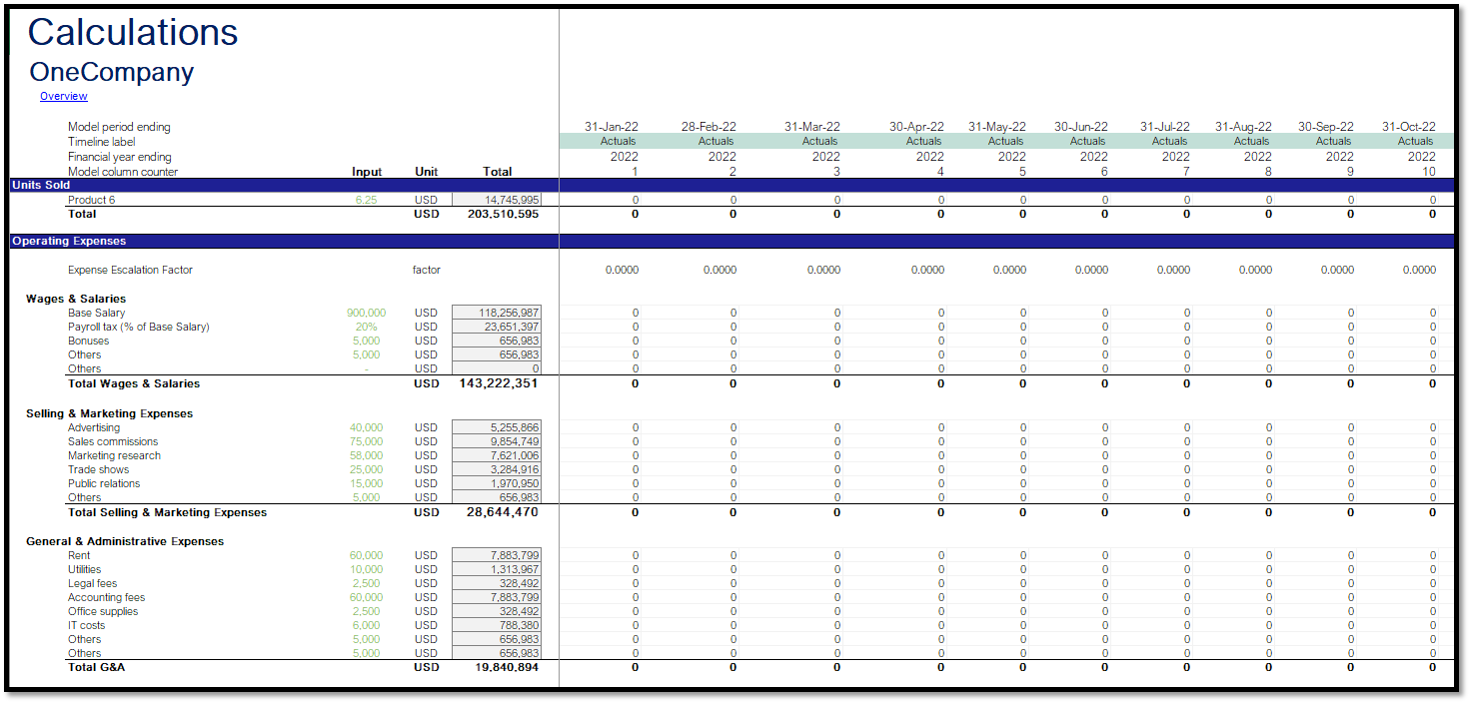
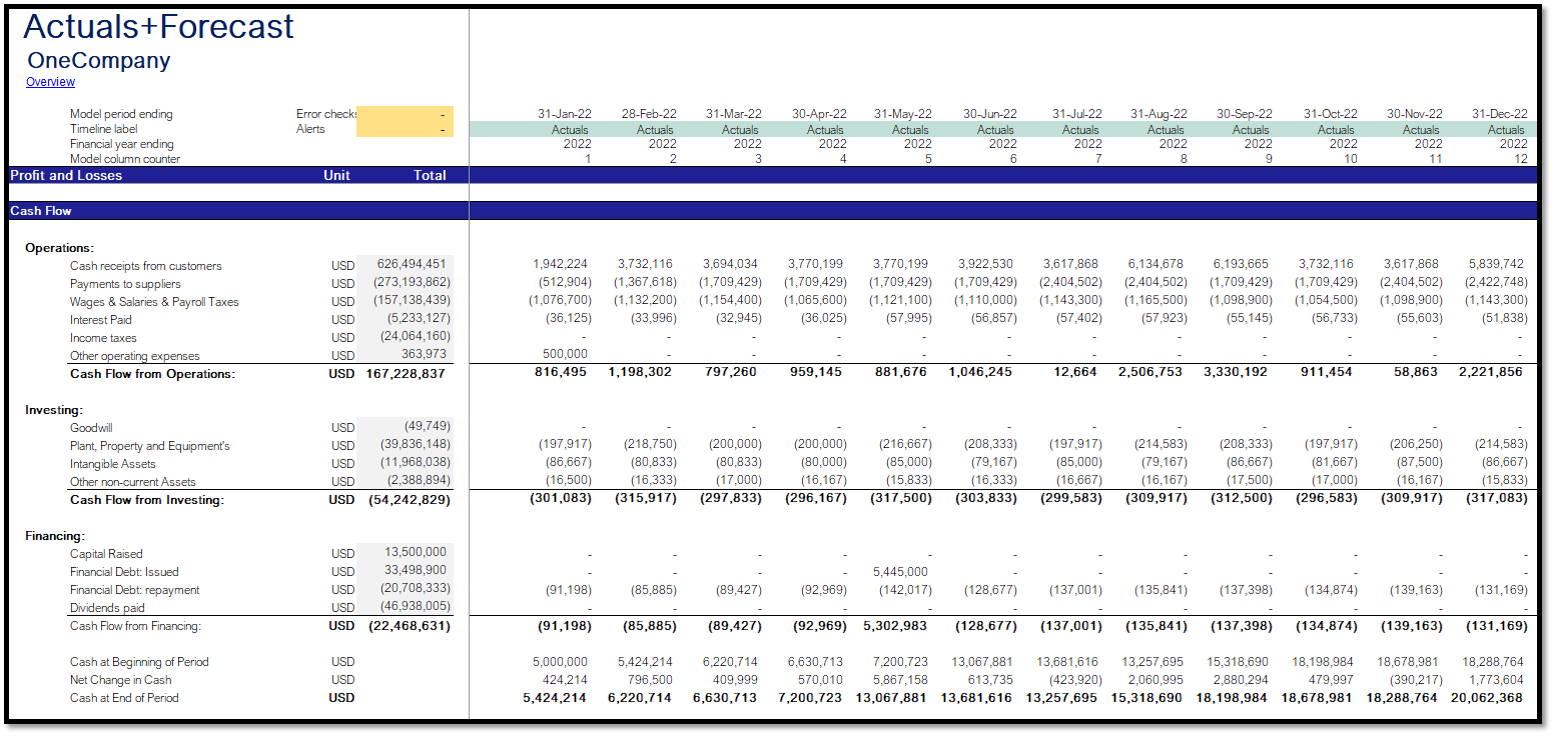
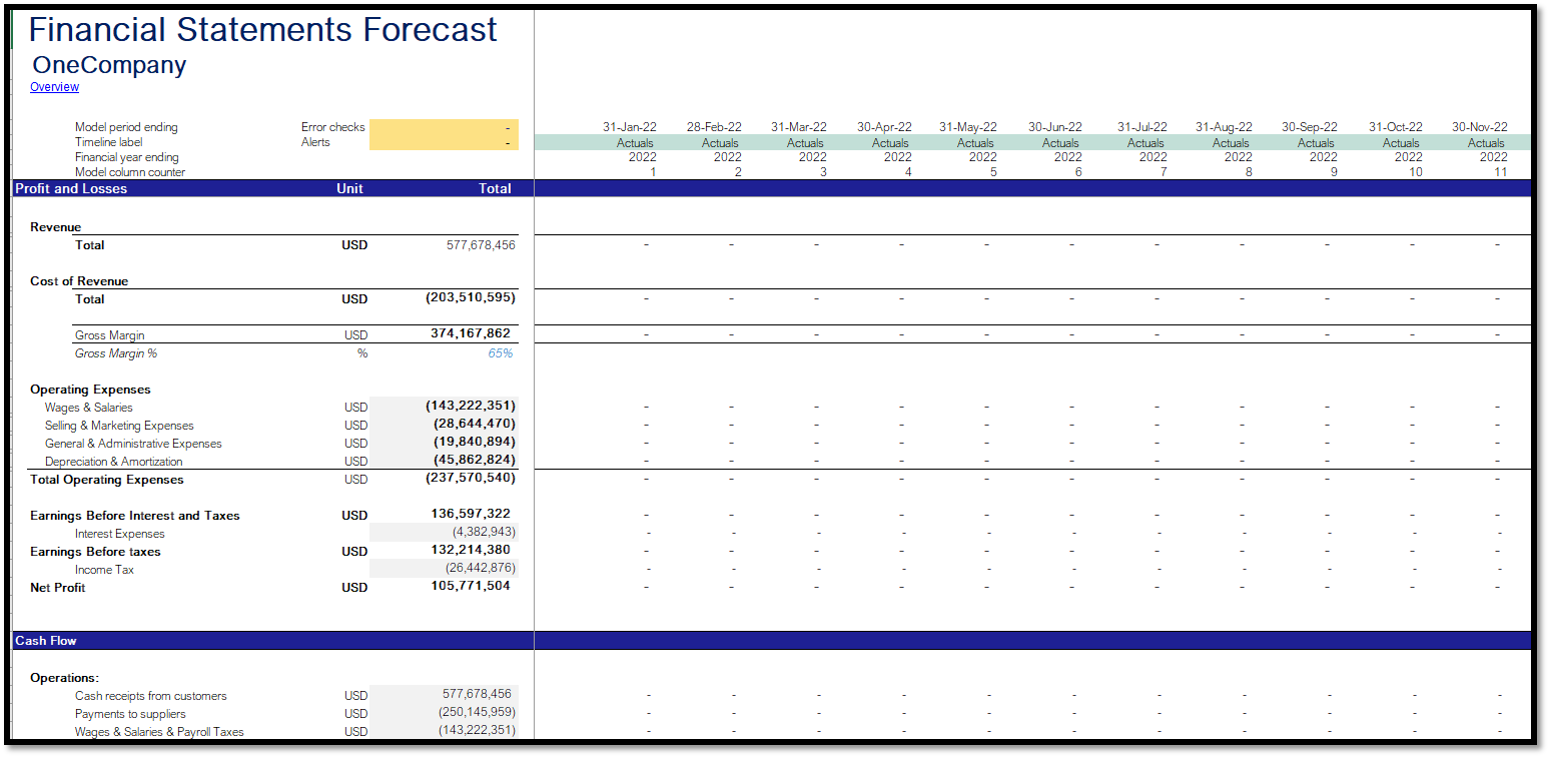
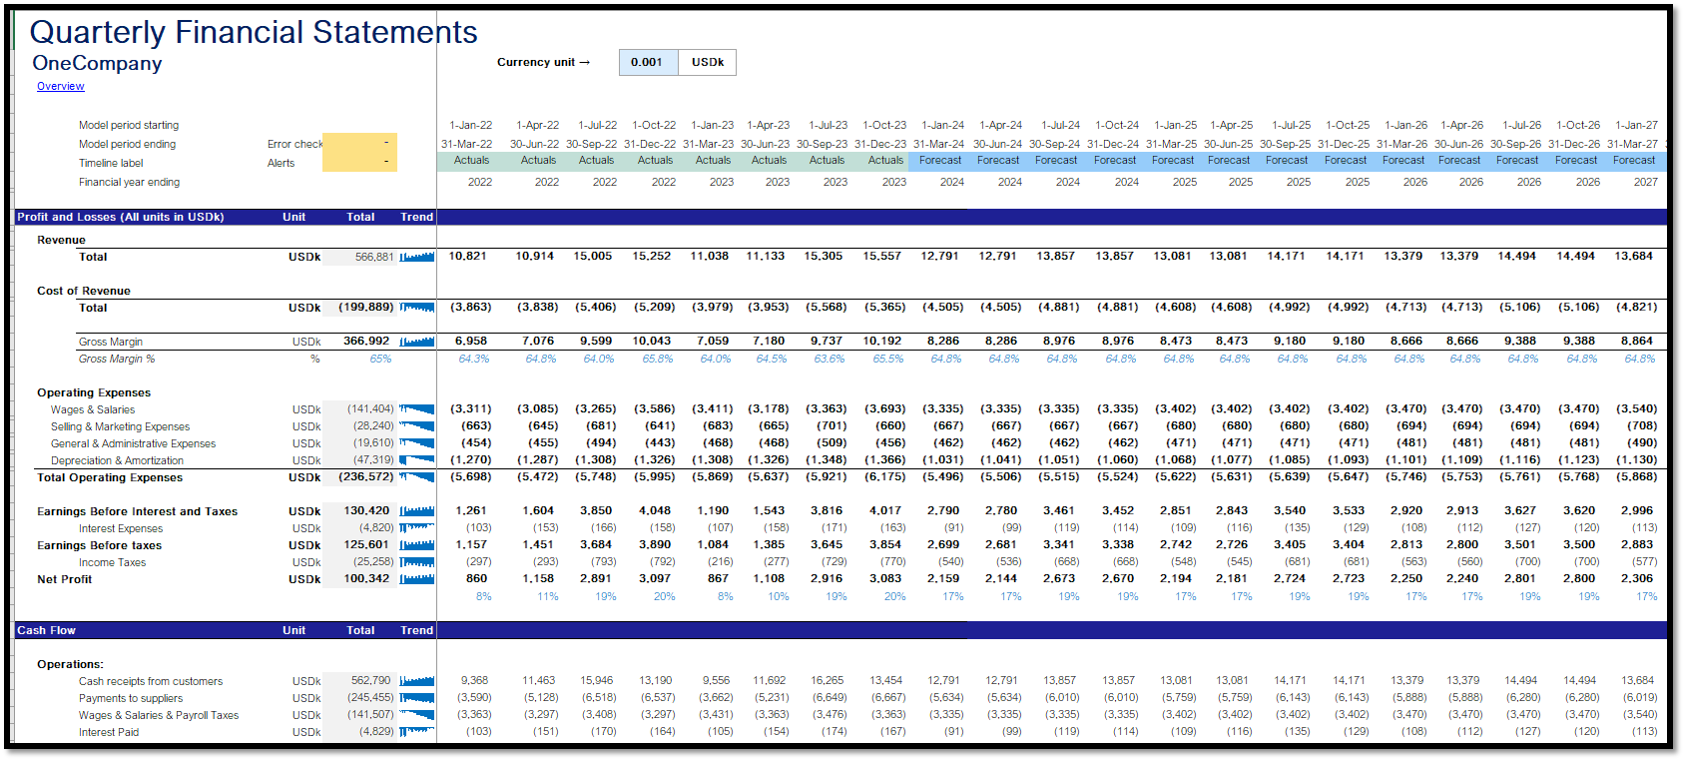
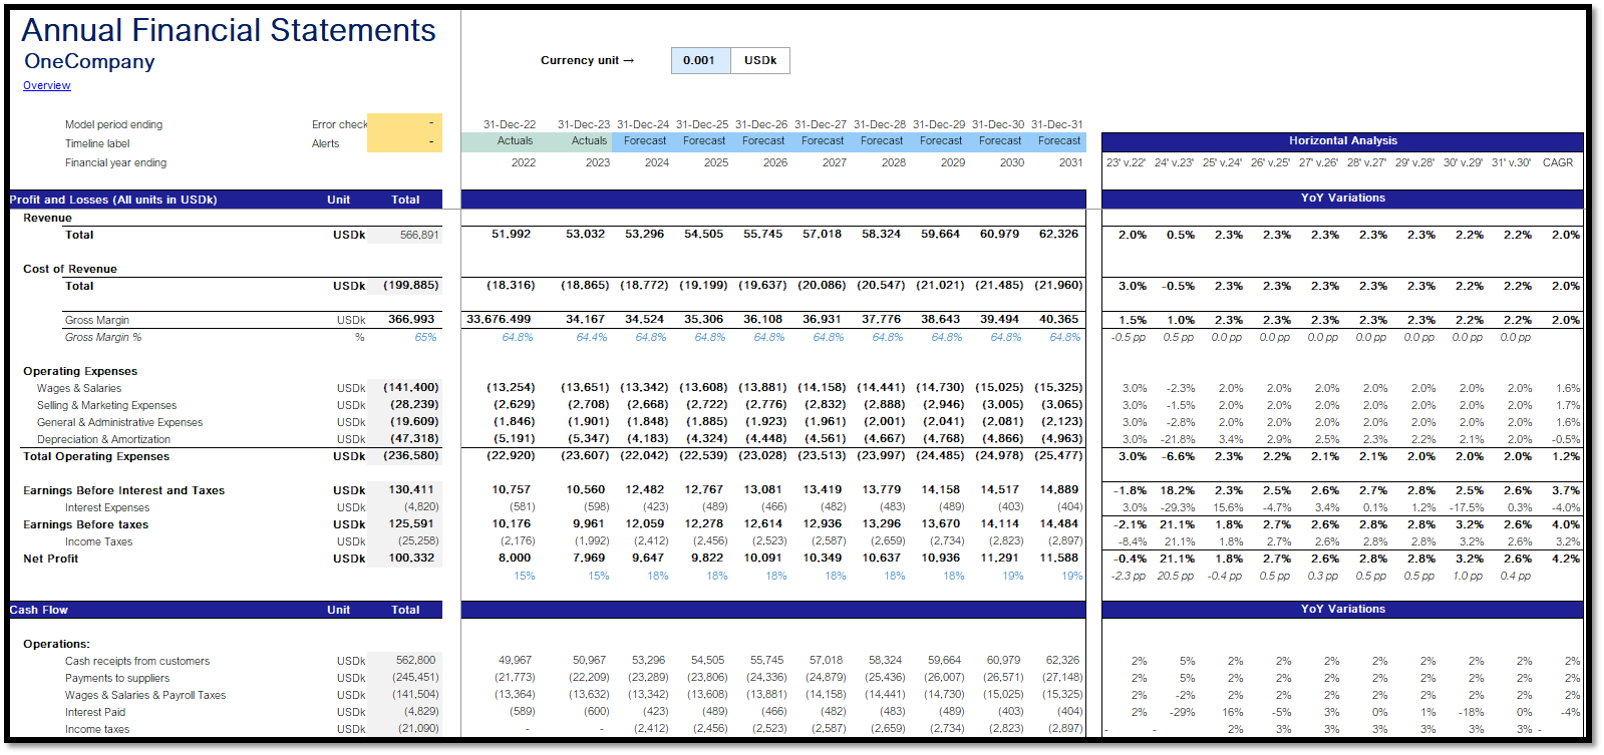
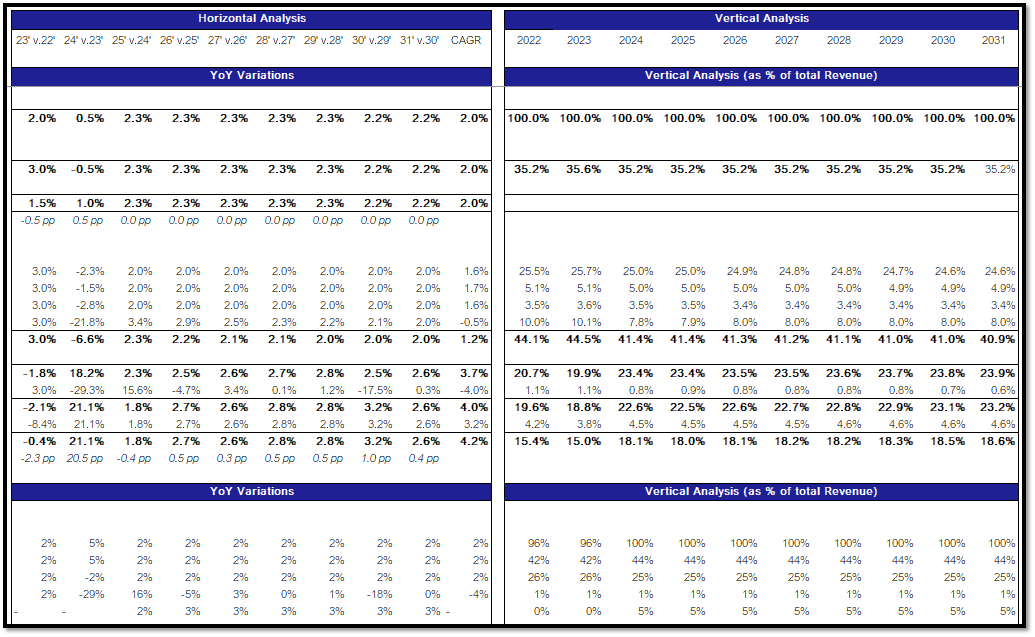
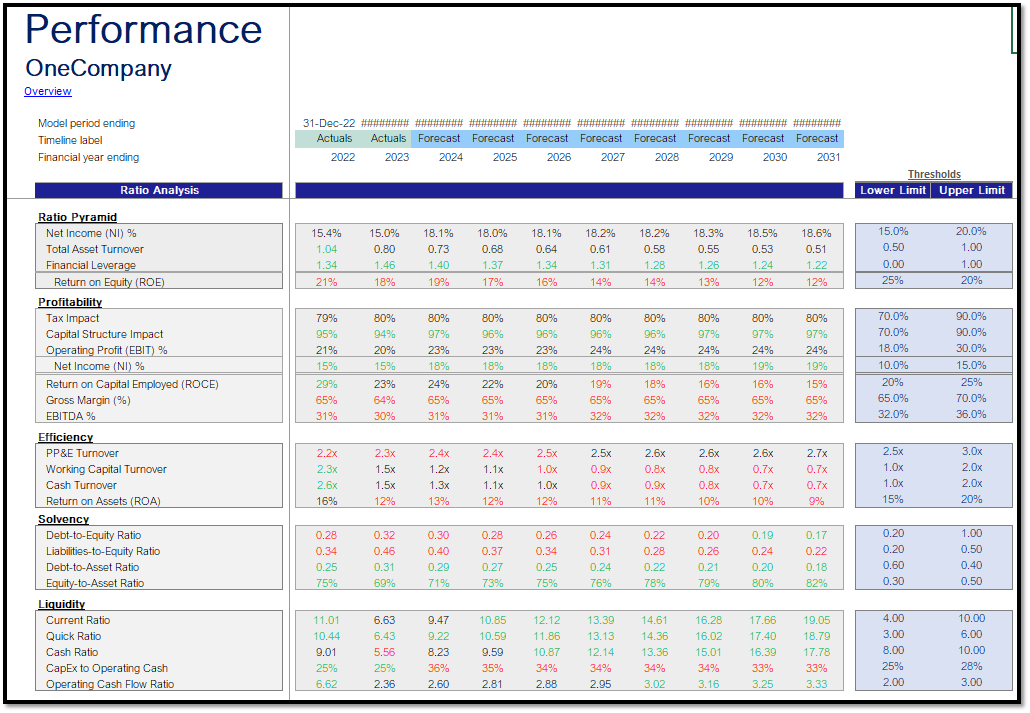
Pro Financial Forecast - Dynamic and Advanced Financial Projections
Precise, customizable forecasting with Pro Financial Forecast, the advanced yet user-friendly financial modeling template
Further information
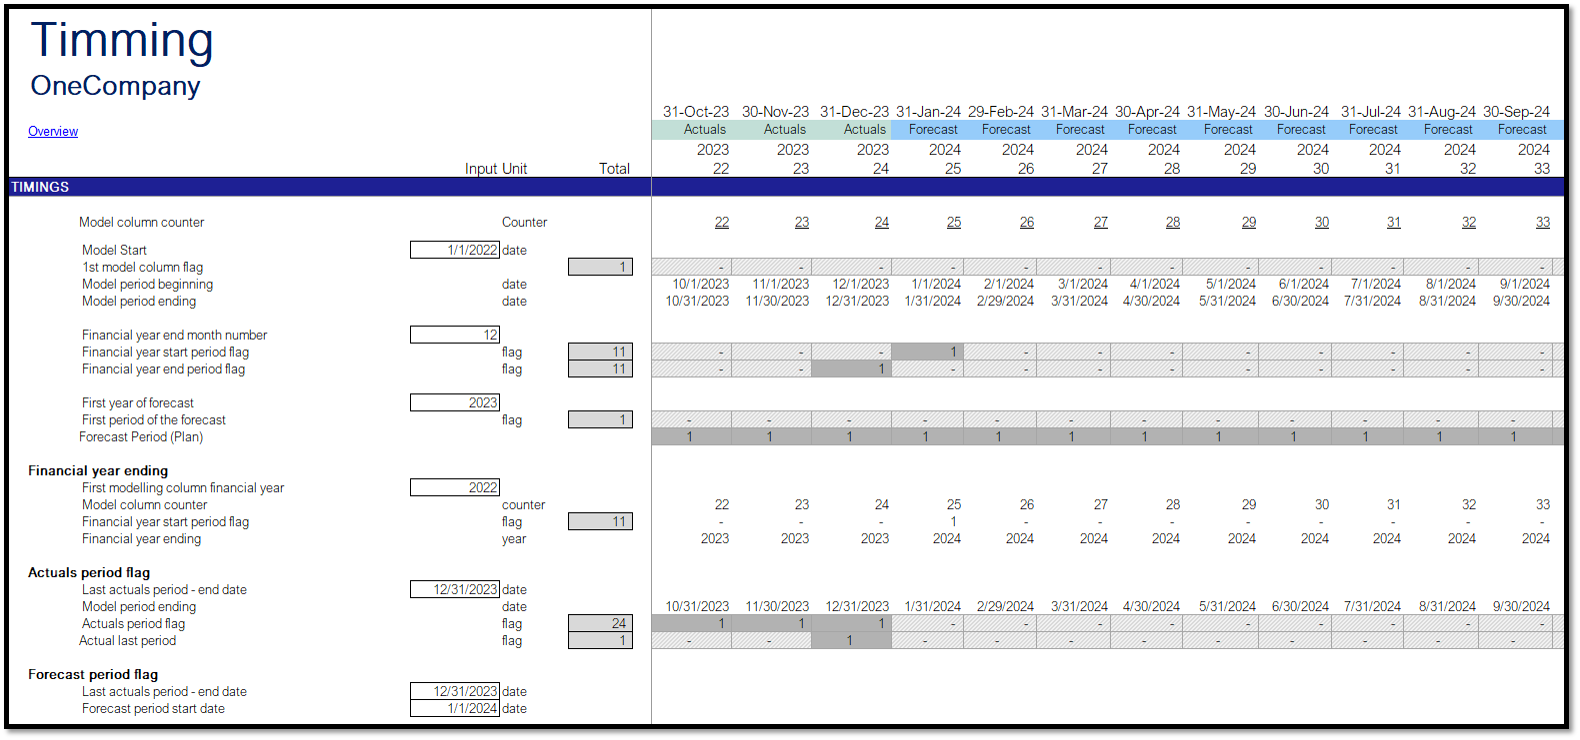
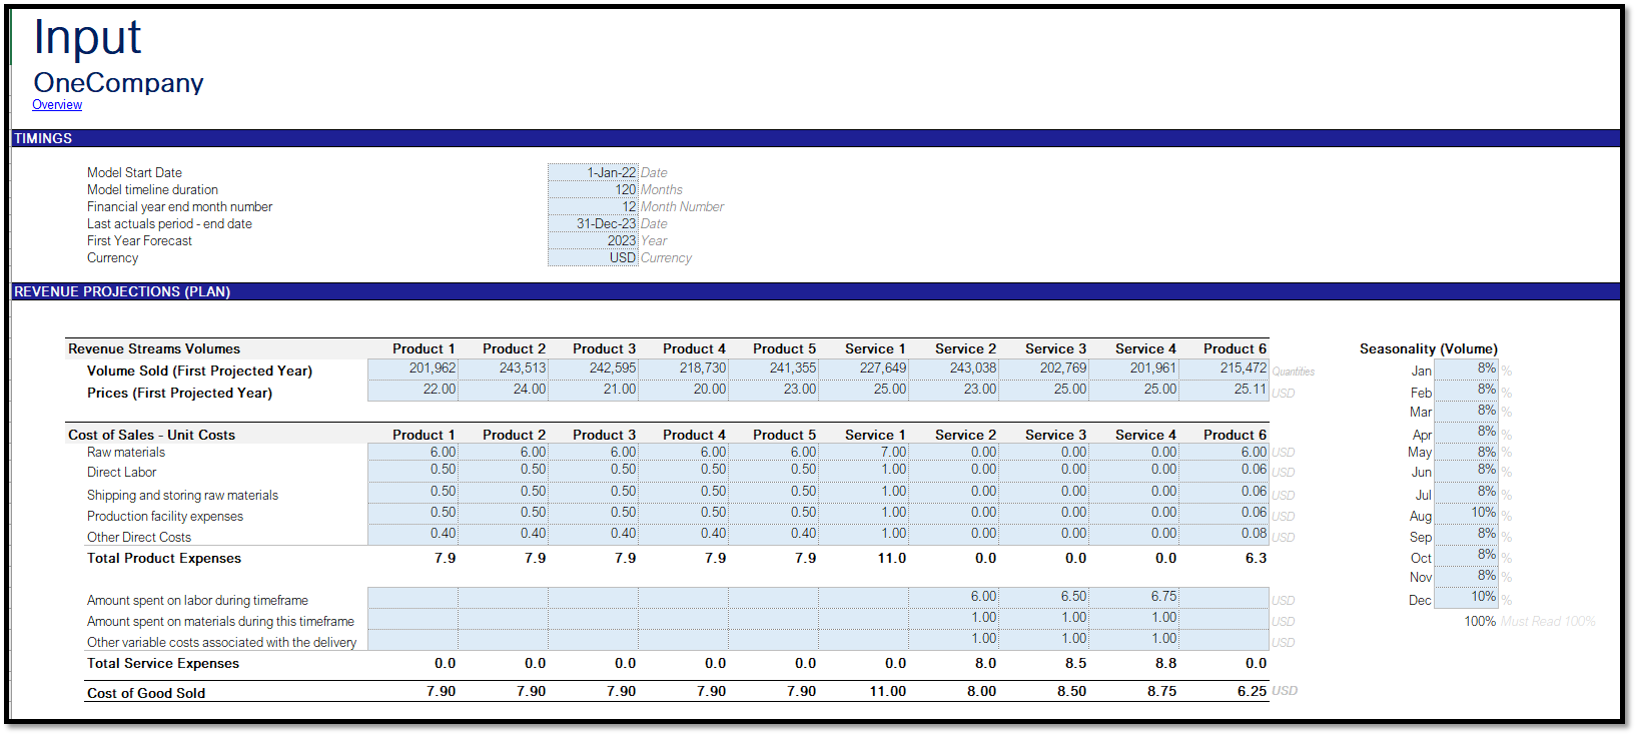
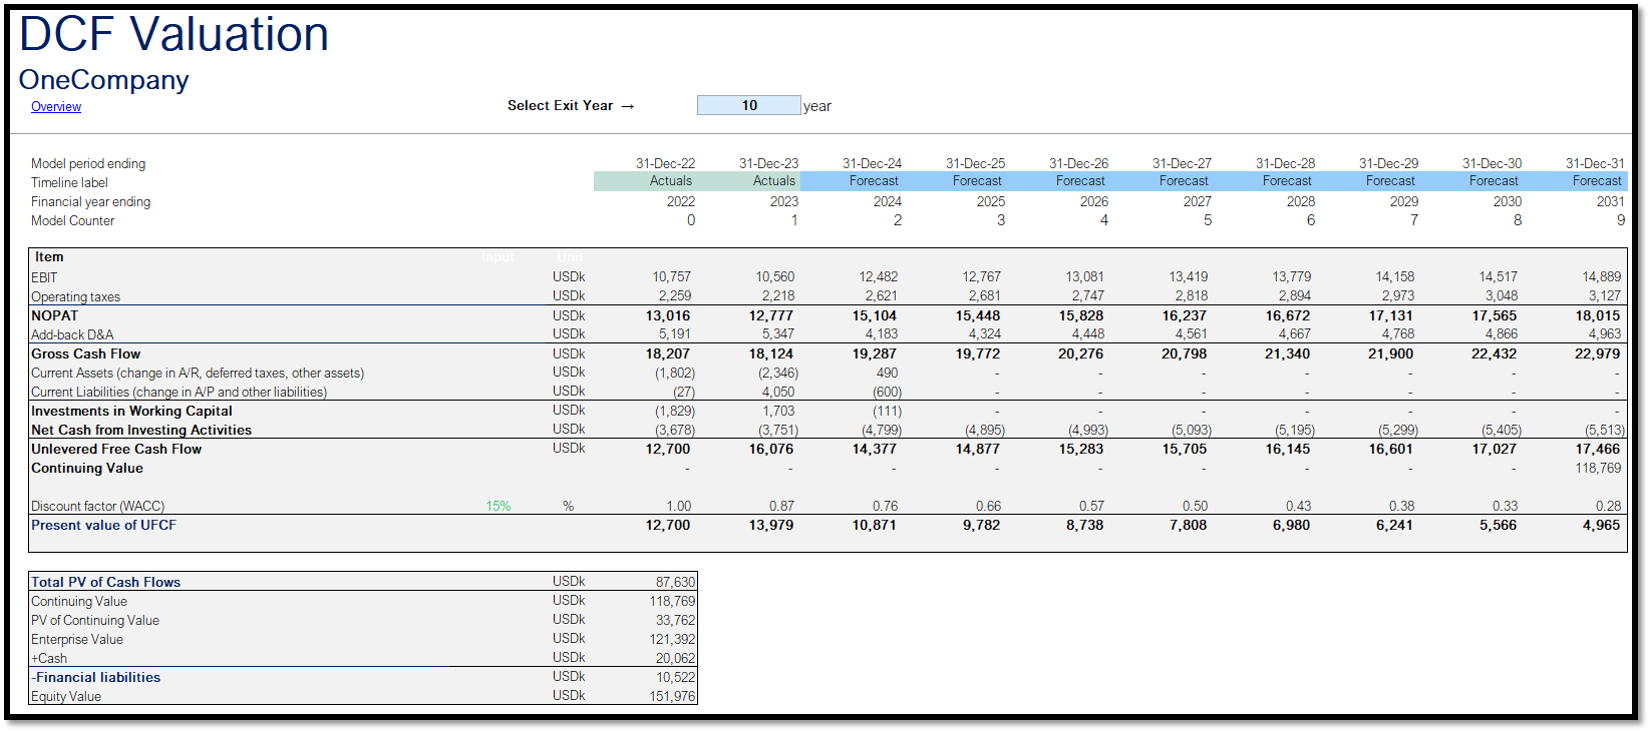
Provide businesses of any size or industry with a dynamic, customizable, and advanced financial modeling tool for comprehensive forecasting, analysis, and strategic planning over a 10-year horizon.
