
Originally published: 28/06/2022 10:06
Last version published: 11/09/2024 22:23
Publication number: ELQ-15889-3
View all versions & Certificate
Last version published: 11/09/2024 22:23
Publication number: ELQ-15889-3
View all versions & Certificate

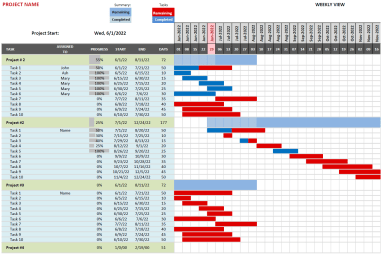
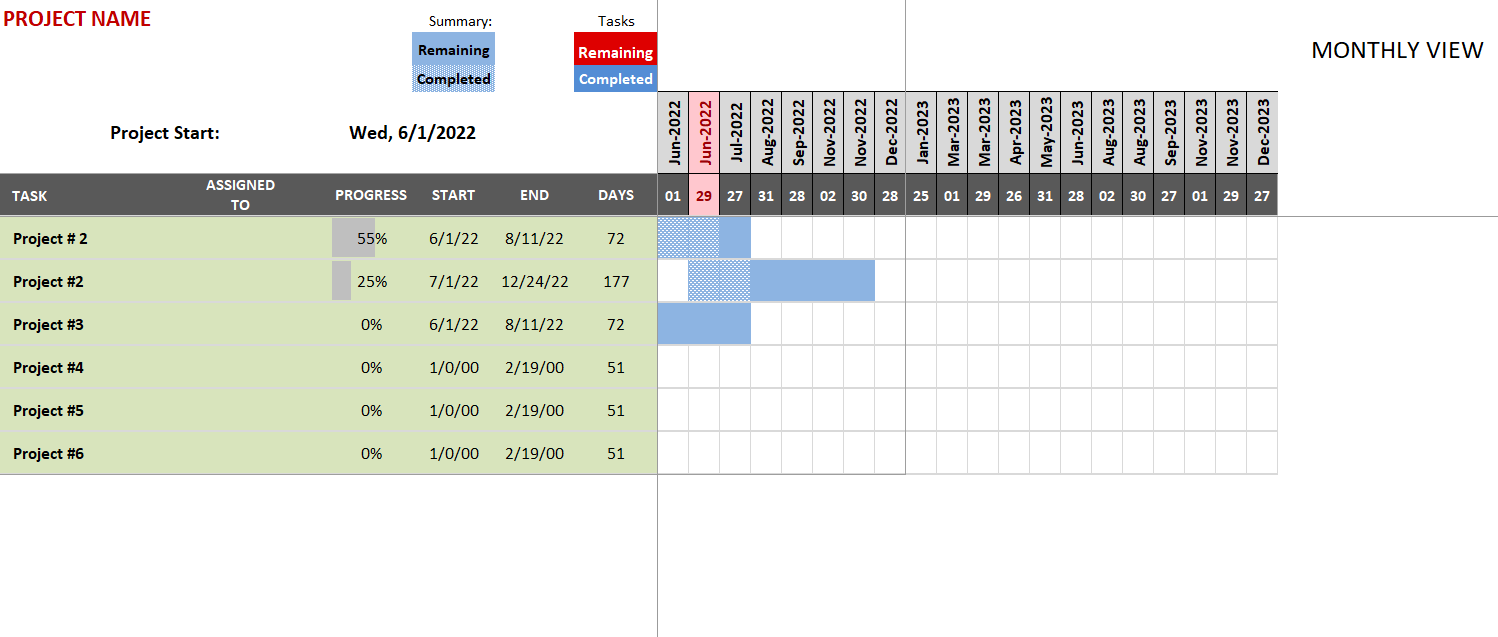
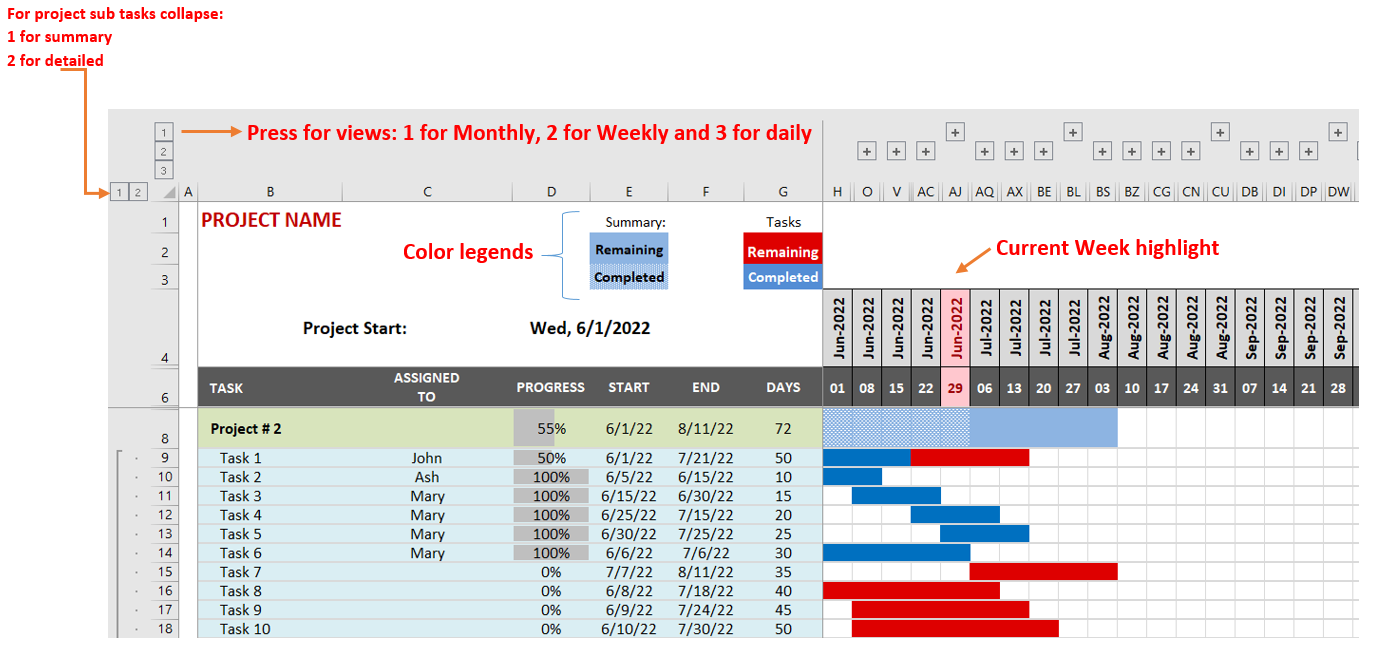
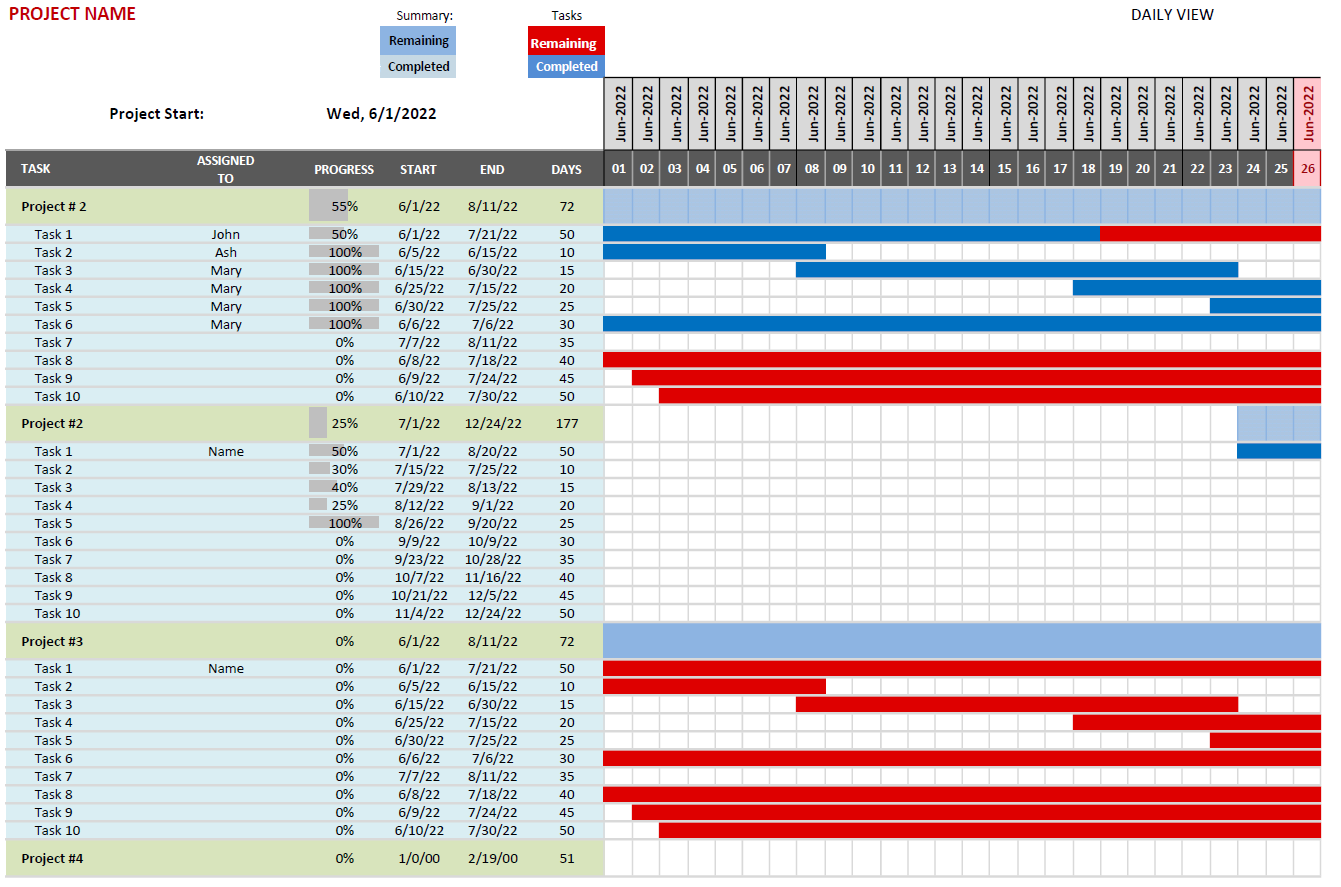
Interactive Excel Gantt Chart with Days, Weeks and Monthly scale views
Interactive Gantt chart will help us to plot out the project and its subtasks with easy, formal, representation with respect to Days, Weeks, or Monthly views.
Business Planning and Project Management Professional | Top Rated Freelancer at Fiverr | CERT 5 at PeopleperhourFollow 17
Further information
To provide simple and fast project scheduling ability without multiple calculations in the head. Getting beautiful representation of project works.
