Originally published: 26/11/2018 14:00
Publication number: ELQ-70611-1
View all versions & Certificate
Publication number: ELQ-70611-1
View all versions & Certificate

How to Differentiate the Two Groups of Measurement Levels in Statistics
Understand the levels of measurement in statistics, which are split into two groups: qualitative and quantitative data.
Introduction
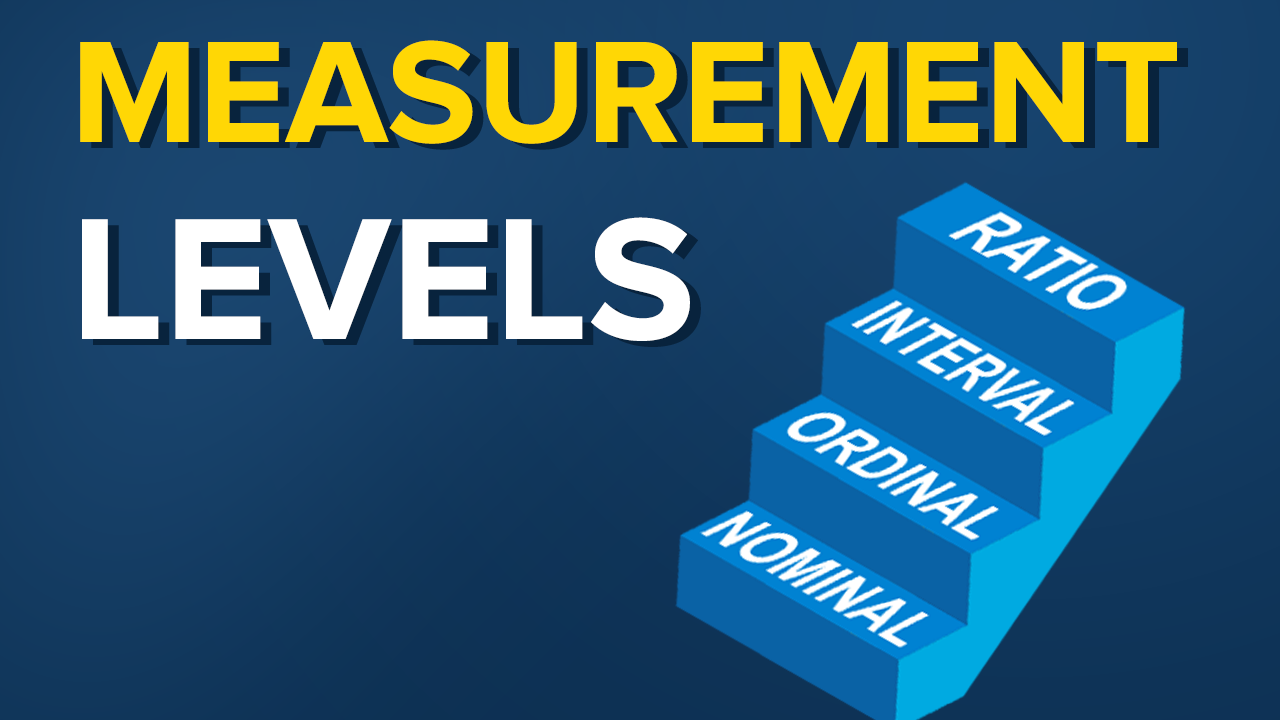
Levels of measurement in statistics can be split into two groups: qualitative and quantitative data. They are very intuitive, so don’t worry.
- Step n°1 |
Levels of measurement in statistics
Levels of measurement in statistics can be split into two groups: qualitative and quantitative data. They are very intuitive, so don’t worry.
Qualitative data can be nominal or ordinal.
Nominal variables are like the categories we talked about just now – Mercedes, BMW or Audi, or like the four seasons – winter, spring, summer and autumn. They aren’t numbers and cannot be put in any order.
Ordinal data, on the other hand, consists of groups and categories but follows a strict order. Imagine you have been asked to rate your lunch and the options are: disgusting, unappetizing, neutral, tasty, and delicious. Although we have words and not numbers, it is obvious that these preferences are ordered from negative to positive, thus the data is qualitative, ordinal.
Okay, so what about quantitative variables? Well, as you may have guessed by now, they are also split into two groups: interval and ratio.
Intervals and ratios are both represented by numbers but have one major difference.
