

Originally published: 13/07/2021 11:54
Publication number: ELQ-21420-1
View all versions & Certificate
Publication number: ELQ-21420-1
View all versions & Certificate

Mobile App Financial Model
The financial model presents the business case of a Mobile App Business.
financial mnodelingexcelmobile appdownloadstrafficthree statement modelsconversionsactive userschurn rateexcel model
Description
The financial model presents the business case of a Mobile App Business. A mobile application, also referred to as a mobile app or simply an app, is a computer program or software application designed to run on a mobile device such as a phone, tablet, or watch.
This financial model template will enable you to:
- Plan the sources of monetization from downloads & in app orders, their conversion rates, as well as their churn rates
- Forecast the revenues (from downloads, and orders from organic, paid downloads and active users )
- Analyze the direct costs for running the app such as cost margin, credit card costs, servers and customer service costs as well as marketing costs.
- Setting up payroll costs, and operating expenses.
- Set the initial investment amount and the equipment / servers needed
- Set the relevant currency and timing
- Create the three financial statements (Profit and Loss, Balance Sheet and Cash Flow) monthly for 60 months.
- Financial Ratios to check the viability of your business
- Printable model as PDF for your investors
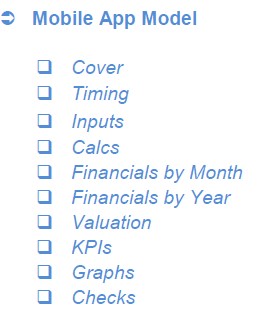
So, a quick overview of the model, in the contents tab you can see the structure of the model and by clicking on any of the headlines to be redirected to the relevant worksheet.
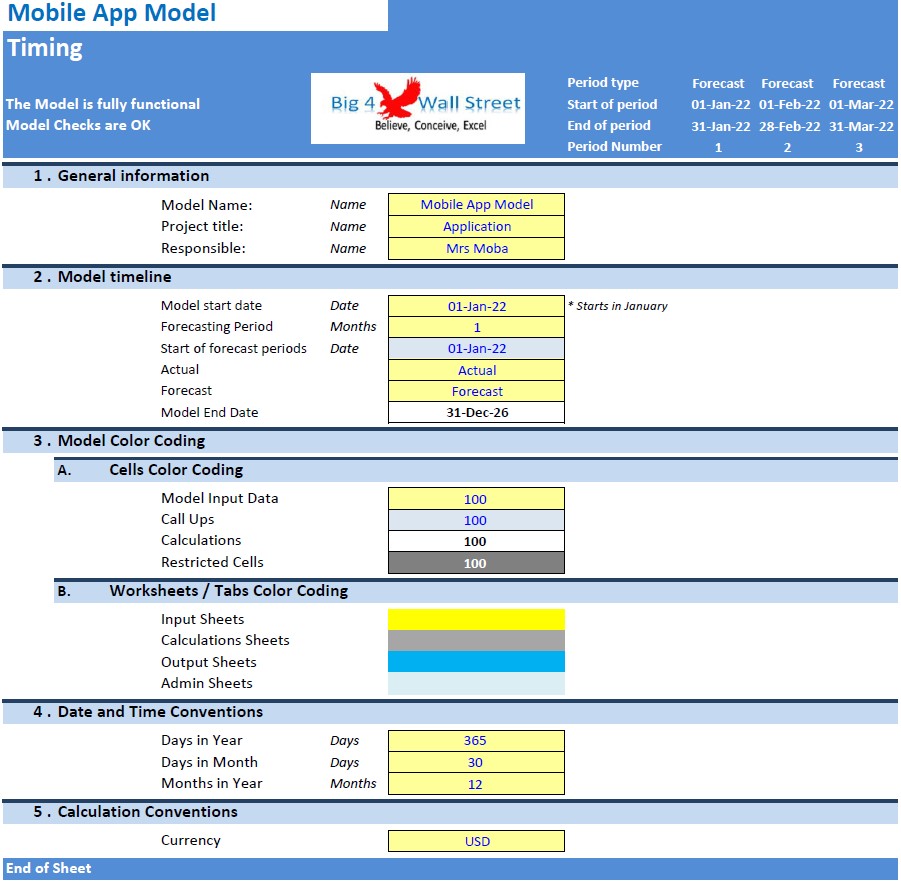
On the timing tab you can feed the general information for the model such as: model name, responsible, timeline of the model and date and currency conventions.
Additionally, there is a description of the color coding of the model in the same tab. Inputs are always depicted with a yellow fill and blue letters, call ups (that is direct links from other cells) are filled in light blue with blue letters while calculations are depicted with white fill and black characters.
There is also a color coding for the various tabs of the model. Yellow tabs are mostly assumptions tabs, grey tabs are calculations tabs, blue tabs are outputs tabs (that is effectively results or graphs) and finally light blue tabs are admin tabs (for example: the cover page, contents and checks).
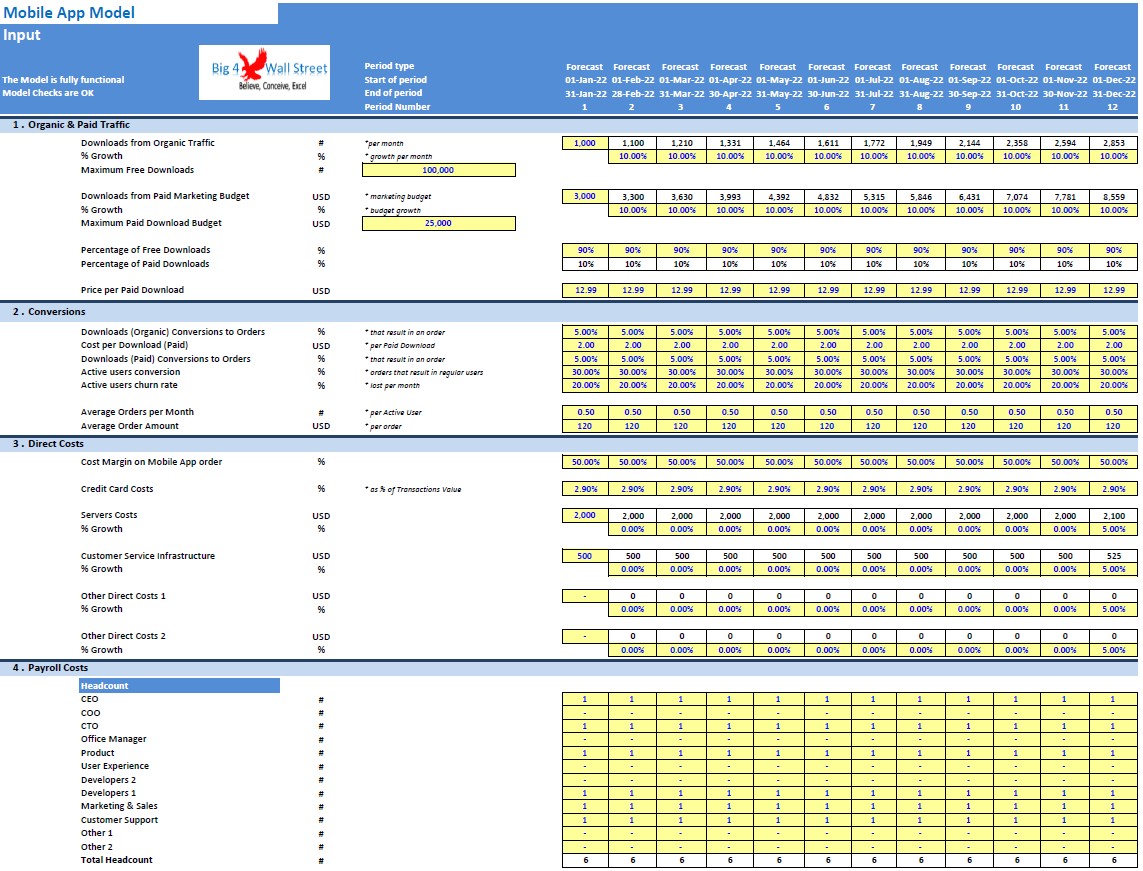
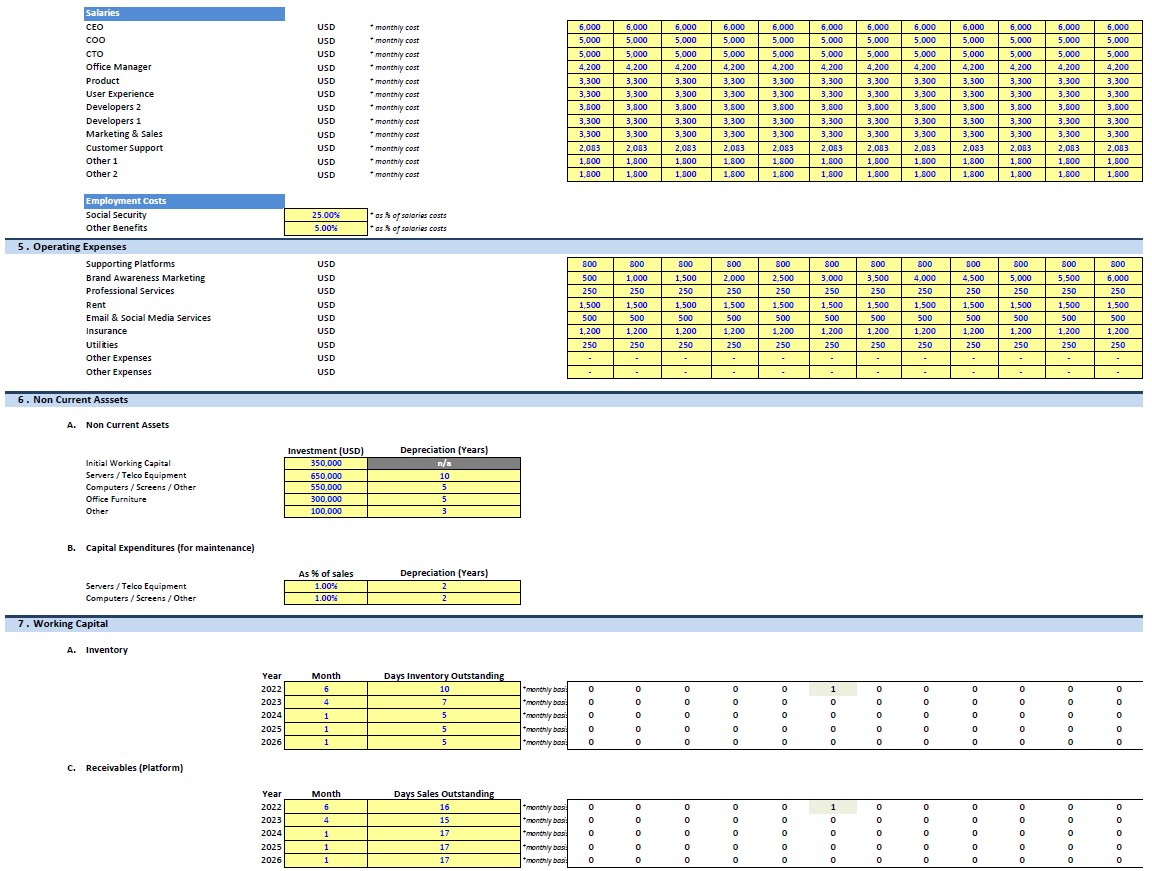
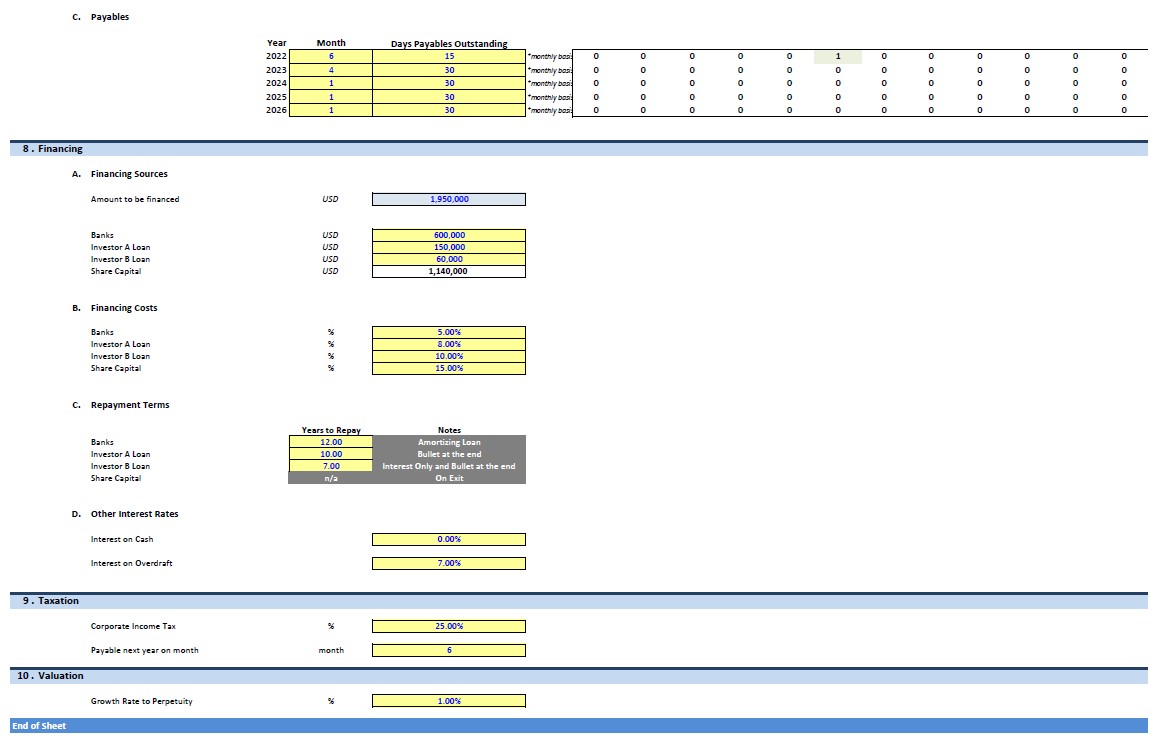
Moving on to the inputs tab, you can adjust the various assumptions of the model based on the specifications and requirements of your business. So effectively you can adjust the detailed revenue assumptions and the user can amend the most important drivers such as: downloads from organic traffic, downloads from paid marketing budget, price per paid download, conversion rates, average orders and average order amount . Moving on, the cost is comprised of three main categories: direct costs (cost margin of mobile app, payment processing, servers, customer support, marketing ), labor cost (headcount, salaries, employment costs and other benefits), and operating costs (rent, utilities, insurance, advertising, other supporting tools, etc.). Going forward you can adjust noncurrent assets, capex as well as their depreciation schedule, the working capital assumptions (inventory, receivables, and payables) can also be adjusted accordingly and finally the financing assumptions of the business whether these are debt or equity financed can also be amended.
On the calculation tab, all calculations are performed instantly without the need of an excel macro. The calculations follow the same logical flow as the in the inputs tab. As already mentioned, no inputs from the use are needed here, as all the inputs are fed in the yellow cells on the inputs tab only.
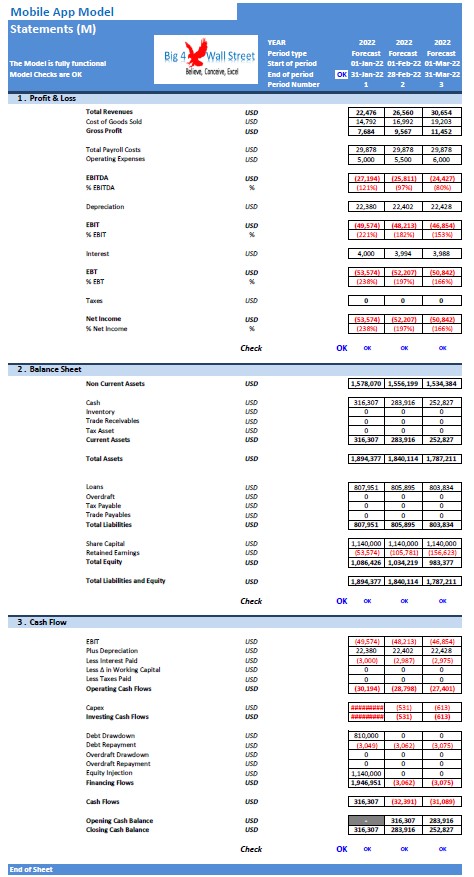
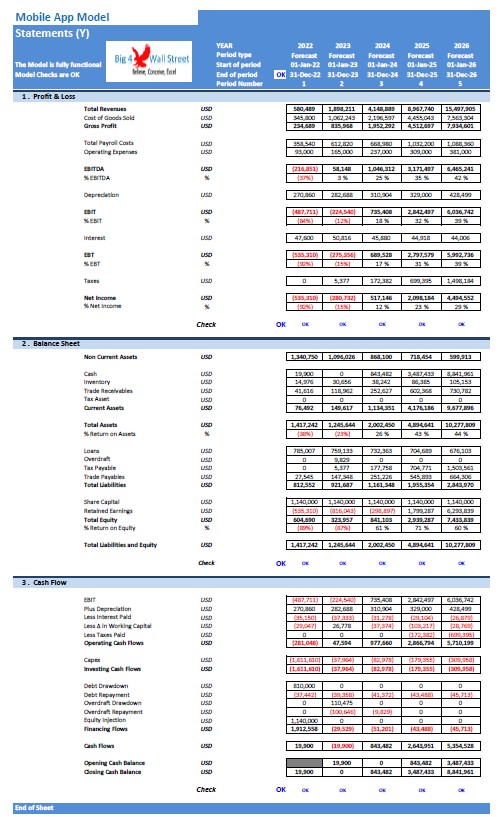
On the Financial Statements tabs you can see the resulting income statement, balance sheet as well as the cash flow of the company and or project. These financial statements are generated on a monthly as well as on a yearly basis.
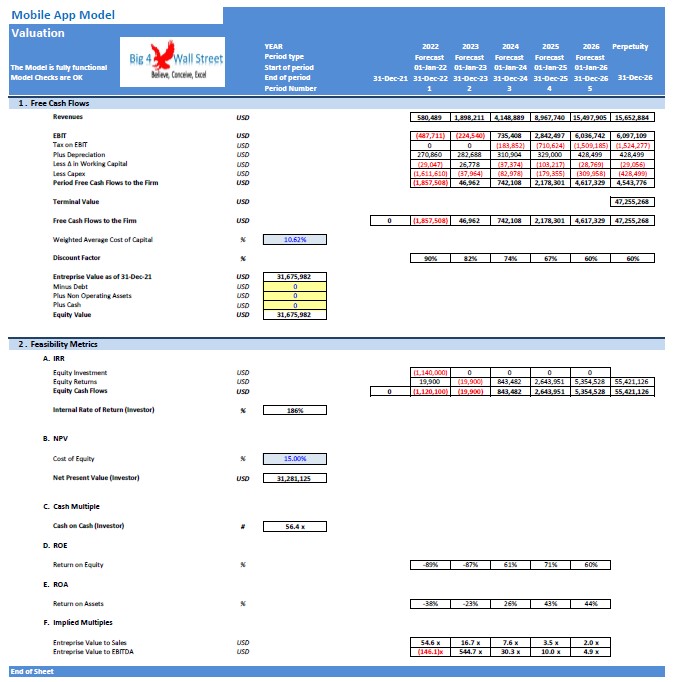
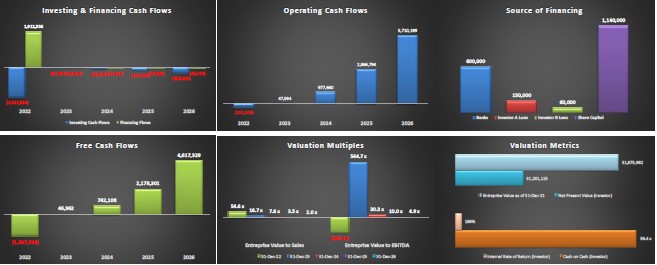
In the Valuation tab, the valuation of the company is performed based on the free cash flows to the firm. In the same tab you can also find some feasibility metrics such as Return on Equity, Return on Assets, Net Present Value, Internal Rate of Return and Cash on Cash Multiple.
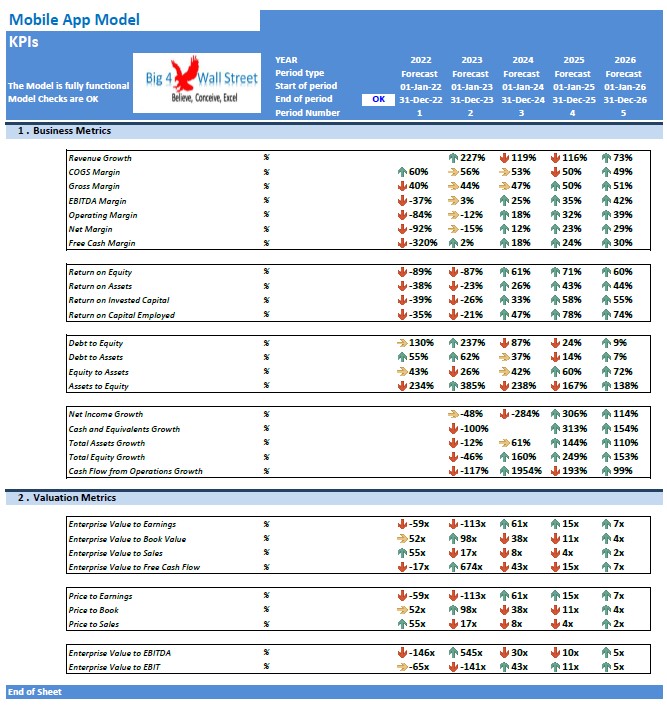
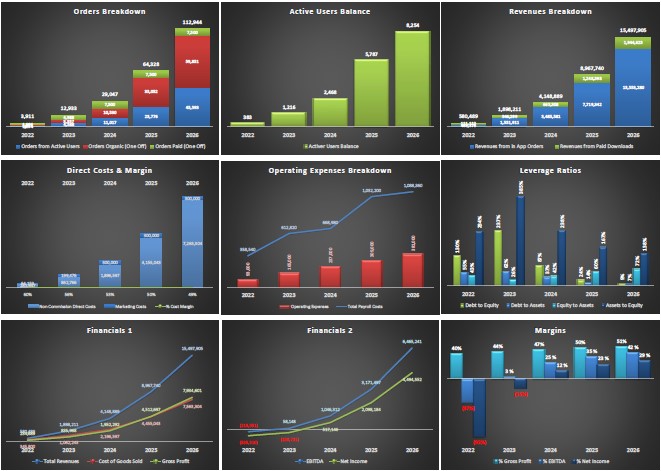
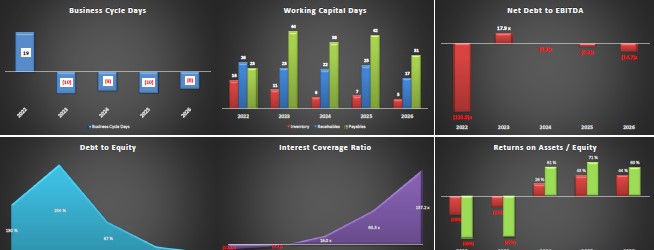
The most important business and financial KPIs are presented in the KPIs tab along with various valuation metrics. These KPIs are also presented by using some graphical representations in the Graphs tab. For example: Revenues & Operating Profit, Cost of Goods Sold, Cash Flows as well as several other financial metrics from valuation to profitability, working capital and debt.
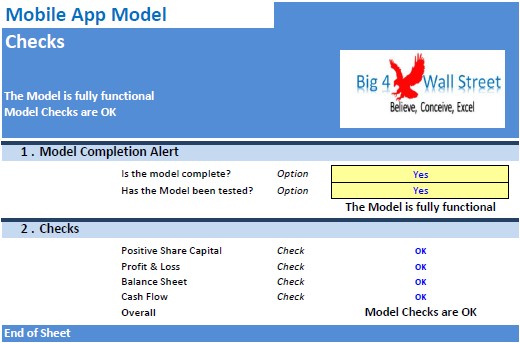
Finally the checks tab where the most critical checks are aggregated in this page. Whenever you see an error message in any page, you should consult this page to see where the error is coming from.
The financial model presents the business case of a Mobile App Business. A mobile application, also referred to as a mobile app or simply an app, is a computer program or software application designed to run on a mobile device such as a phone, tablet, or watch.
This financial model template will enable you to:
- Plan the sources of monetization from downloads & in app orders, their conversion rates, as well as their churn rates
- Forecast the revenues (from downloads, and orders from organic, paid downloads and active users )
- Analyze the direct costs for running the app such as cost margin, credit card costs, servers and customer service costs as well as marketing costs.
- Setting up payroll costs, and operating expenses.
- Set the initial investment amount and the equipment / servers needed
- Set the relevant currency and timing
- Create the three financial statements (Profit and Loss, Balance Sheet and Cash Flow) monthly for 60 months.
- Financial Ratios to check the viability of your business
- Printable model as PDF for your investors
So, a quick overview of the model, in the contents tab you can see the structure of the model and by clicking on any of the headlines to be redirected to the relevant worksheet.
On the timing tab you can feed the general information for the model such as: model name, responsible, timeline of the model and date and currency conventions.
Additionally, there is a description of the color coding of the model in the same tab. Inputs are always depicted with a yellow fill and blue letters, call ups (that is direct links from other cells) are filled in light blue with blue letters while calculations are depicted with white fill and black characters.
There is also a color coding for the various tabs of the model. Yellow tabs are mostly assumptions tabs, grey tabs are calculations tabs, blue tabs are outputs tabs (that is effectively results or graphs) and finally light blue tabs are admin tabs (for example: the cover page, contents and checks).
Moving on to the inputs tab, you can adjust the various assumptions of the model based on the specifications and requirements of your business. So effectively you can adjust the detailed revenue assumptions and the user can amend the most important drivers such as: downloads from organic traffic, downloads from paid marketing budget, price per paid download, conversion rates, average orders and average order amount . Moving on, the cost is comprised of three main categories: direct costs (cost margin of mobile app, payment processing, servers, customer support, marketing ), labor cost (headcount, salaries, employment costs and other benefits), and operating costs (rent, utilities, insurance, advertising, other supporting tools, etc.). Going forward you can adjust noncurrent assets, capex as well as their depreciation schedule, the working capital assumptions (inventory, receivables, and payables) can also be adjusted accordingly and finally the financing assumptions of the business whether these are debt or equity financed can also be amended.
On the calculation tab, all calculations are performed instantly without the need of an excel macro. The calculations follow the same logical flow as the in the inputs tab. As already mentioned, no inputs from the use are needed here, as all the inputs are fed in the yellow cells on the inputs tab only.
On the Financial Statements tabs you can see the resulting income statement, balance sheet as well as the cash flow of the company and or project. These financial statements are generated on a monthly as well as on a yearly basis.
In the Valuation tab, the valuation of the company is performed based on the free cash flows to the firm. In the same tab you can also find some feasibility metrics such as Return on Equity, Return on Assets, Net Present Value, Internal Rate of Return and Cash on Cash Multiple.
The most important business and financial KPIs are presented in the KPIs tab along with various valuation metrics. These KPIs are also presented by using some graphical representations in the Graphs tab. For example: Revenues & Operating Profit, Cost of Goods Sold, Cash Flows as well as several other financial metrics from valuation to profitability, working capital and debt.
Finally the checks tab where the most critical checks are aggregated in this page. Whenever you see an error message in any page, you should consult this page to see where the error is coming from.
This Best Practice includes
1 Excel and 1 PDF
