Parking Lot Development Financial Model
Originally published: 03/10/2025 16:50
Last version published: 12/10/2025 14:22
Publication number: ELQ-36049-3
View all versions & Certificate
certified

Parking Lot Development Financial Model

Parking Lot Development Financial Model with 10-year projections, feasibility analysis, NOI, IRR, and investor-ready outputs.

Description
This financial model is designed to evaluate the investment feasibility, operating performance, and return metrics of a parking lot or parking garage development project. The model provides a comprehensive 10-year projection of revenues, expenses, and cash flows, structured on a monthly basis with annual summaries for streamlined reporting. An additional 11th projection year is included specifically to compute the stabilized Net Operating Income (NOI), which serves as the basis for determining the exit or terminal value at the conclusion of the 10-year investment horizon.

The structure captures land acquisition, construction outlays, pre-opening expenses, ramp-up after opening, and eventual stabilization, ensuring both short-term operational detail and long-term financial visibility.

Model Structure – 4 Main Sections

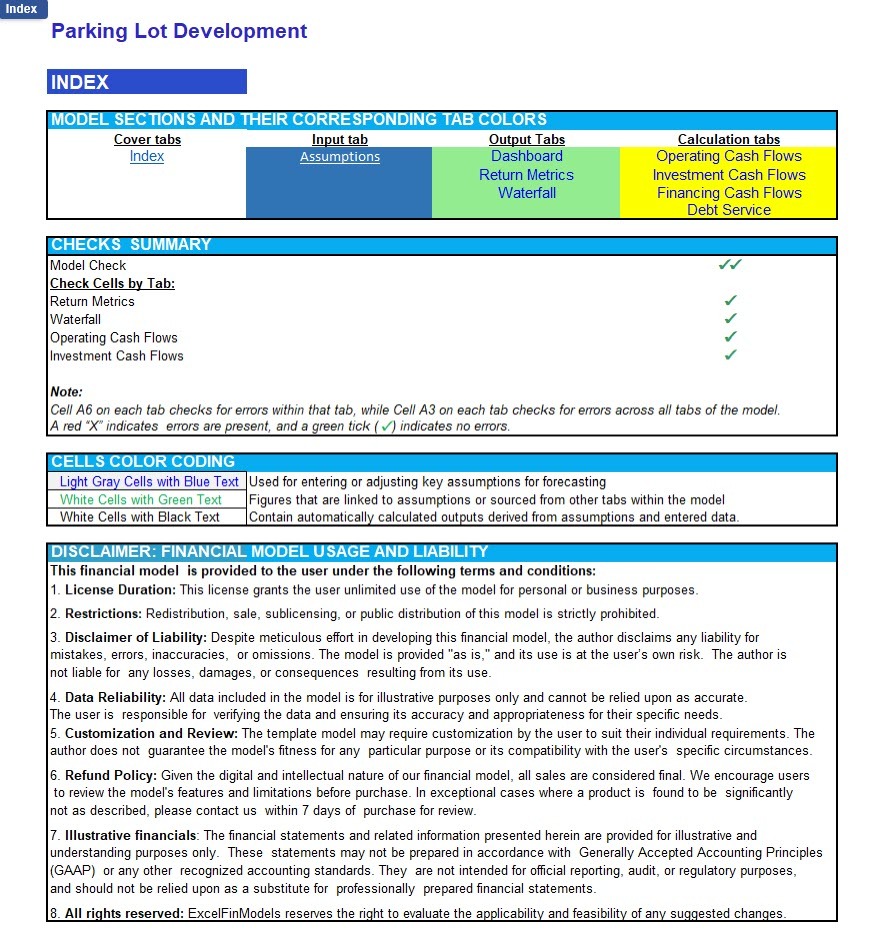
1. Index Section
  • Provides a centralized navigation and summary interface.
  • Includes cell color-coding guidelines, tab color-coding for user orientation, a checks summary showing error status across different tabs, and a disclaimer regarding the intended use of the model.
  • Cell A1 in every tab links directly back to this Index tab.

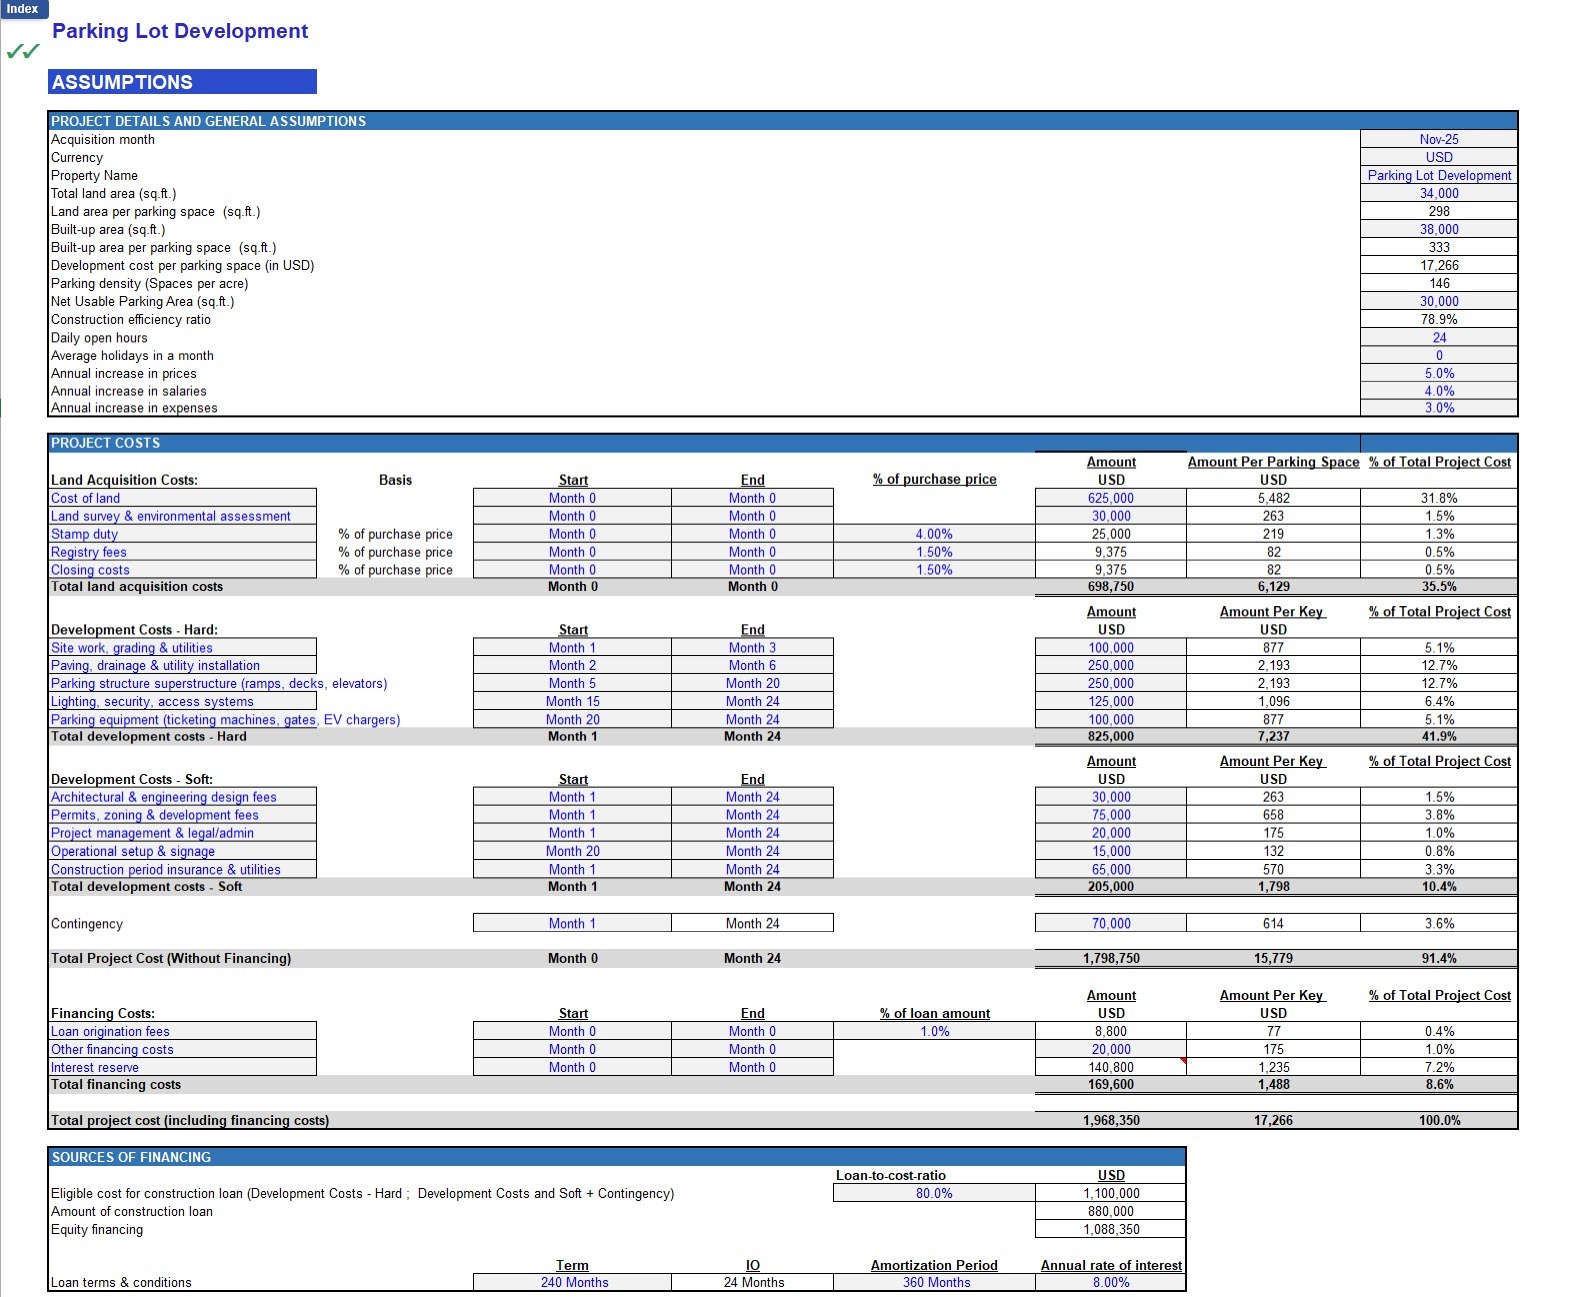
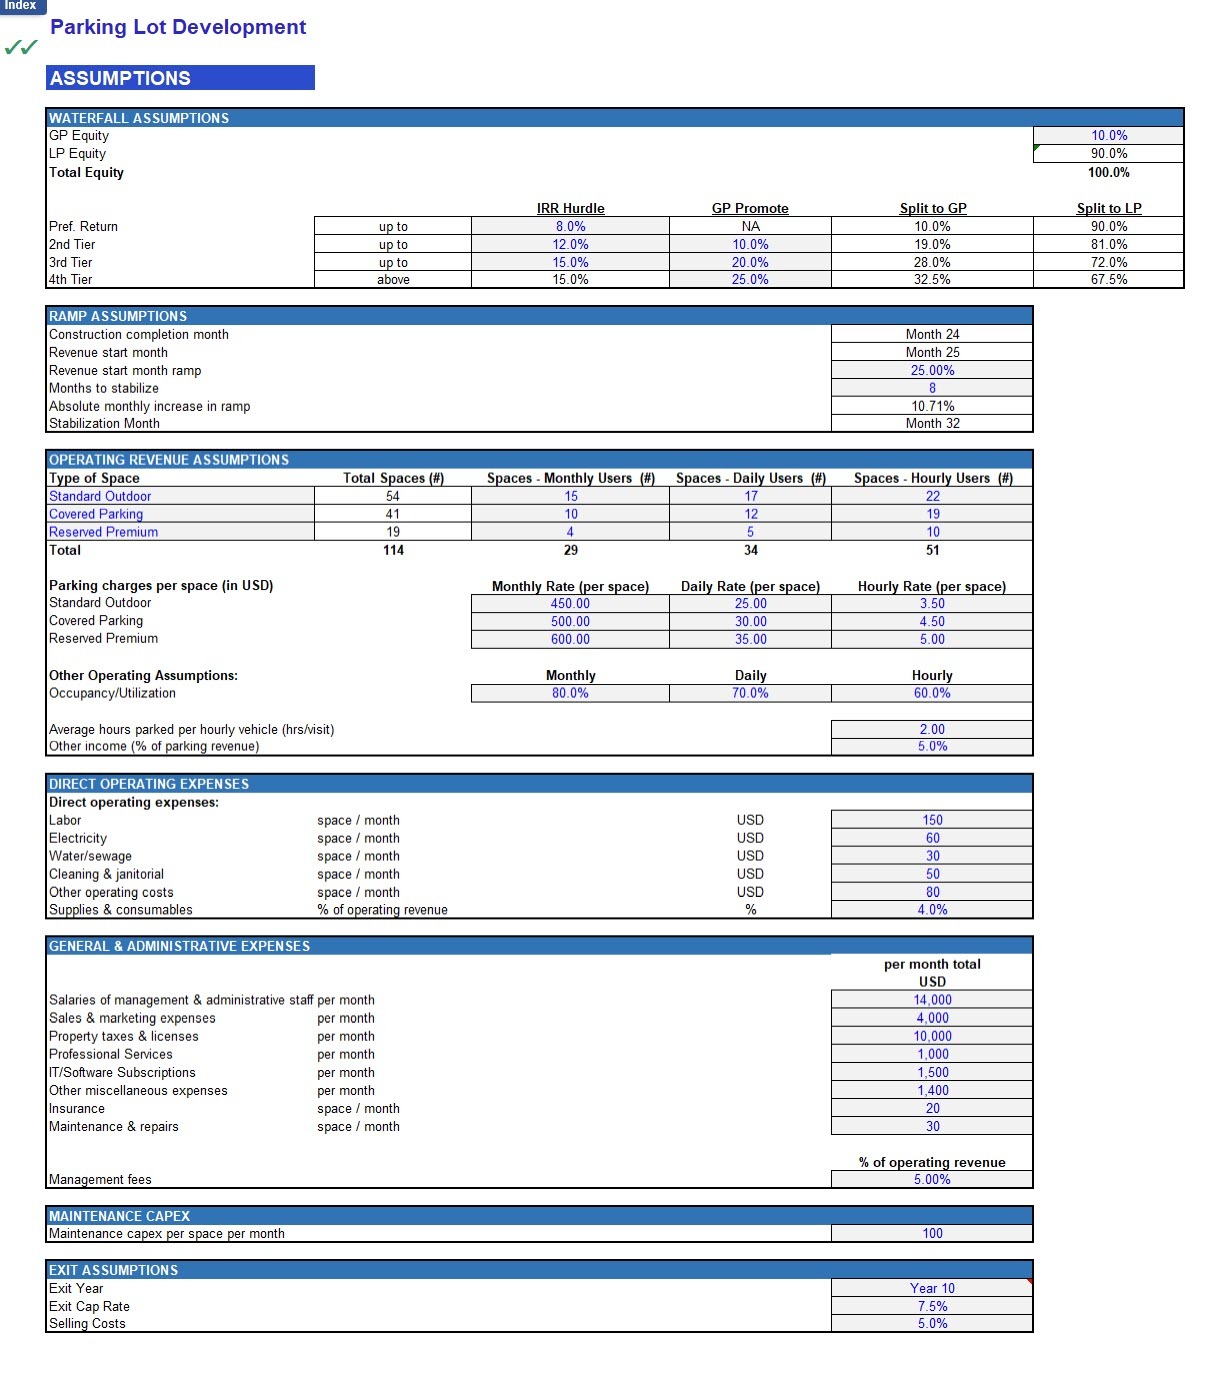
2. Assumptions Section

  • Core input area for all project and operating assumptions, structured for transparency and ease of use.
  • Key assumptions captured include:
    • Investment costs (land, hard construction, soft costs, contingency, and financing costs).
    • Sources of funding (equity and debt).
    • Ramp-up schedule.
    • Depreciation assumptions
    • Number of different types of parking space like Standard Outdoor, Covered Parking and Reserved Premium
    • Allocation of parking spaces into monthly, daily and hourly), utilization assumptions, and average rate per vehicle, daily open hours.
    • Ancillary revenue (EV charging, valet services, advertising, concessions).
    • Direct operating expenses like labor, electricity, water, sewage, cleaning etc.
    • G&A expenses: management & admin staff, marketing, property taxes, management fees.
    • Maintenance capex
    • Inputs for waterfall distribution (preferred return, hurdle rates, promote structure).
3. Output Section
  • Presents the key financial results in both tabular and graphical form.
  • Includes:
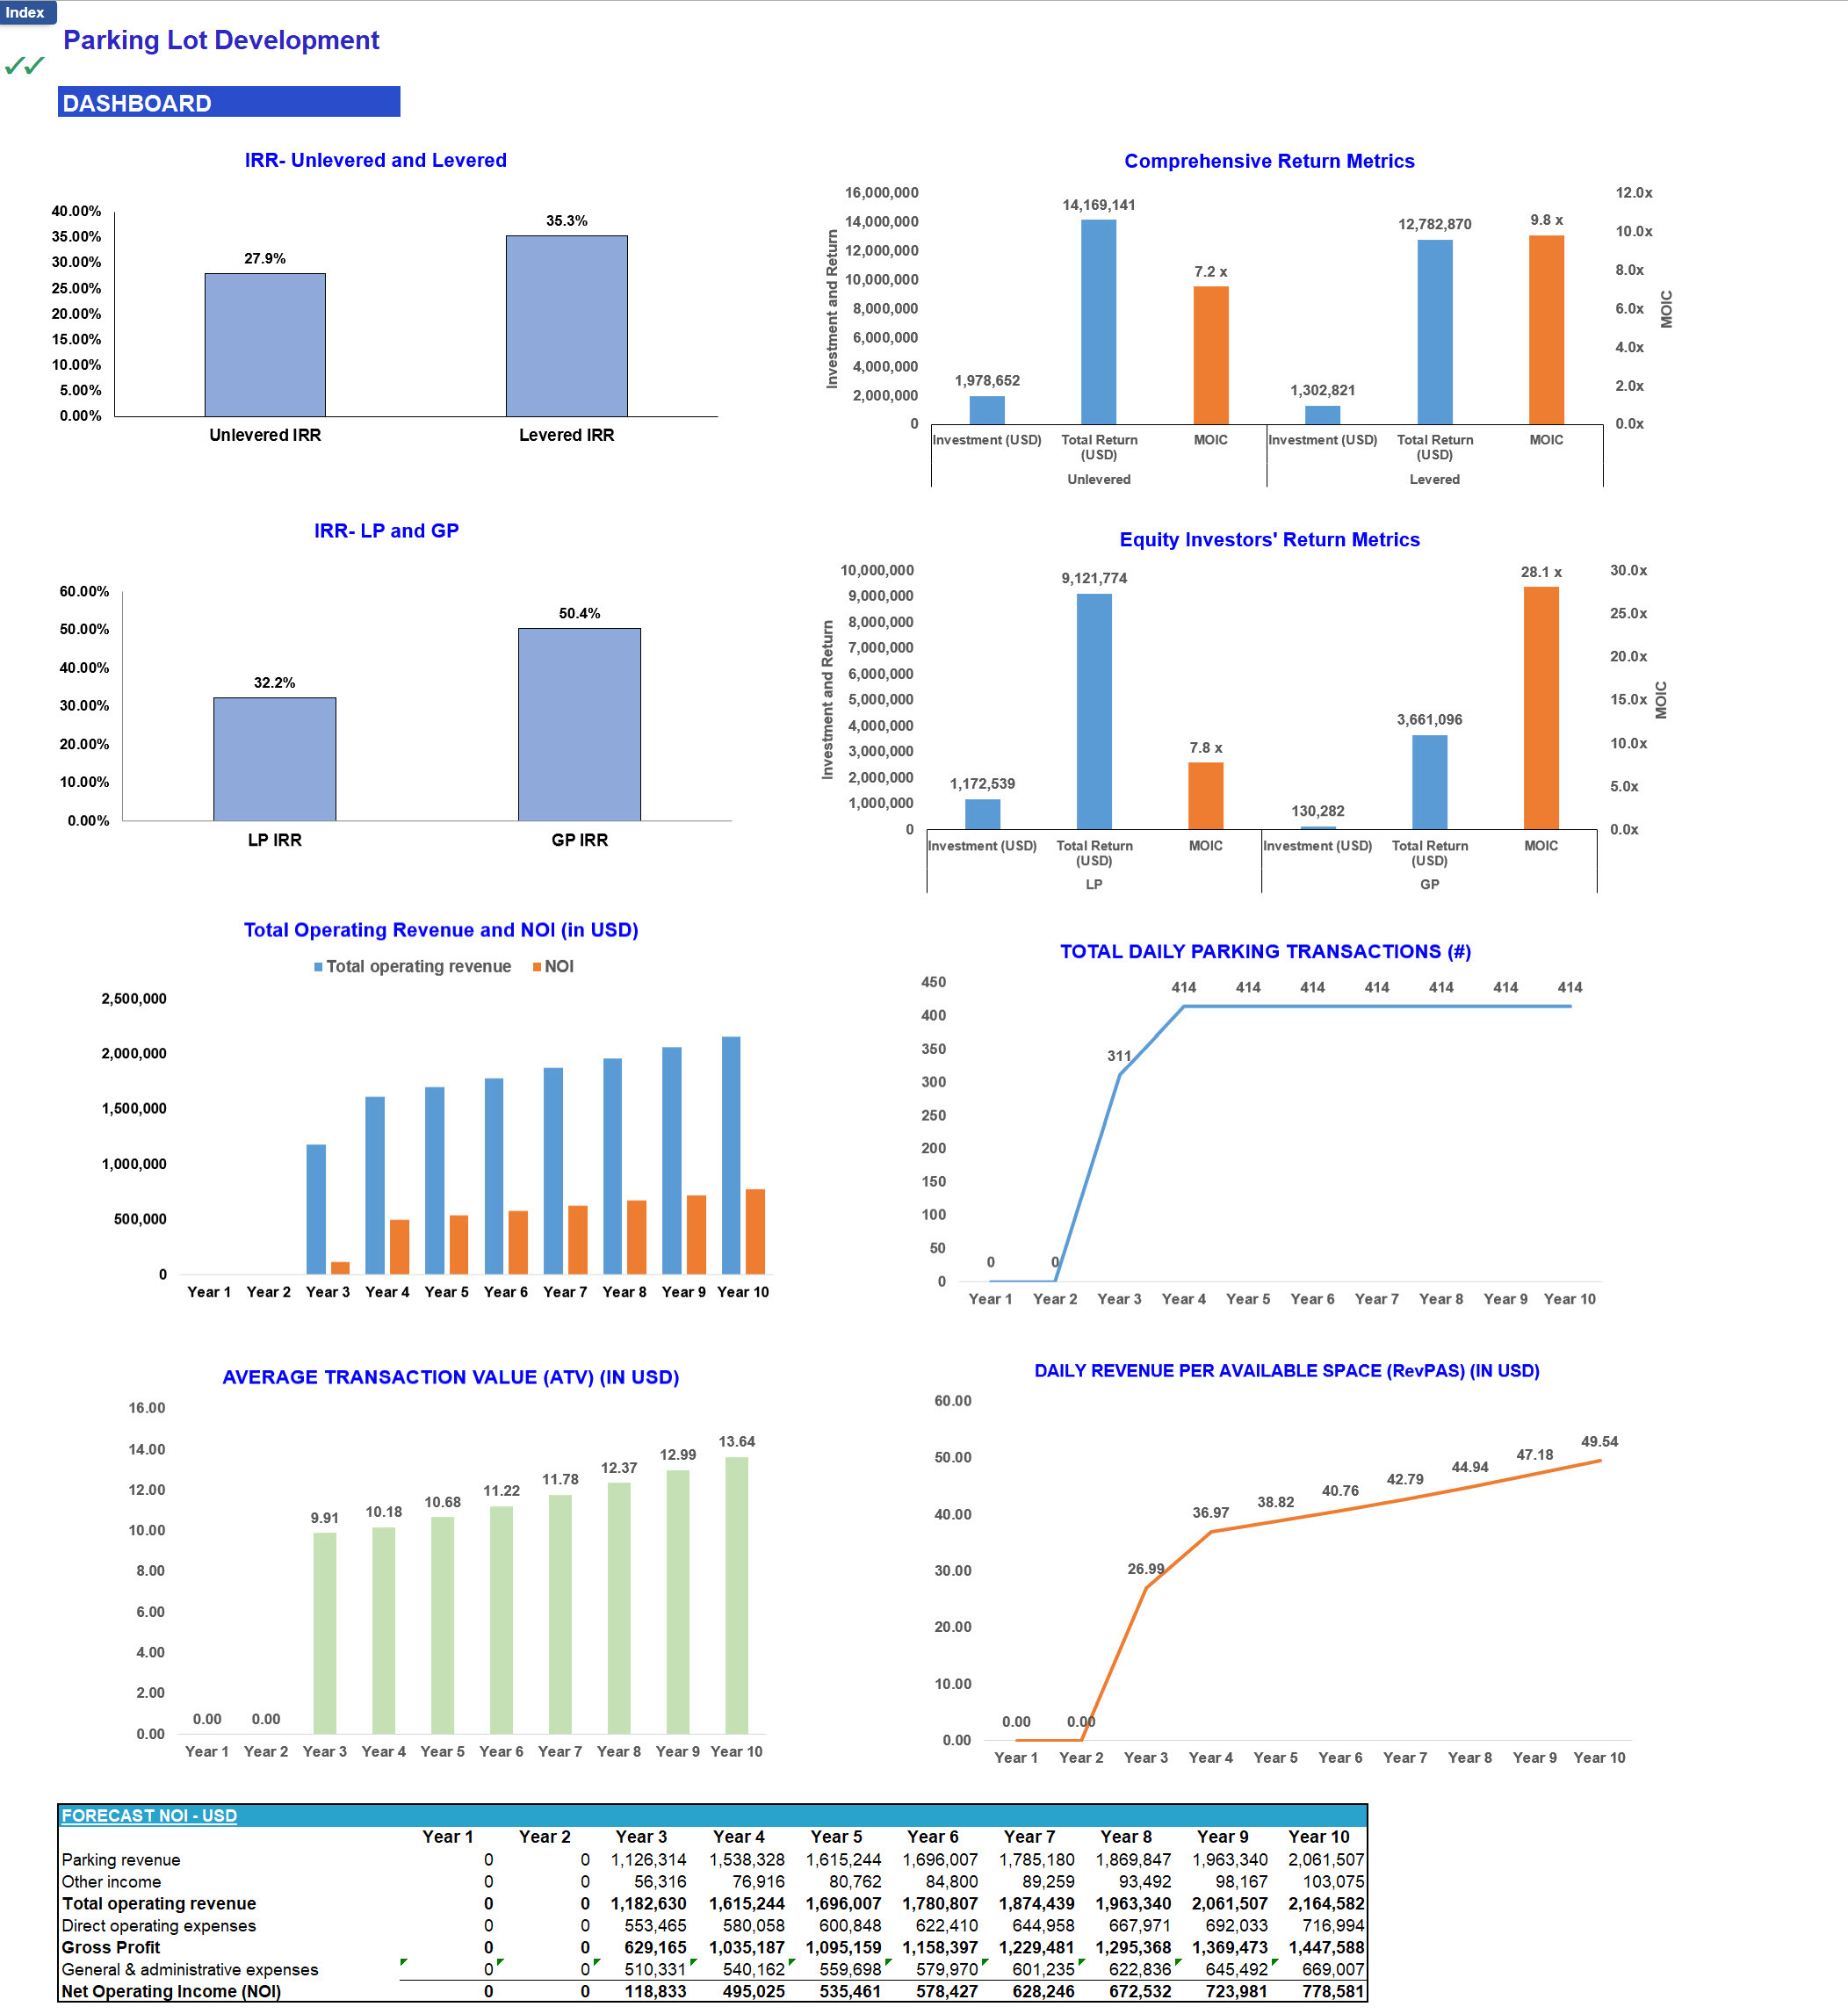
    • Dashboard Tab: Charts and summary tables for quick review.
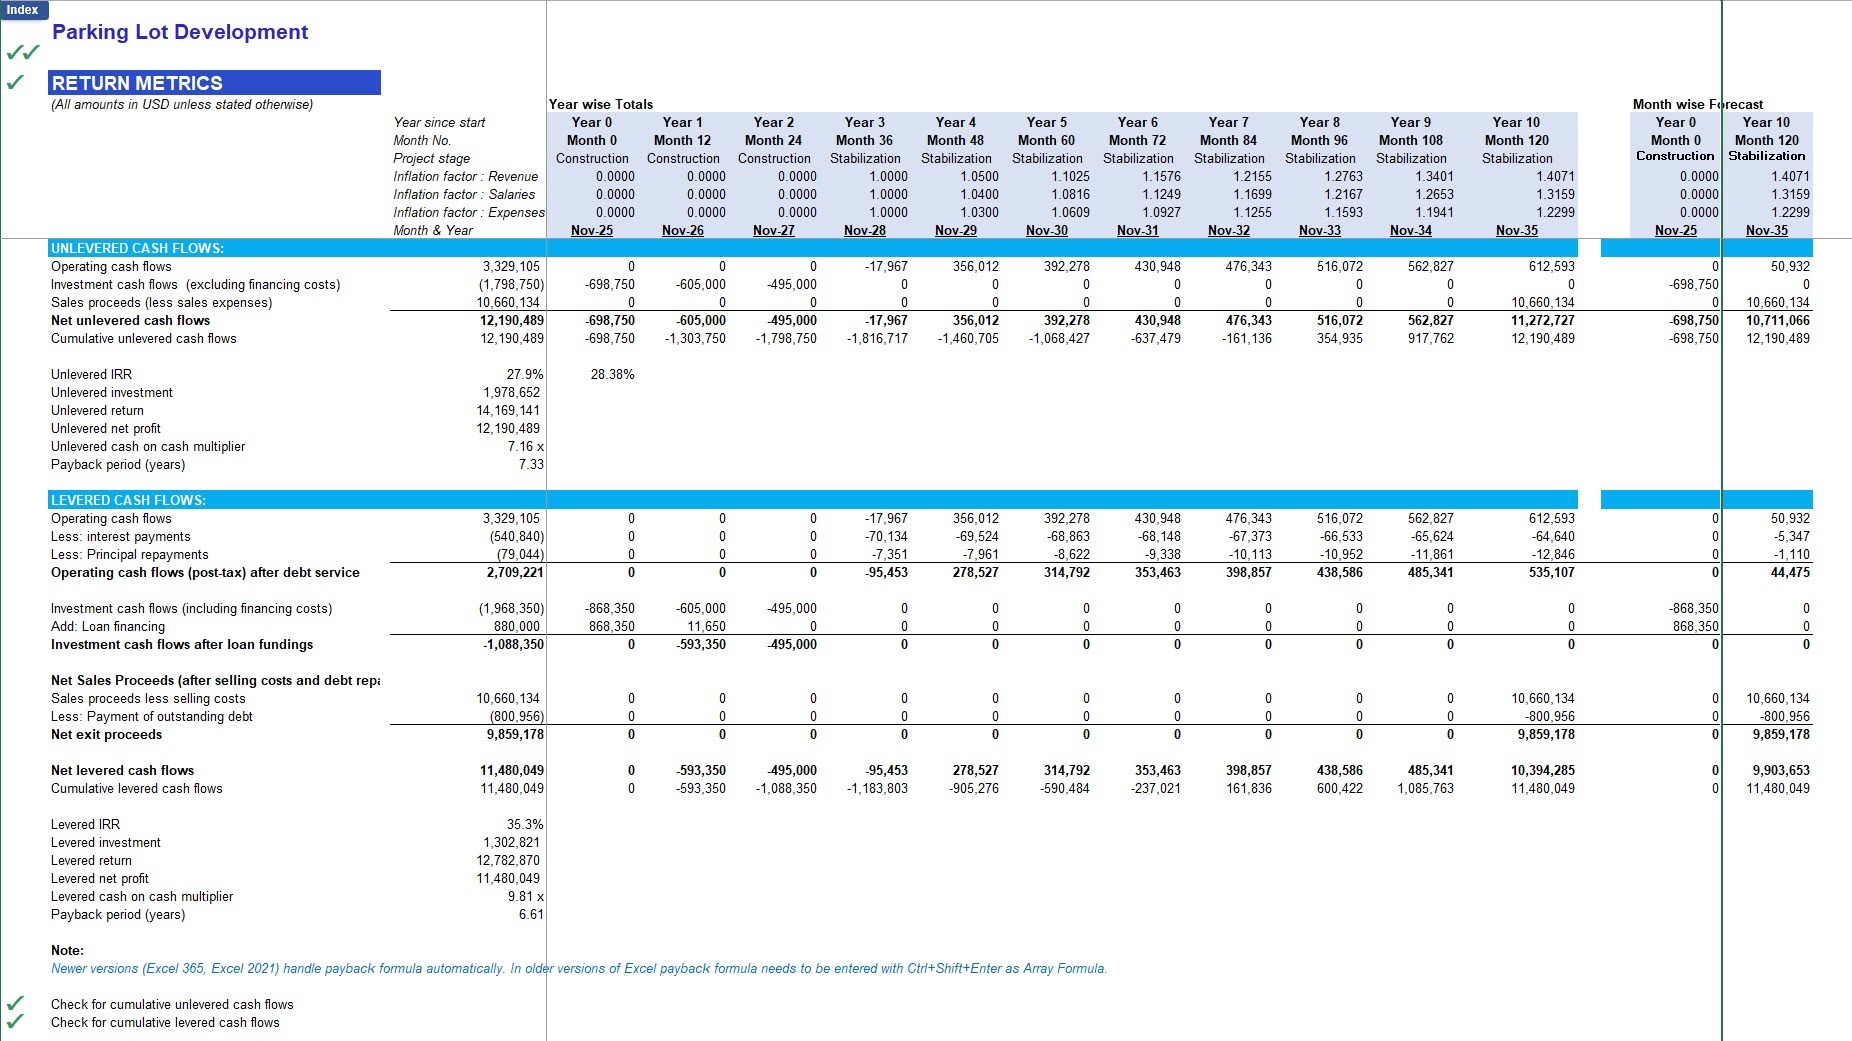
    • Return Metrics Tab: Unlevered IRR, Levered IRR, equity multiples, payback period.
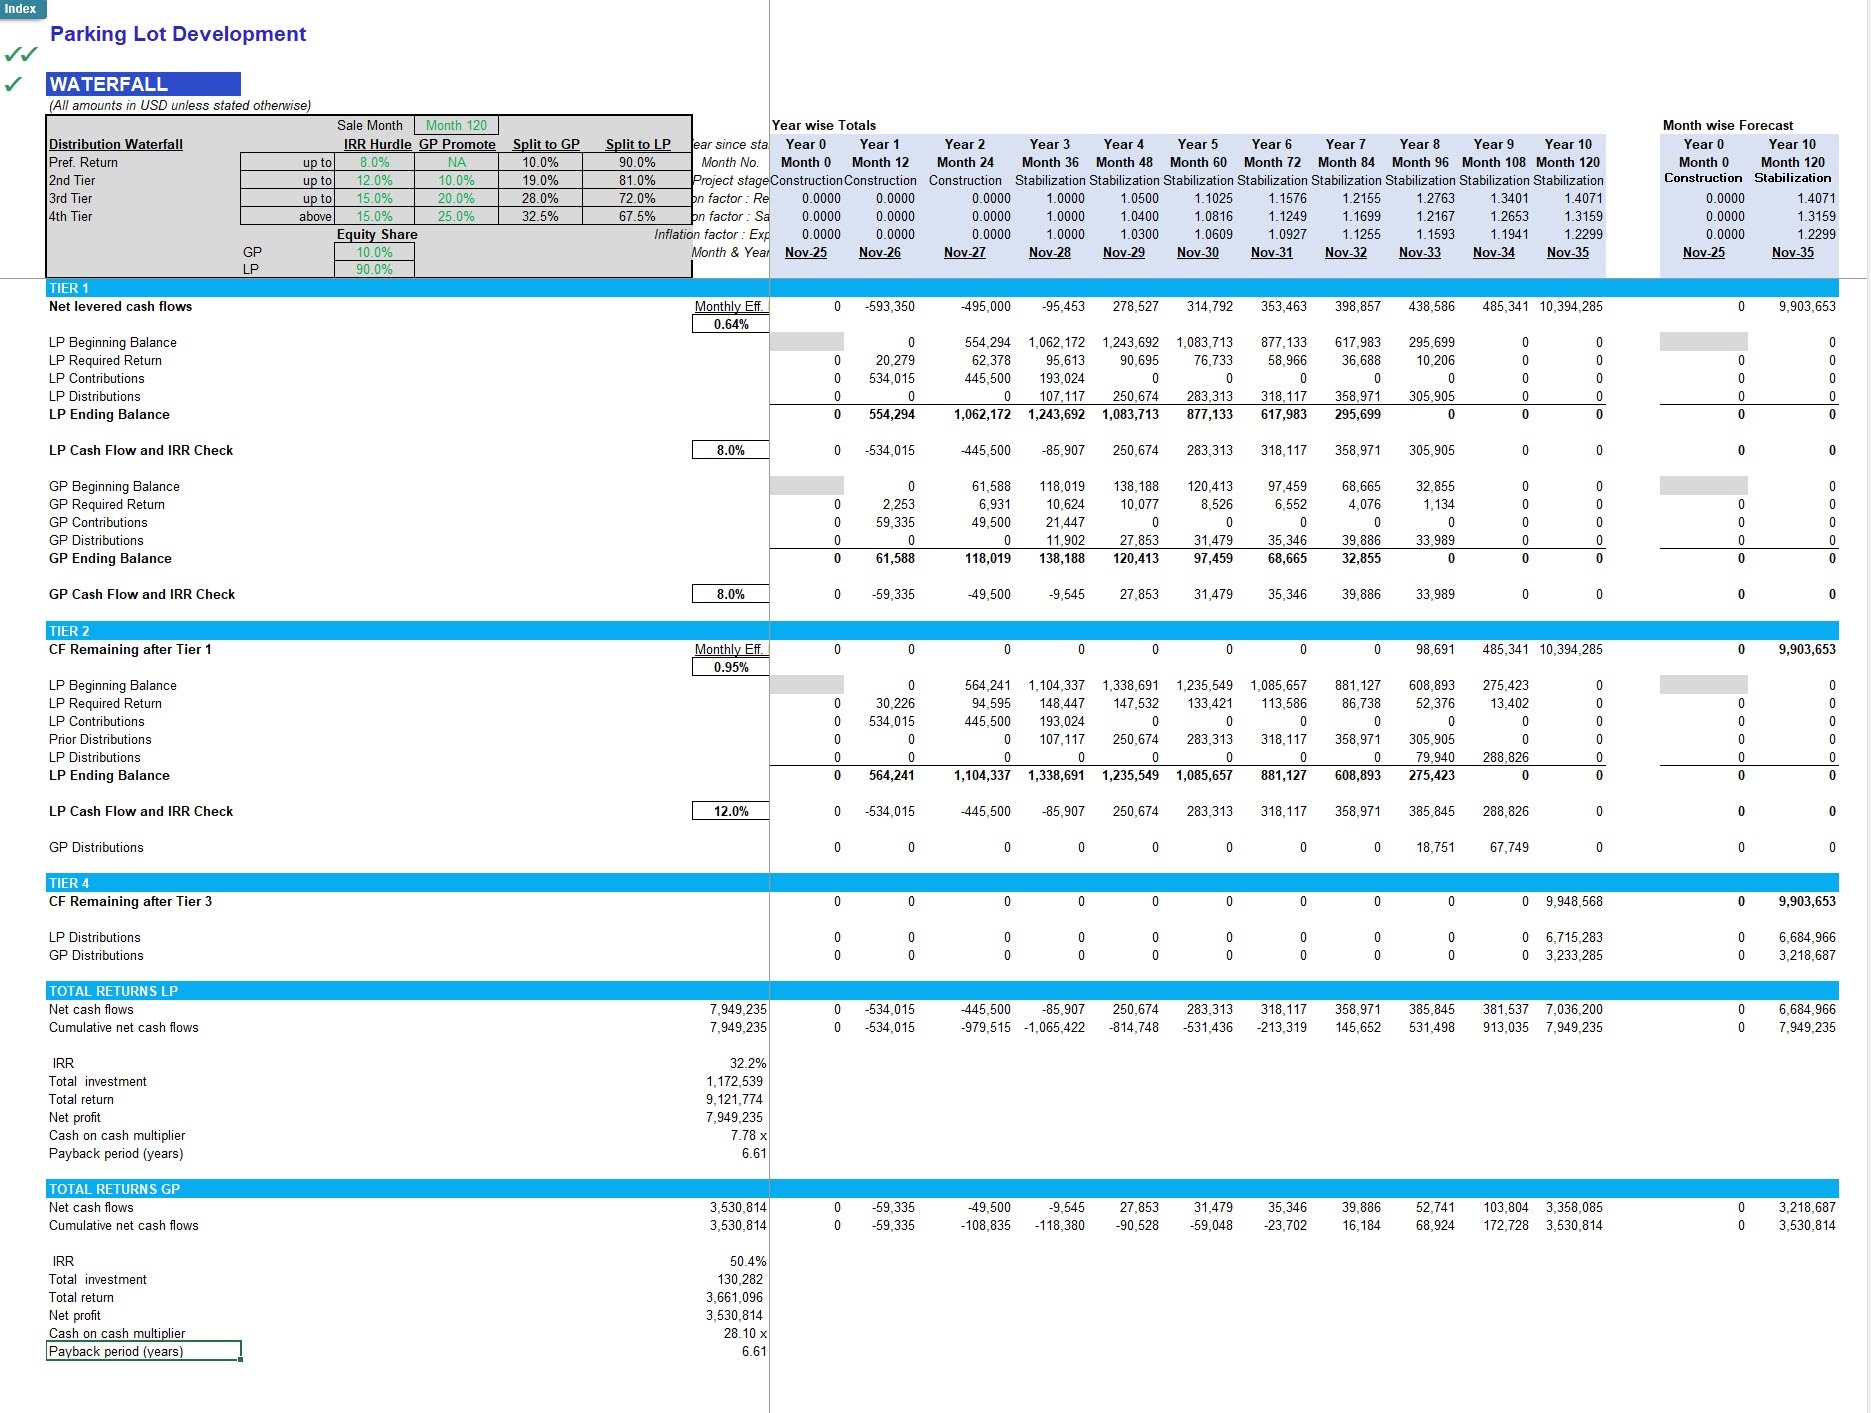
    • Waterfall Distribution Tab: Detailed LP/GP distributions across hurdles, with IRR splits and promote allocation.
4. Calculations Section
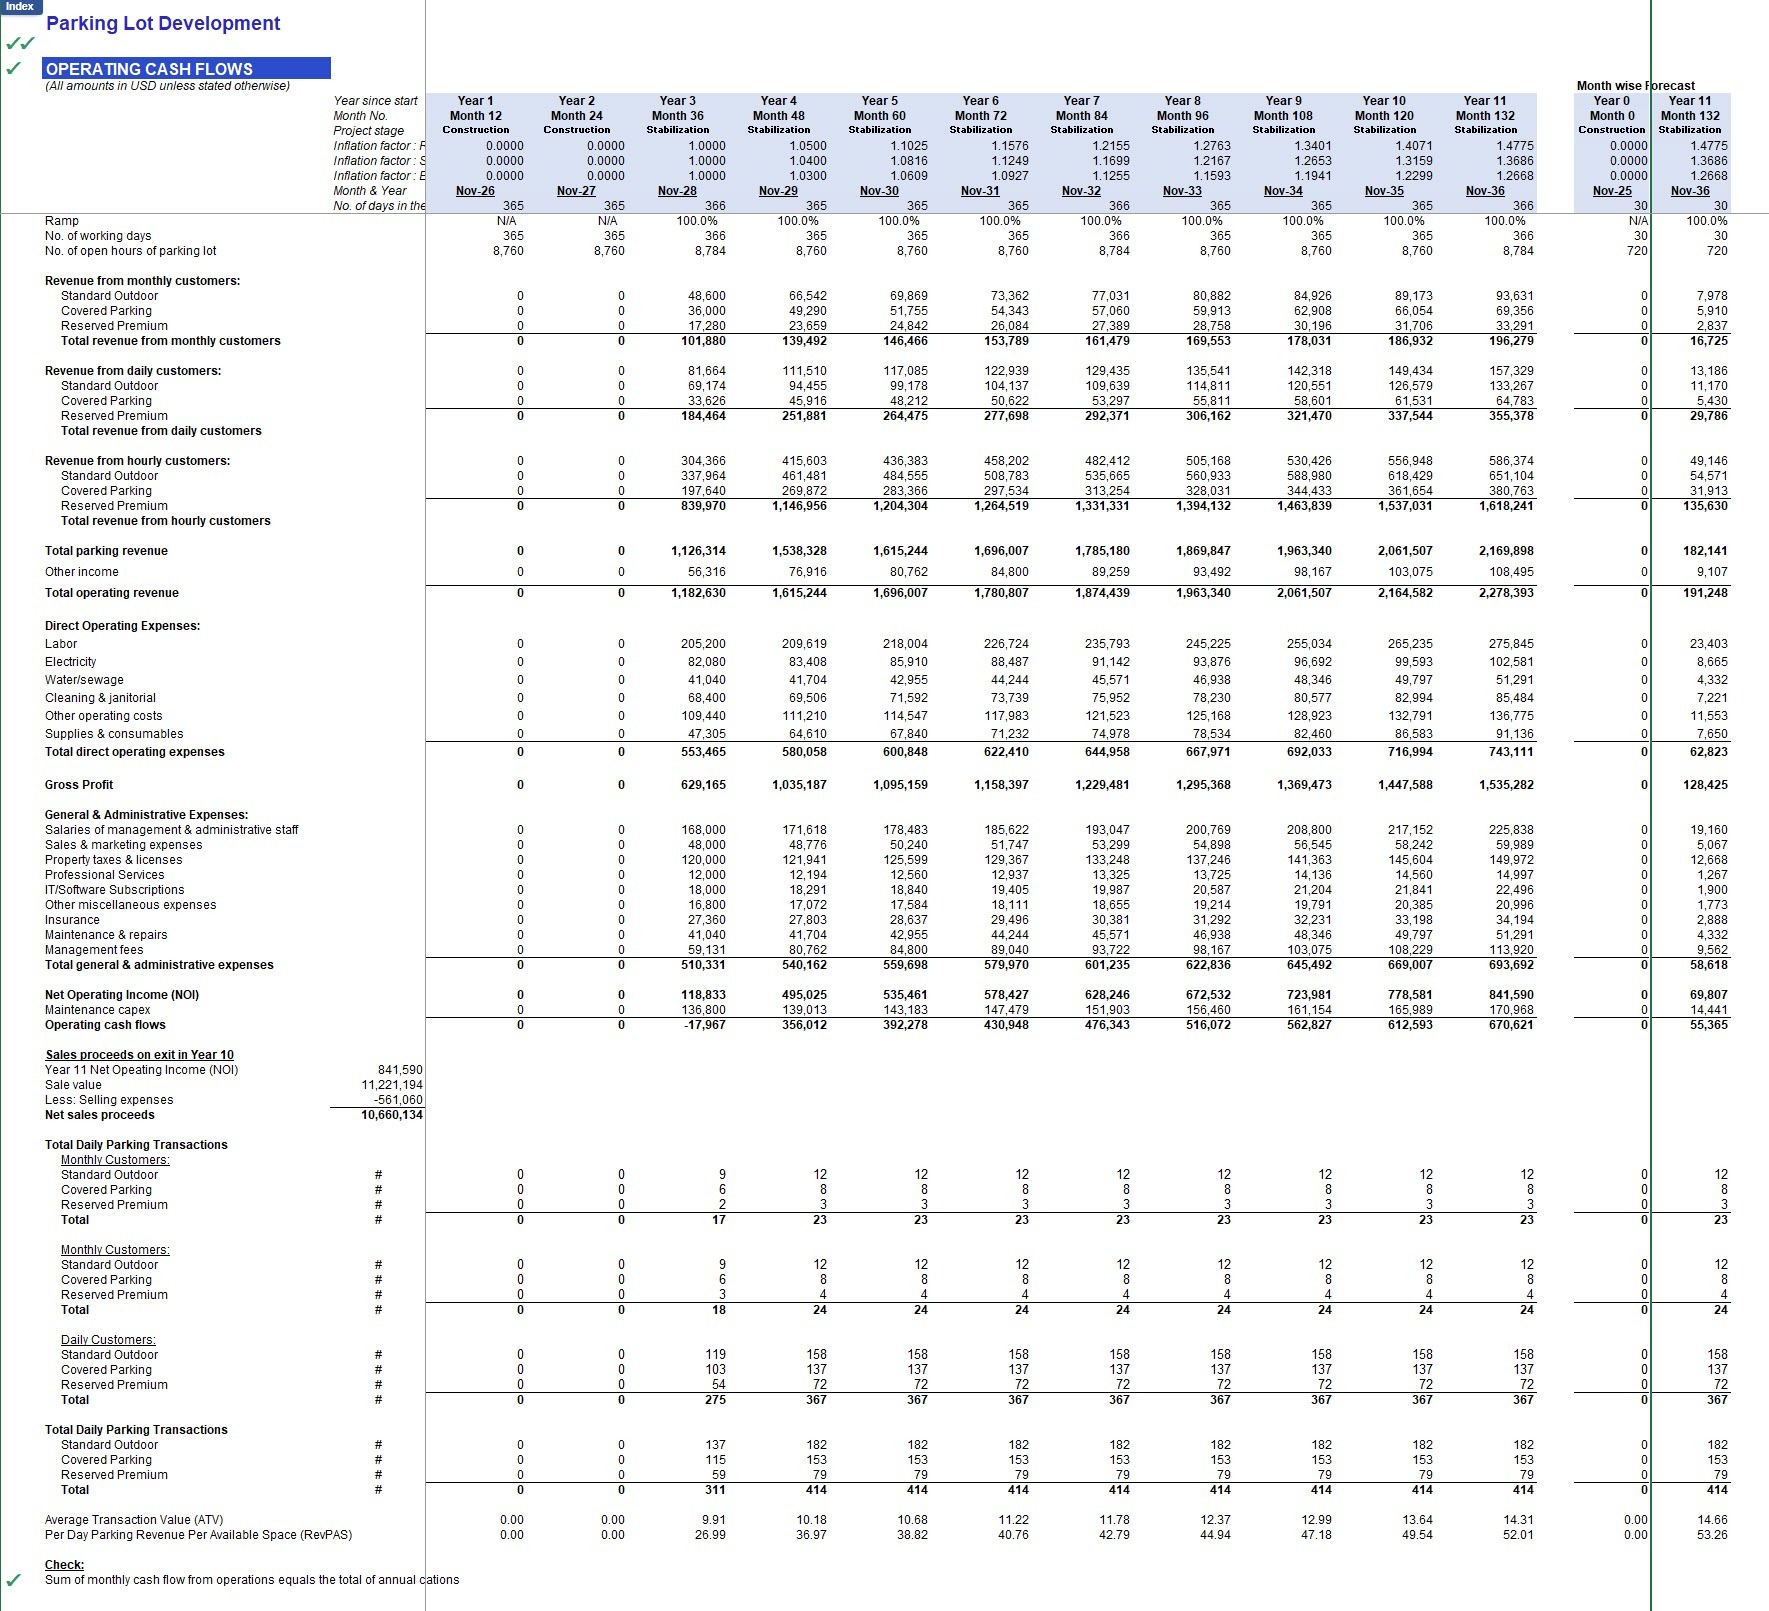
  • Operating Cash Flows: Consolidates detailed calculations for parking revenues (hourly/daily fees, monthly passes, ancillary services) and operating expenses, producing the facility’s NOI and cash flows from operations.
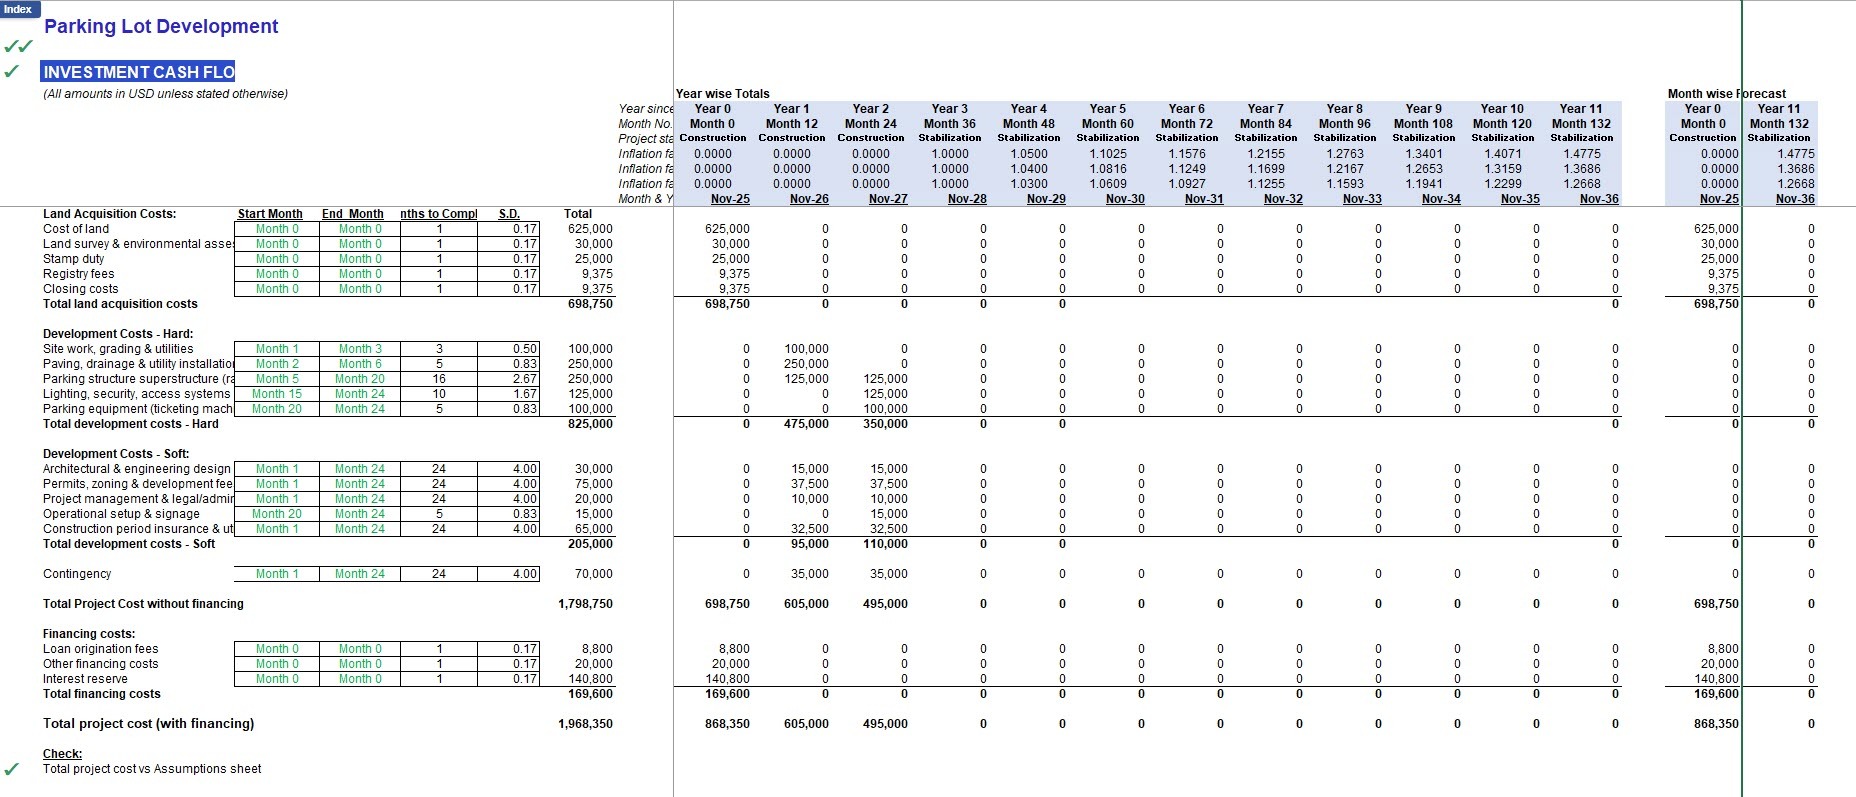
  • Investment Cash Flows Tab: Tracks monthly development outlays across cost heads, using an S-curve to reflect realistic phasing.
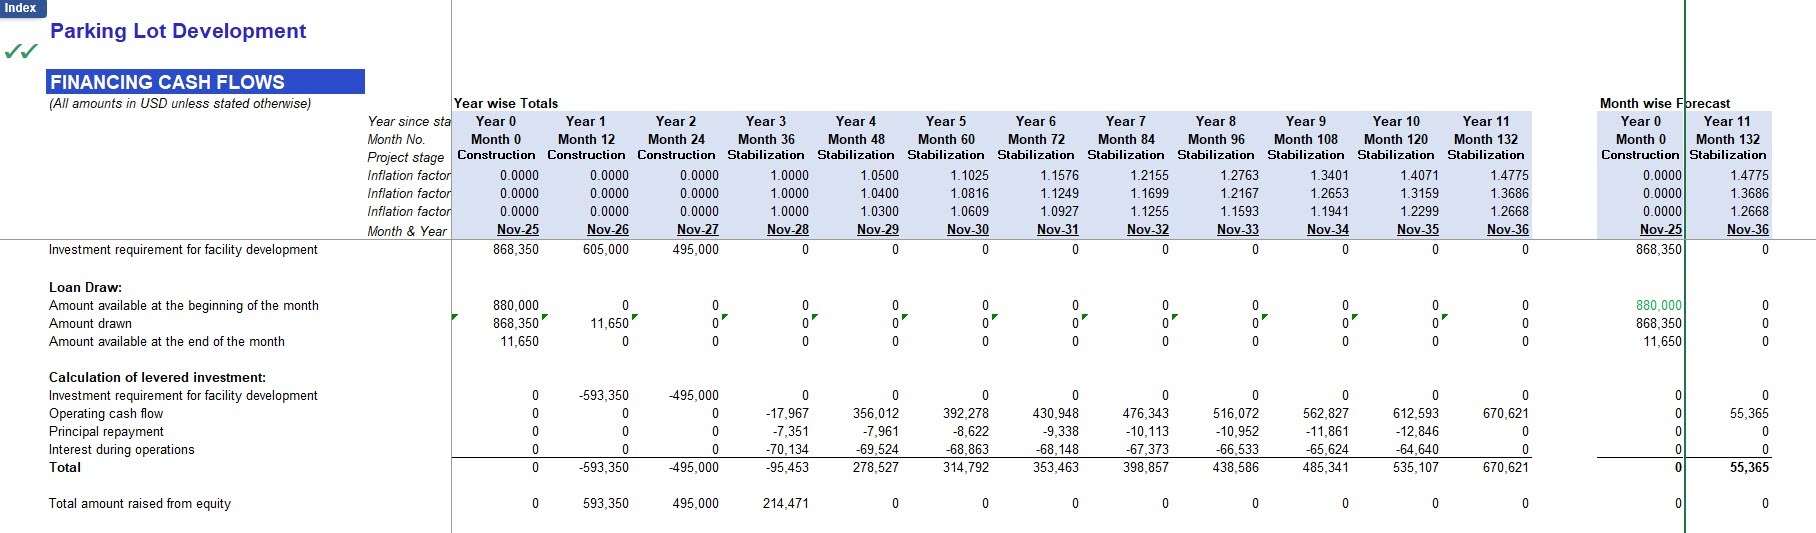
  • Financing Cash Flows: Records monthly sources of equity and debt funding, aligned with investment cash flows and operating shortfalls.
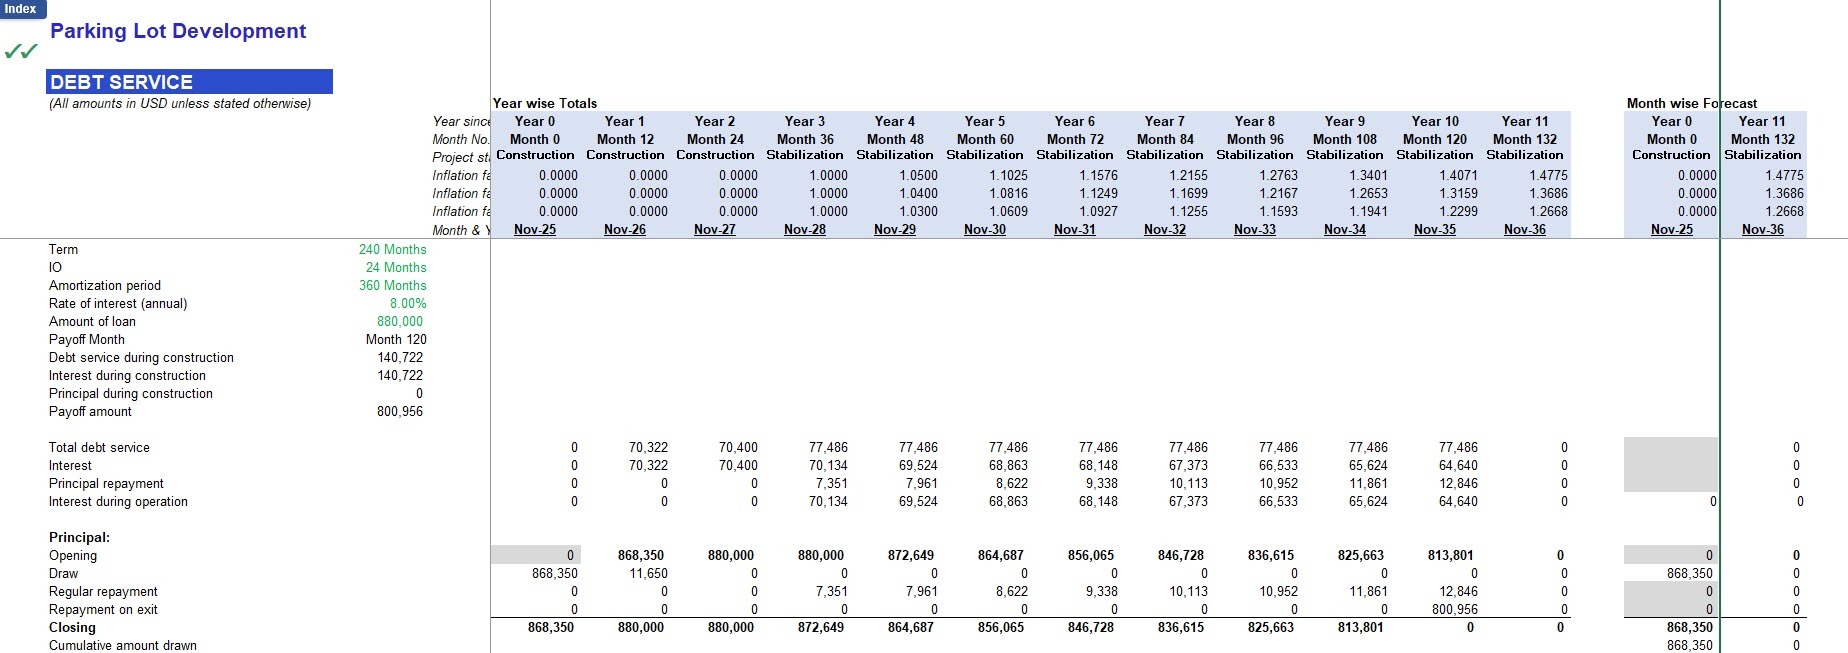
  • Debt Service Tab: Calculates interest expense, principal repayments, amortization schedules, and outstanding balances including payoff.
Other Features
  • Error-checking framework:
    • Cell A6 in each tab checks for tab-level errors.
    • Cell A3 in each tab checks for model-wide consistency errors.
    • Indicators display a green tick (✔) for no errors or a red X (✘) if issues are detected.
  • Navigation aid: Cell A1 on every tab links back to the Index tab.
  • Compatibility: Fully functional in Excel 2010 and later versions.

Why Choose This Model?
This model is purpose-built for parking lot development and investment projects. It balances clarity, flexibility, and investor-readiness, making it suitable for both internal feasibility analysis and external fundraising efforts. The structure provides 10 years of monthly forecasting with roll-up to annual summaries, ensuring detailed operational tracking and long-term efficiency.

It incorporates S-curve investment phasing, capacity and utilization-driven revenues (daily/hourly tickets, monthly passes, ancillary income), and comprehensive return metrics such as levered/unlevered IRR, MOIC, and payback period. In addition, the model includes a waterfall distribution module, allowing investors to evaluate GP/LP return splits under different hurdle structures.

Whether you’re evaluating a new parking lot development, securing financing, or preparing investor presentations, this model adapts to your requirements and provides the analytical depth stakeholders expect.

This Best Practice includes
1 Excel Sheet

Acquire business license for $139.00

Add to cart

Add to bookmarks

Discuss

Further information

This financial model aims to provide a robust framework for evaluating the investment feasibility, operating performance, and return potential of a parking lot development project. It equips investors, developers, and entrepreneurs with reliable cost projections, revenue forecasts, and financial metrics to support decision-making, fundraising, and long-term planning.

This best practice applies best to parking lot or parking garage development projects requiring detailed feasibility analysis, structured cash flow projections, and investor-ready outputs. It is ideal for start-ups, real estate developers, and operators evaluating land acquisition, construction costs, and long-term operating performance.


0.0 / 5 (0 votes)

please wait...