
Last version published: 16/05/2026 18:18
Publication number: ELQ-42967-5
View all versions & Certificate

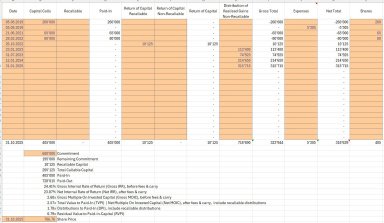
Share based TVPI, MOIC & IRR
Share based TVPI, MOIC & IRR in Excel Model
Further information
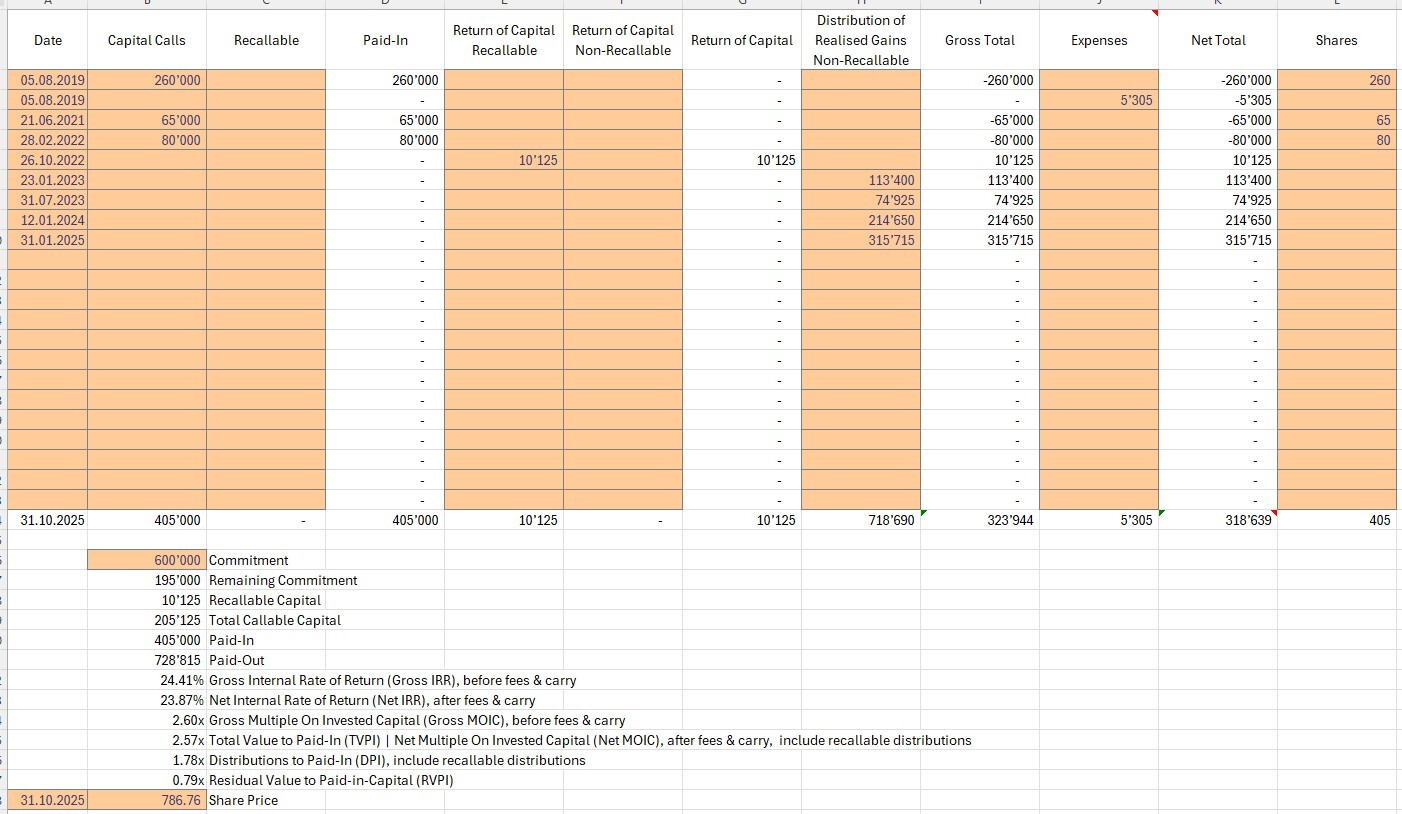
This downloadable Excel model is designed to help investors, fund managers, and analysts evaluate investment performance using share-based metrics. The primary objective is to provide a transparent and flexible framework for calculating key financial indicators—TVPI (Total Value to Paid-In), MOIC (Multiple on Invested Capital), and IRR (Internal Rate of Return)—based on actual capital flows and share allocations.
By linking each transaction to a number of shares, the tool enables dynamic valuation through share price modeling. It supports detailed tracking of capital calls, return of capital (RoC), distributions, and expenses, allowing users to assess how each component contributes to overall fund performance.
The model also includes a comprehensive summary section that aggregates commitments, remaining capital, paid-in amounts, and paid-out values, culminating in a final share price and performance snapshot as of the latest valuation date.
This best practice tool aims to:
Standardize performance reporting across investments
Improve transparency in fund valuation
Support decision-making for reinvestment or exit strategies
Enable consistent benchmarking across portfolios
It is ideal for use in internal reporting, investor communications, and strategic planning.
This best practice Excel model is most effective in scenarios where investment performance needs to be tracked and evaluated using share-based metrics. It is particularly well-suited for private equity, venture capital, or any fund structure where ownership is represented in units or shares and capital flows occur over time.
Ideal conditions include:
Investments with multiple capital calls, distributions, and expenses across different dates
Funds structured around share issuance and valuation
Portfolios requiring calculation of IRR, MOIC, and TVPI for performance benchmarking
Situations where transparency in fund performance reporting is critical
Internal or external reporting needs for LPs, fund managers, or analysts
Strategic planning or exit analysis based on historical cash flows and share value
This model is also beneficial when comparing investment outcomes over time, assessing the impact of reinvestments, or evaluating fund efficiency. It provides a clear, Excel-native framework that can be customized to fit various fund structures and reporting standards.
This Excel-based best practice tool is optimized for share-based investment structures and may not apply ideally in certain contexts. Specifically, it is less suitable for:
Investments without share-based tracking: If your fund or portfolio does not allocate ownership via shares or units, the share-based valuation logic may not be relevant.
Single lump-sum investments: The model is designed for tracking multiple capital calls and distributions over time. For one-time investments with no intermediate cash flows, simpler models may be more appropriate.
Real-time portfolio management: This tool is built for retrospective performance analysis and periodic reporting, not for live portfolio monitoring or trading.
Non-financial asset tracking: It is not intended for valuing assets like real estate, art, or commodities unless they are part of a structured investment fund.
Highly complex fund structures: Funds with layered instruments, waterfall models, or tiered carry structures may require more advanced modeling than this tool provides.
In such cases, users may need to adapt the model or use specialized software tailored to their specific investment structure or reporting requirements.
