
Originally published: 12/11/2021 08:53
Publication number: ELQ-92761-1
View all versions & Certificate
Publication number: ELQ-92761-1
View all versions & Certificate

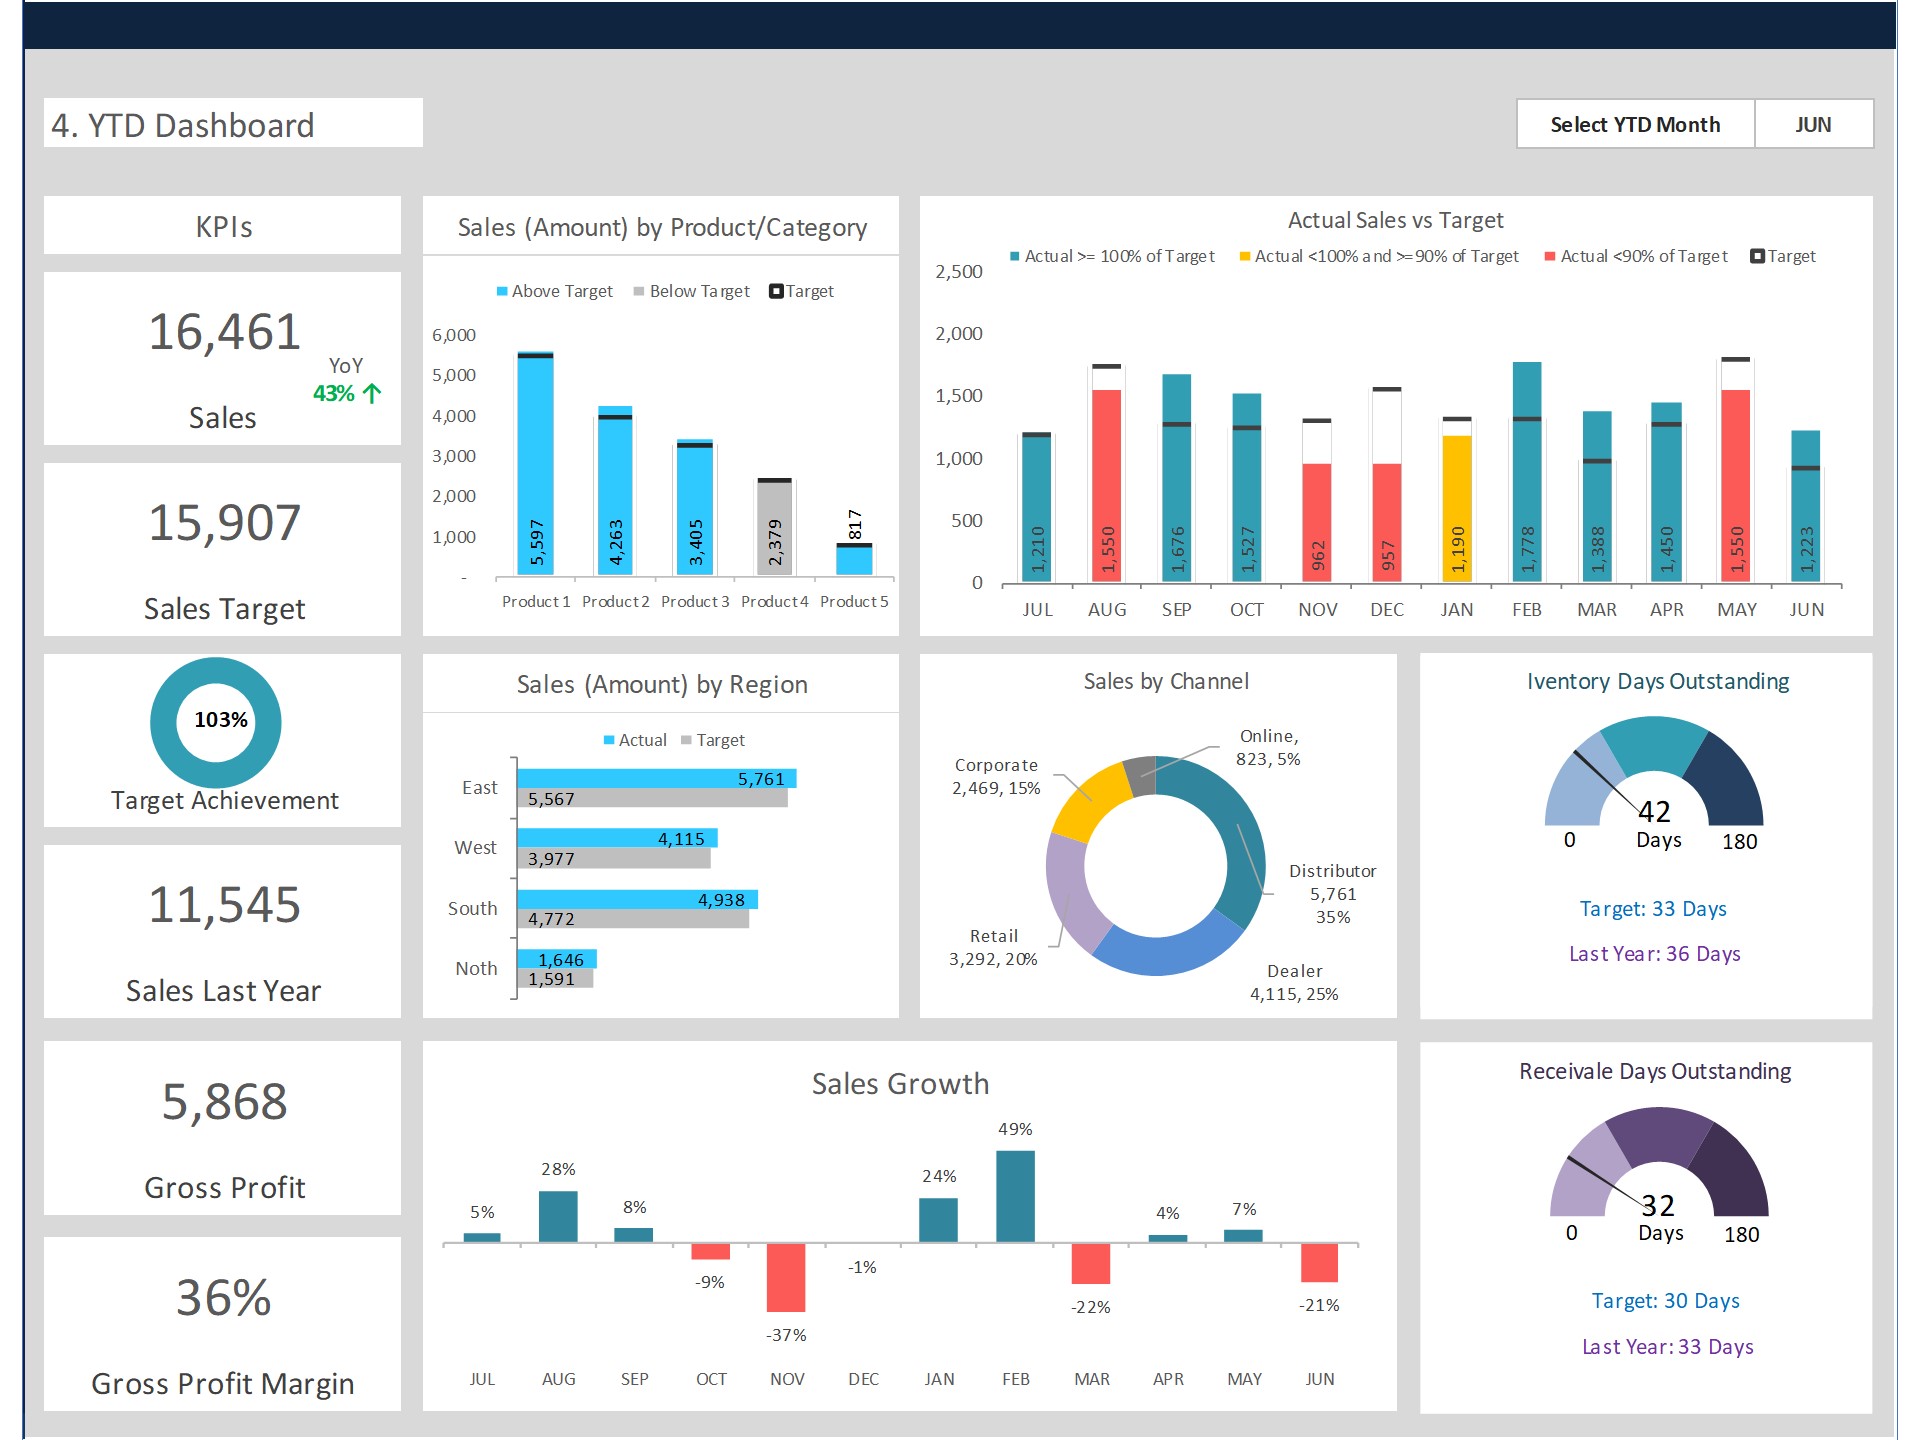
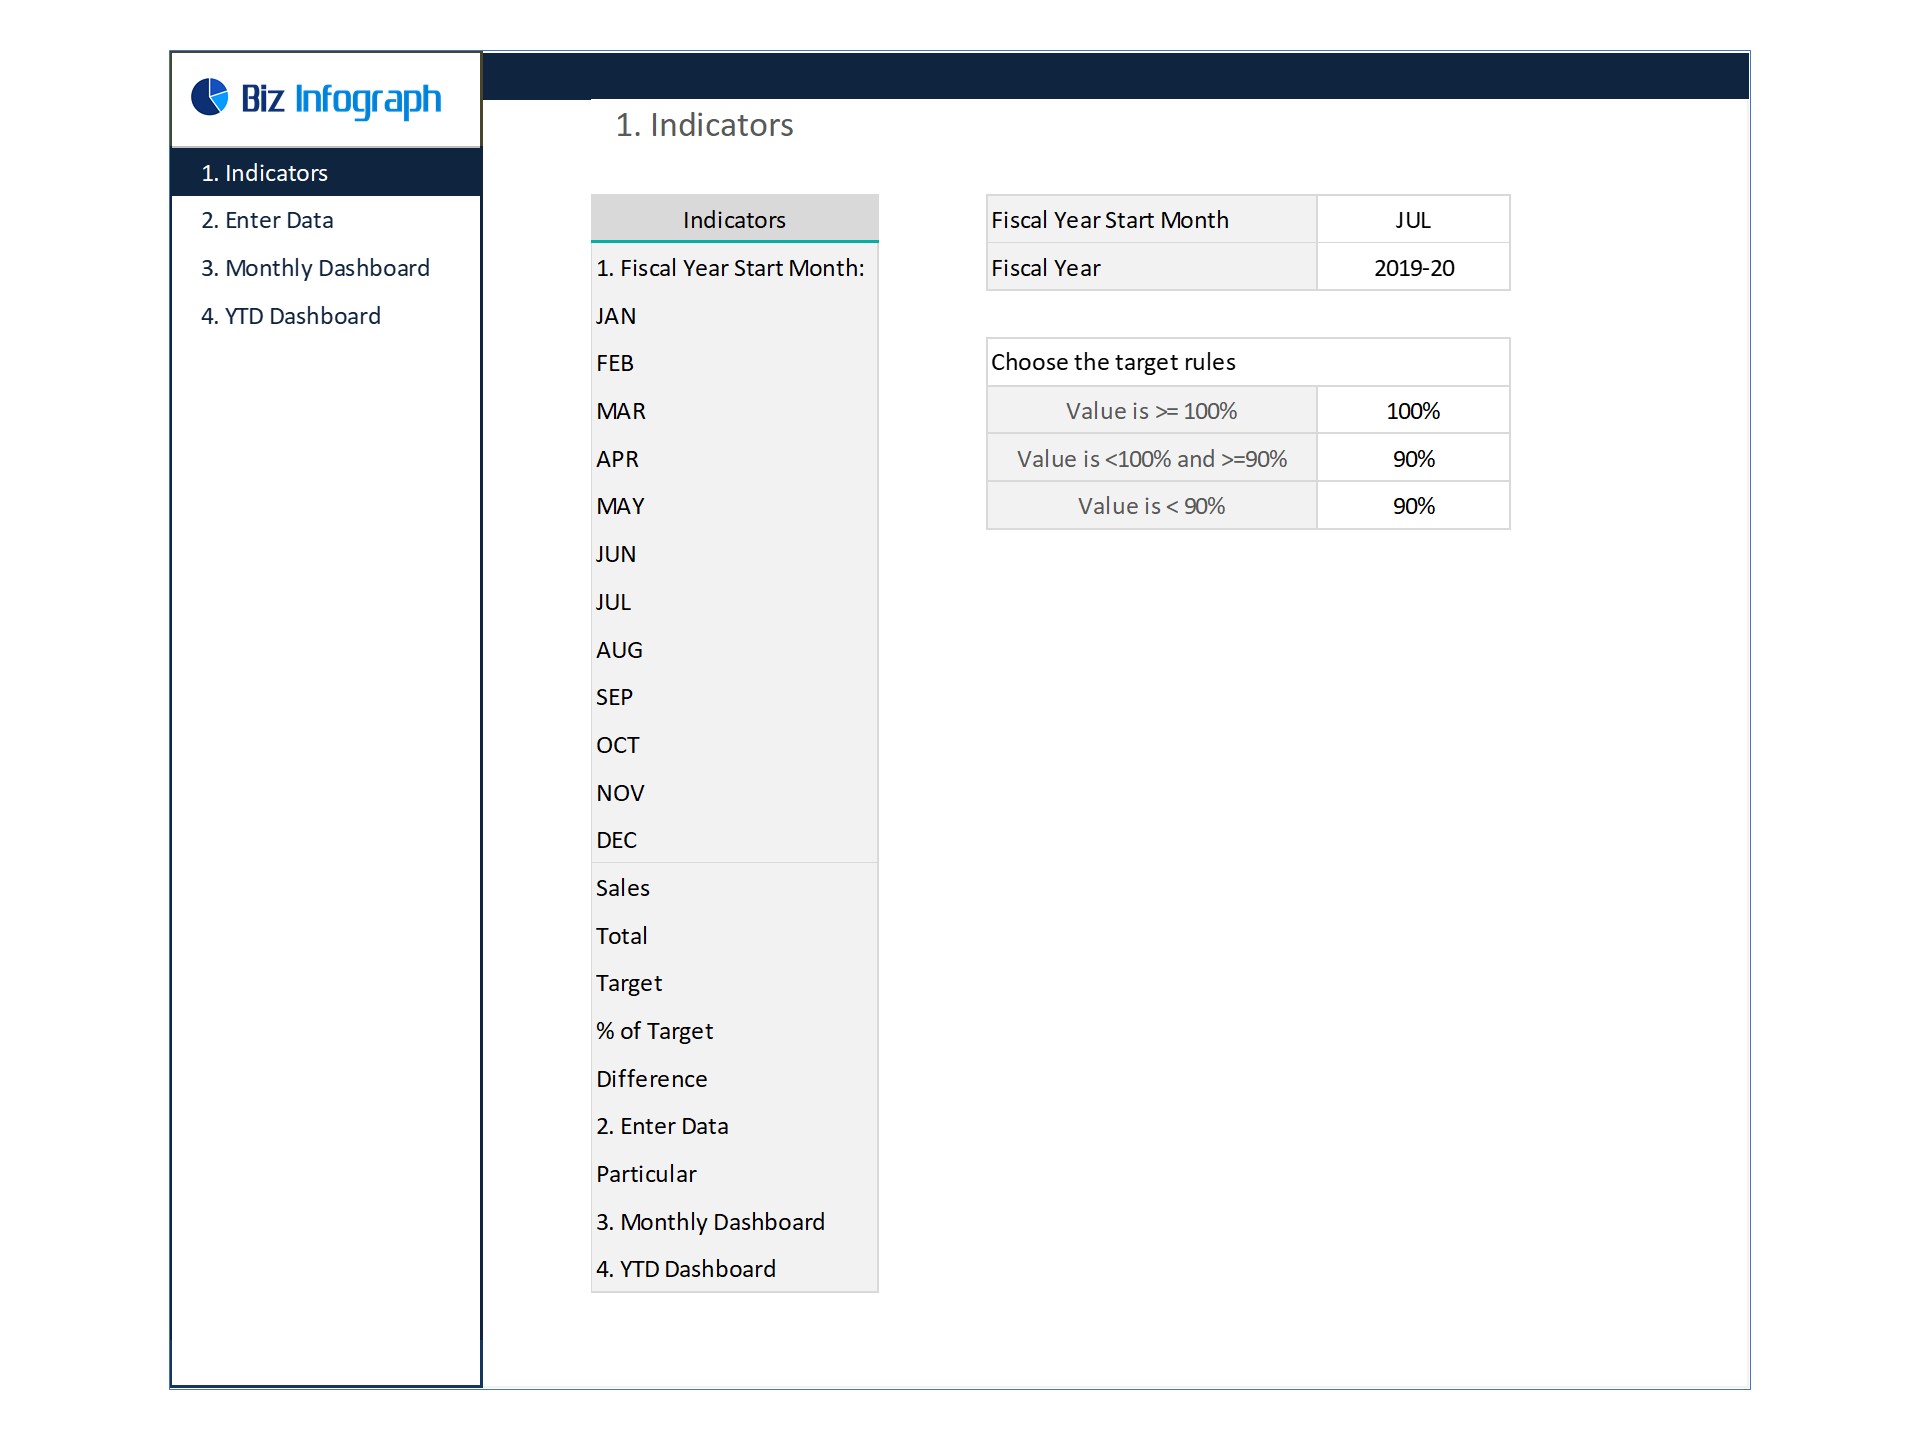
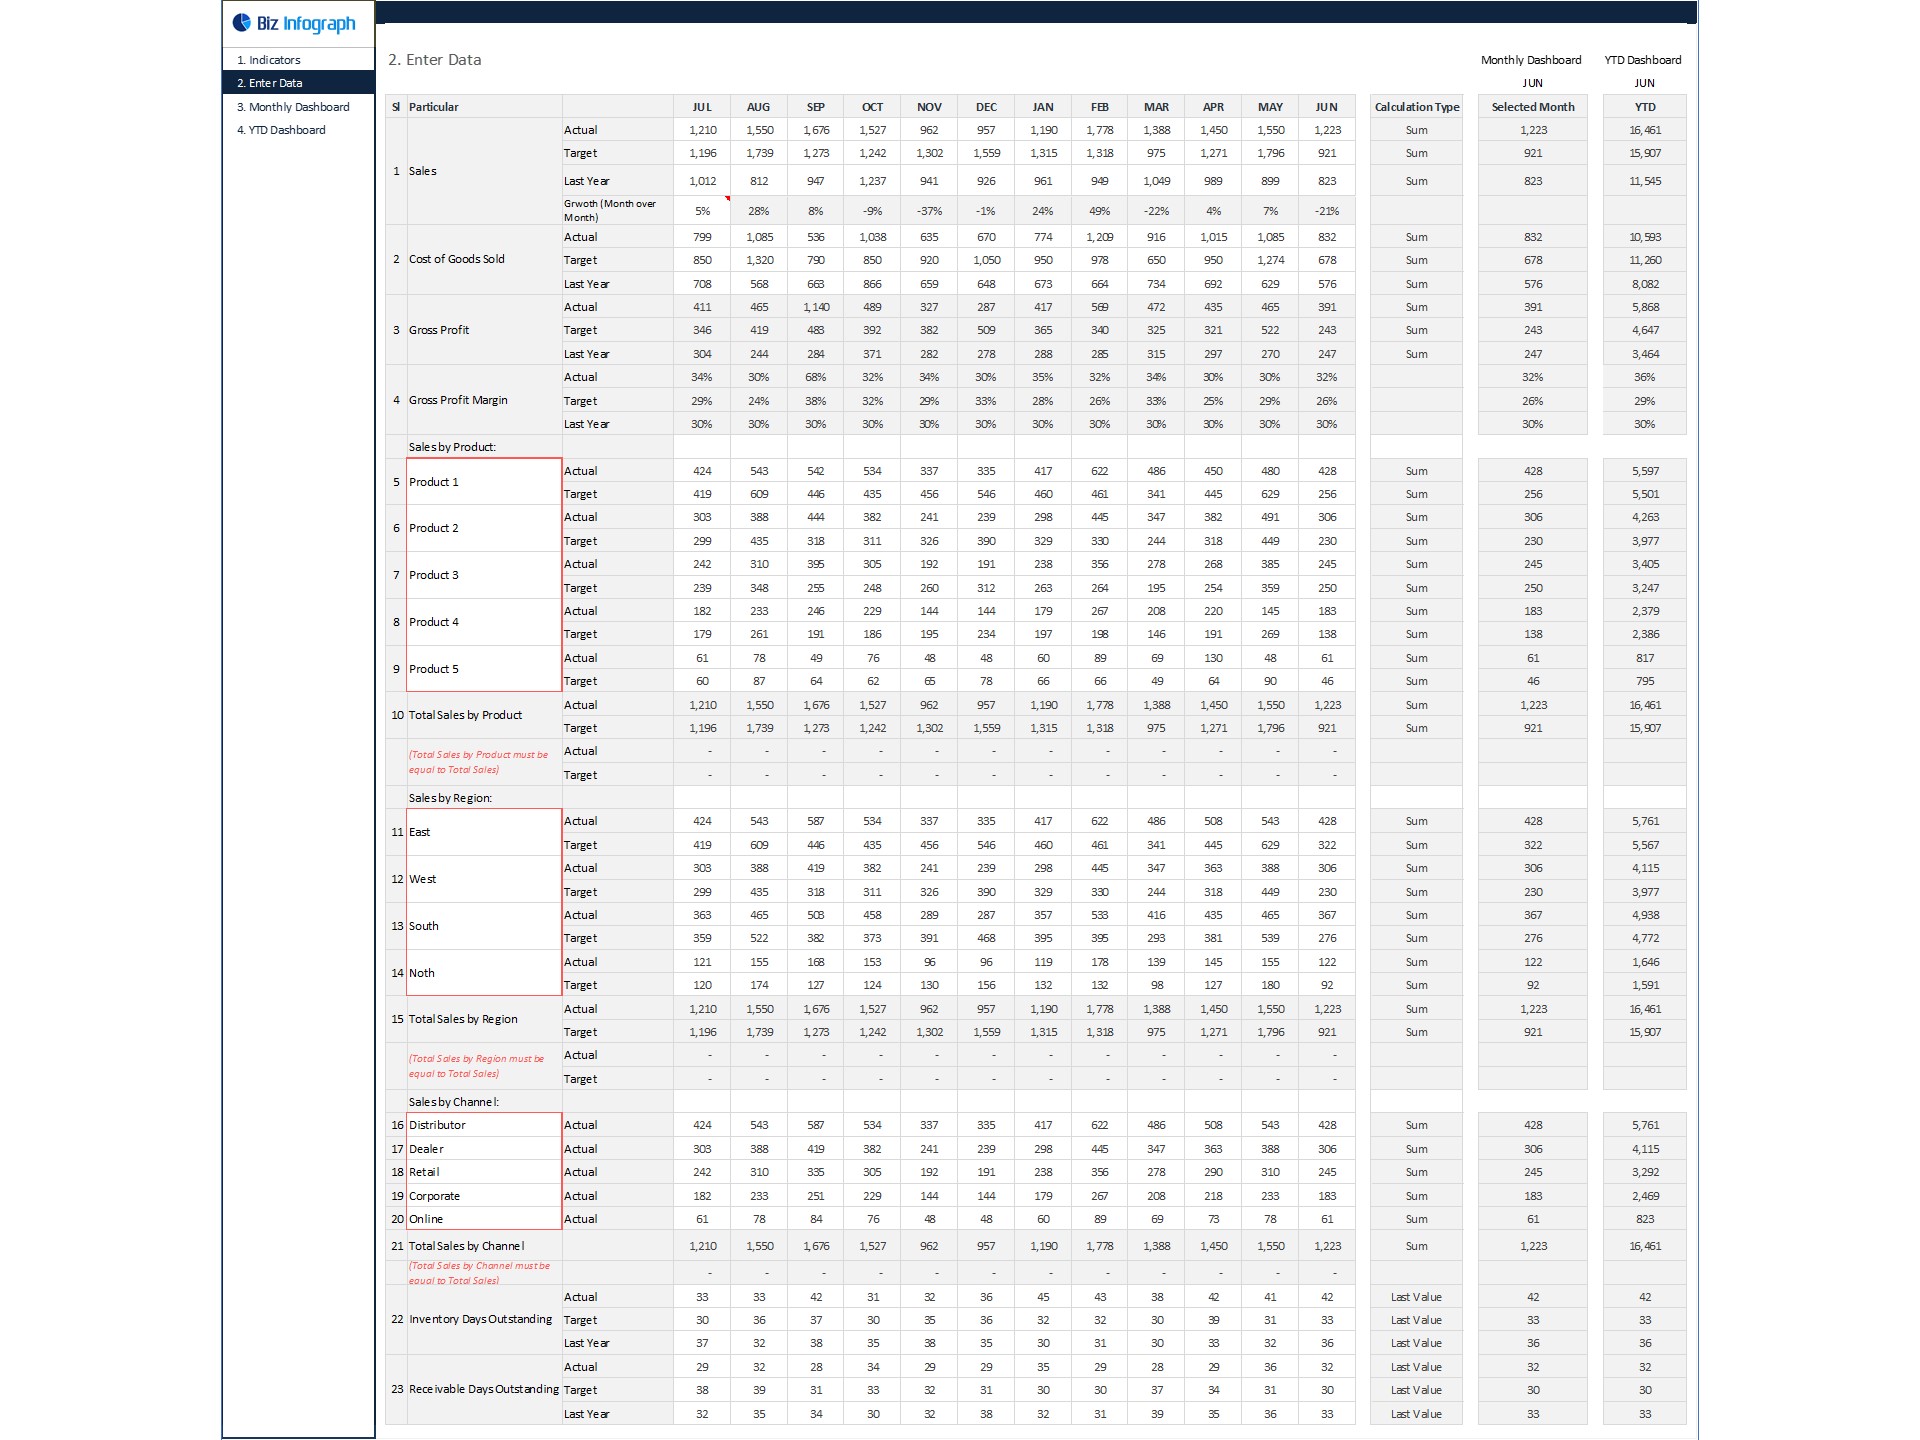
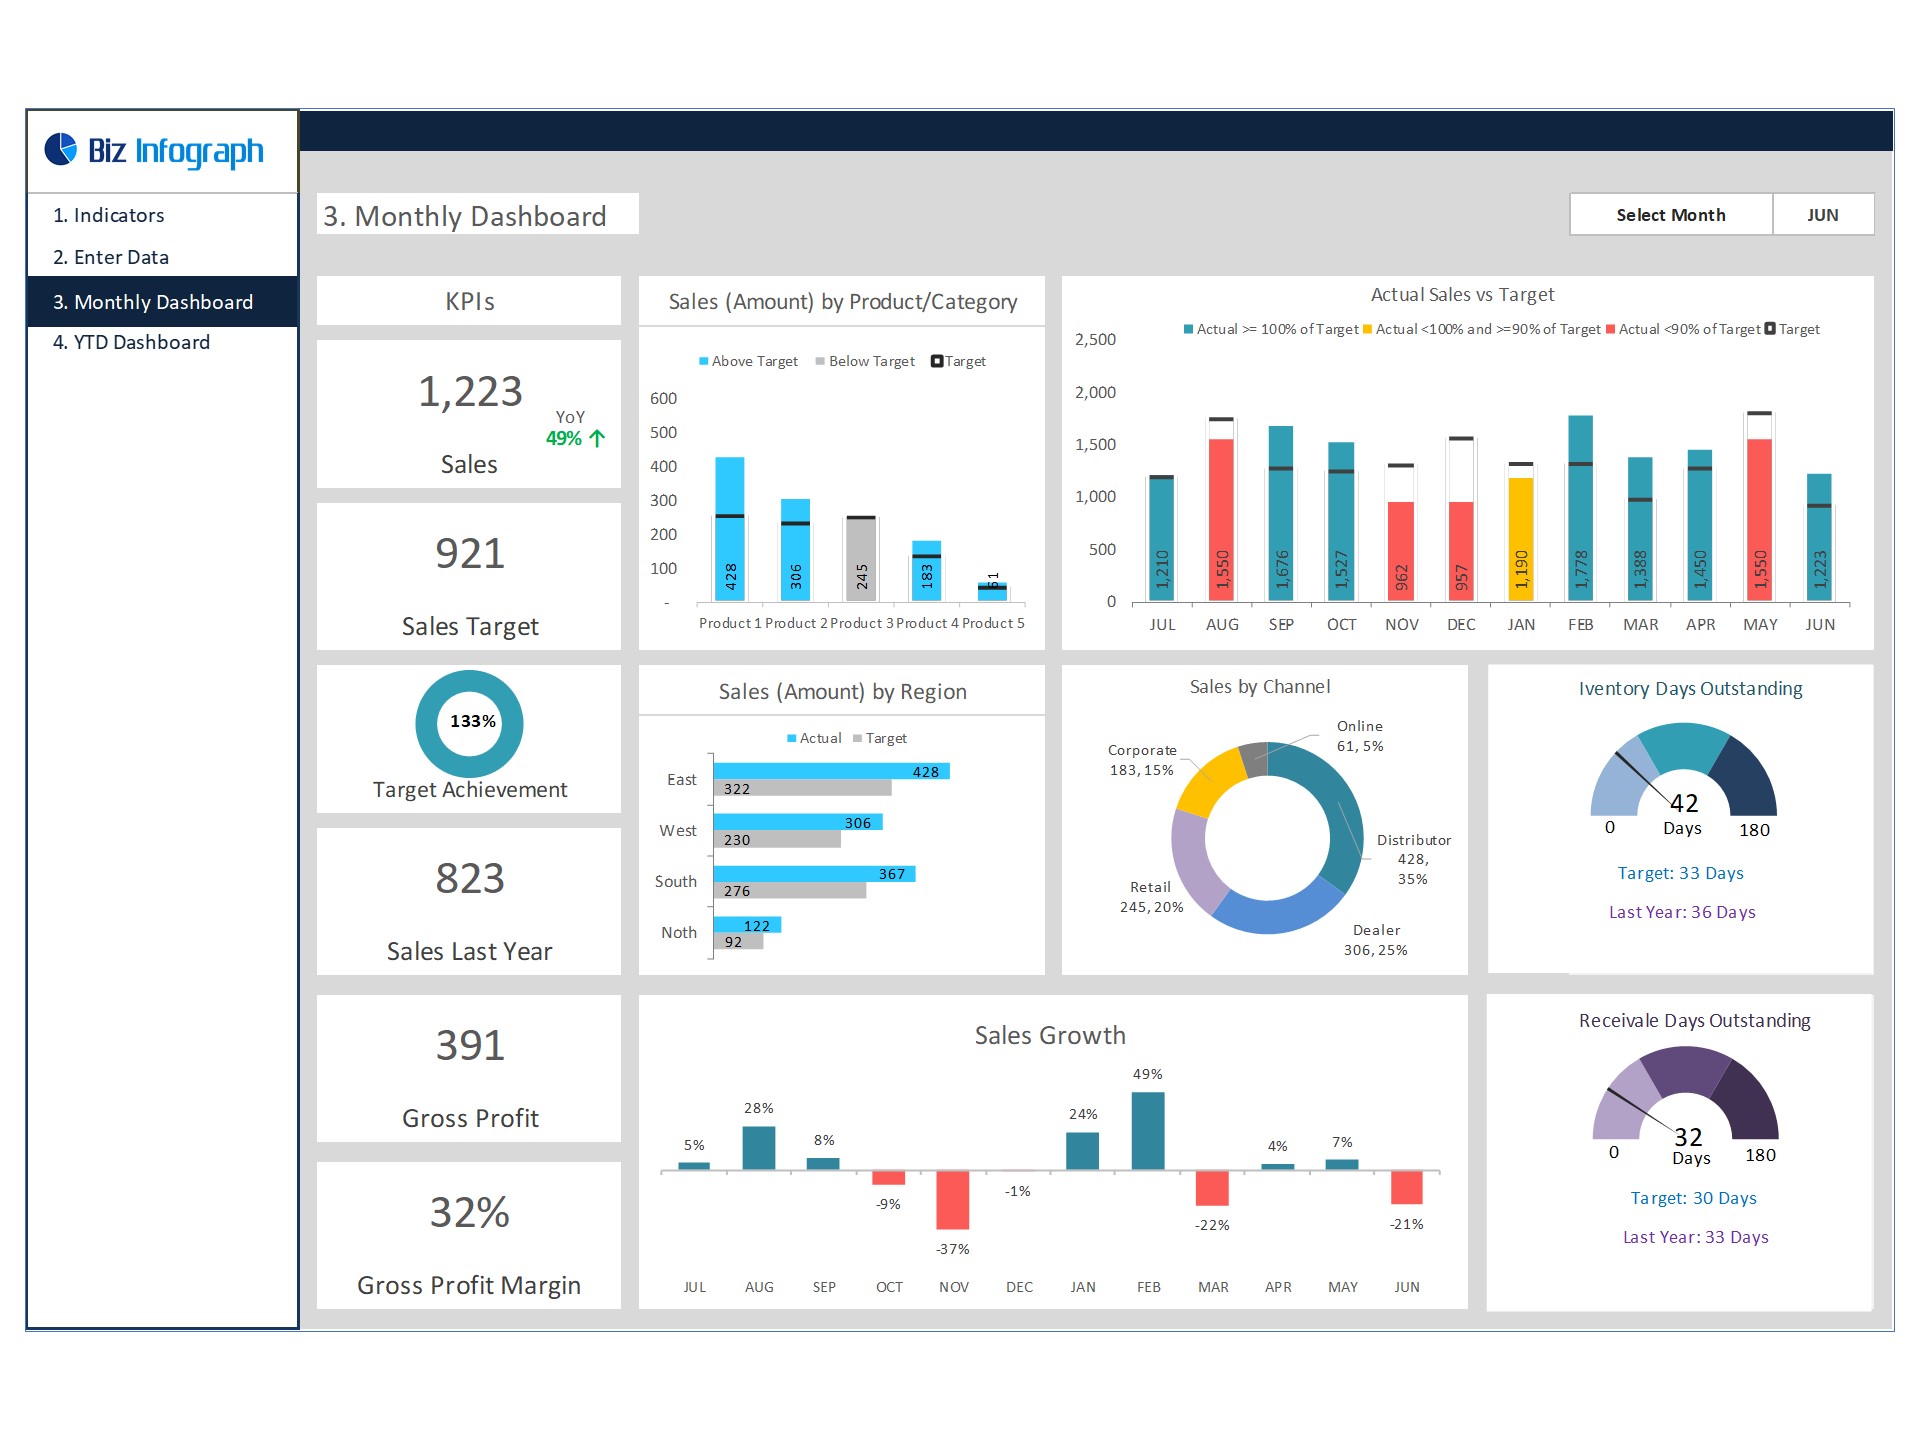
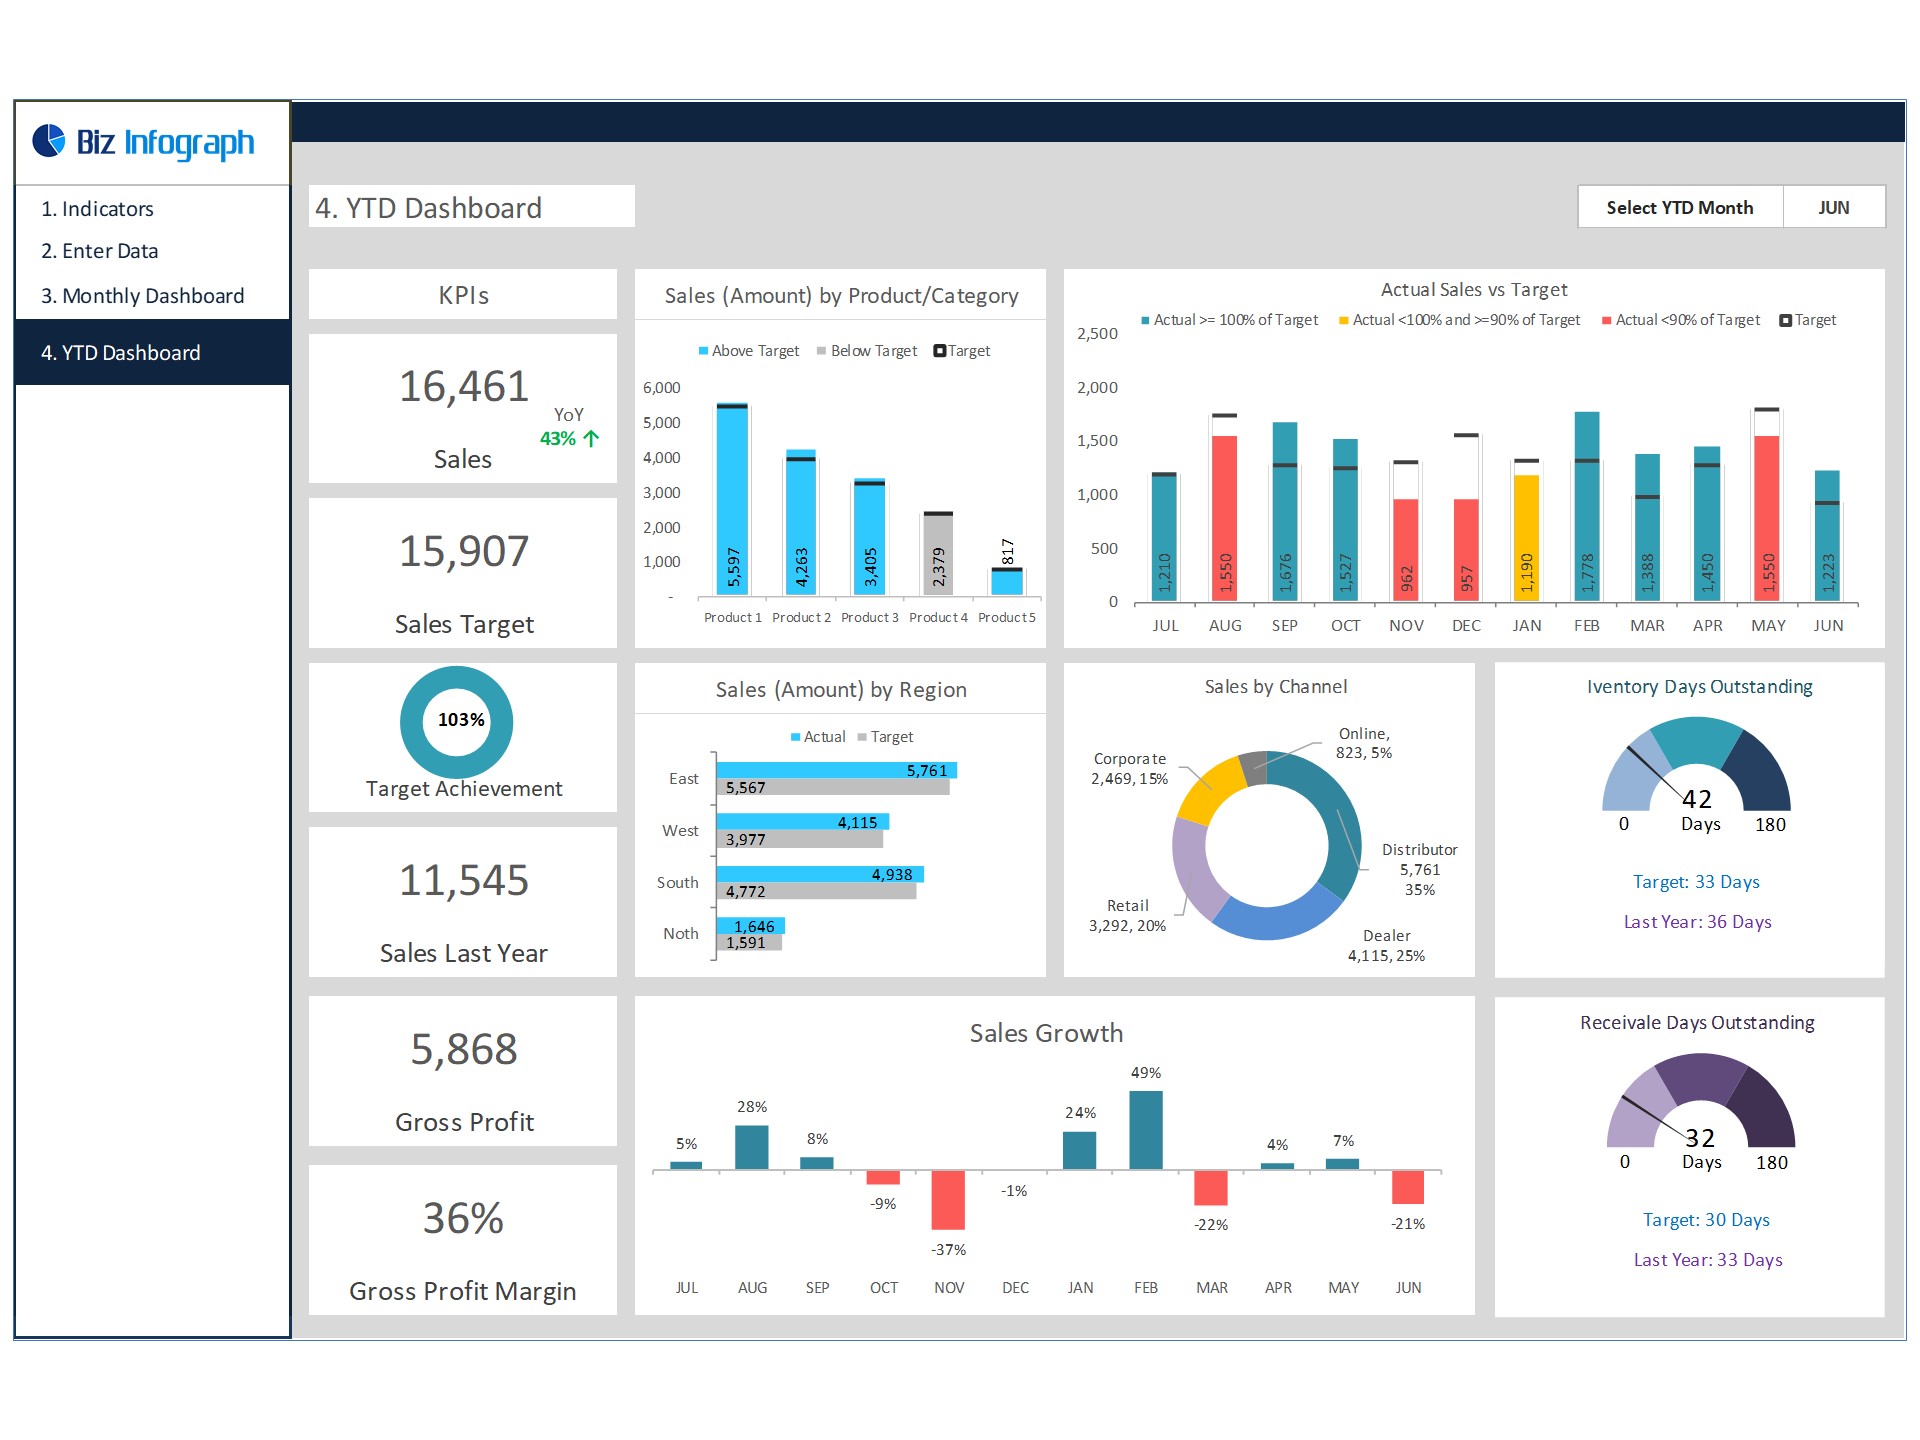
Sales Dashboard - Sales Performance Dashboard
Dynamic, flexible and easy-to-use Sales Dashboard Excel Template
Biz Infograph is bringing clients a range of high-quality, well-designed, and easy-to-use professionally designed slides and dashboards.Follow 10
Further information
Sales analytical dashboard
