Originally published: 26/11/2018 14:01
Publication number: ELQ-99082-1
View all versions & Certificate
Publication number: ELQ-99082-1
View all versions & Certificate

How to Use Normal Distribution | Statistics
Learn everything you need to know about Normal Distribution in Statistics.
- Step n°1 |
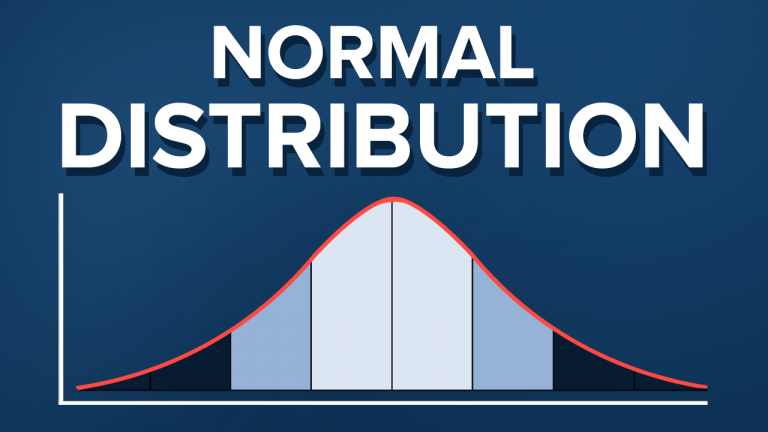
The Normal distribution definition.
You have surely seen a normal distribution before as it is the most common one. The statistical term for it is Gaussian distribution, but many people call it the Bell Curve as it is shaped like a bell. Here is a simple normal distribution definition: it is symmetrical and its mean, median and mode are equal. If you remember the lesson about skewness, you would recognize it has no skew! It is perfectly centered around its mean.
Alright. So, it is denoted in this way. N stands for normal, the tilde sign denotes it is a distribution and in brackets we have the mean and the variance of the distribution. On the plane, you can notice that the highest point is located at the mean, because it coincides with the mode. The spread of the graph is determined by the standard deviation.
Now, you are equipped with the normal distribution definition, but let’s try to understand the normal distribution a little bit better.
Let’s look at this approximately normally distributed histogram. There is a concentration of the observations around the mean, which makes sense as it is equal to the mode. Moreover, it is symmetrical on both sides of the mean.
We used 80 observations to create this histogram. Its mean is 743 and its standard deviation is 140.
Okay, great!
