

Originally published: 08/11/2019 09:21
Last version published: 23/11/2020 08:20
Publication number: ELQ-19904-2
View all versions & Certificate
Last version published: 23/11/2020 08:20
Publication number: ELQ-19904-2
View all versions & Certificate

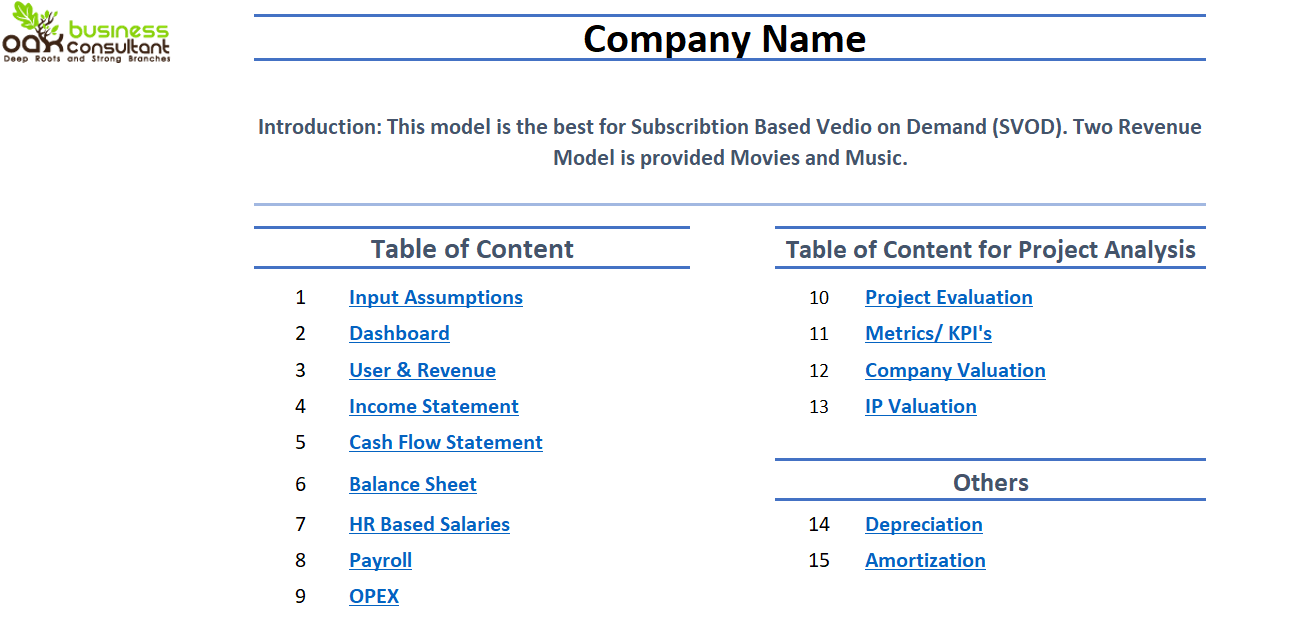
Financial Model for SVOD (Subscription Video on Demand) Business
Financial Model specially designed for Business Model (SVOD) like NETFLIX having Monthly and 5 Years projections.
Our mission is to be the industrial leader and pioneer in our business domainFollow 17
financial model fro svodsvodsubscriptionfinancial analysisincome statemententertainmentinvestmentcacnetflix
Description
In this Financial Model, we have detailed Monthly and 5 years:
1. User Acquisition (2 Revenue Streamlines)
2. Dashboard
3. Operating Expenses Analysis
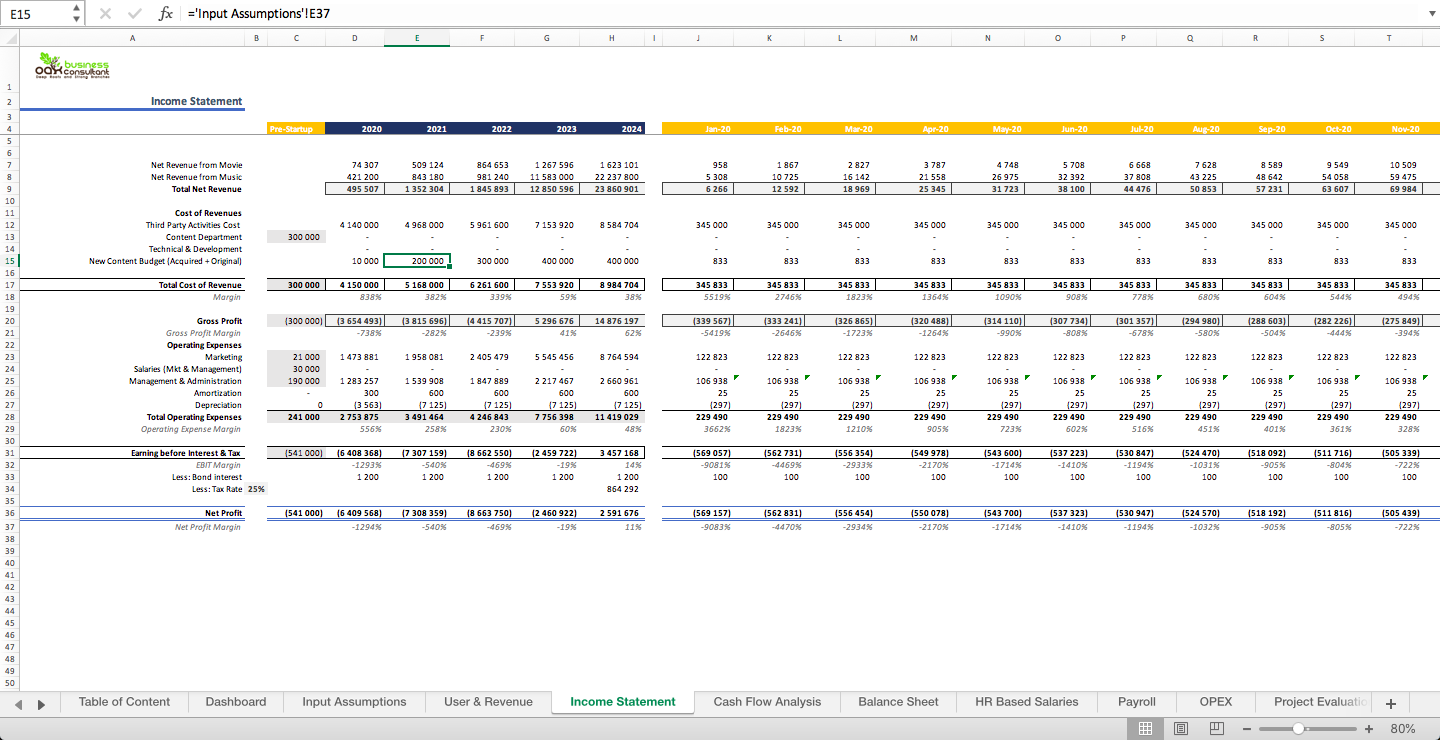
4. Projected Income Statement - Monthly and yearly for 5 Years
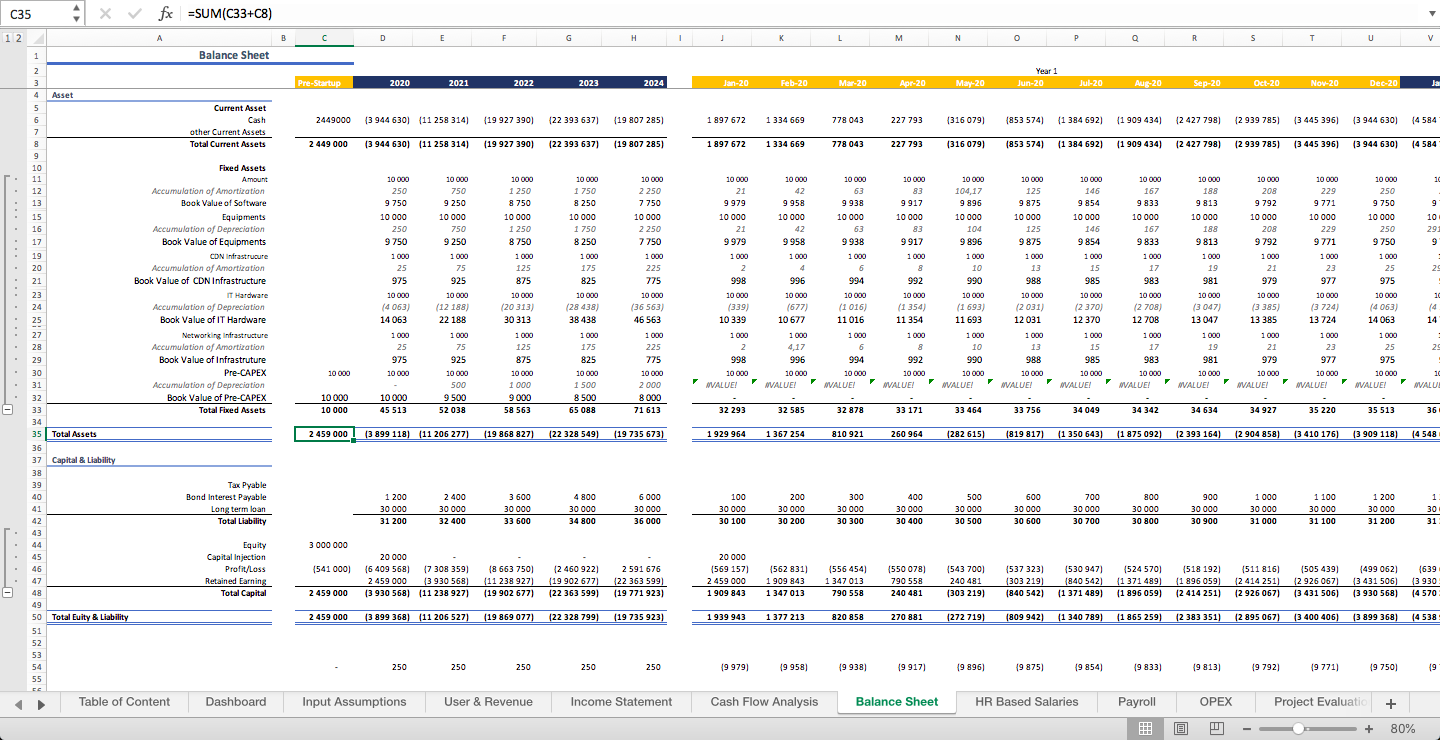
5. Projected Balance sheet Statement -Monthly & Yearly for 5 Years
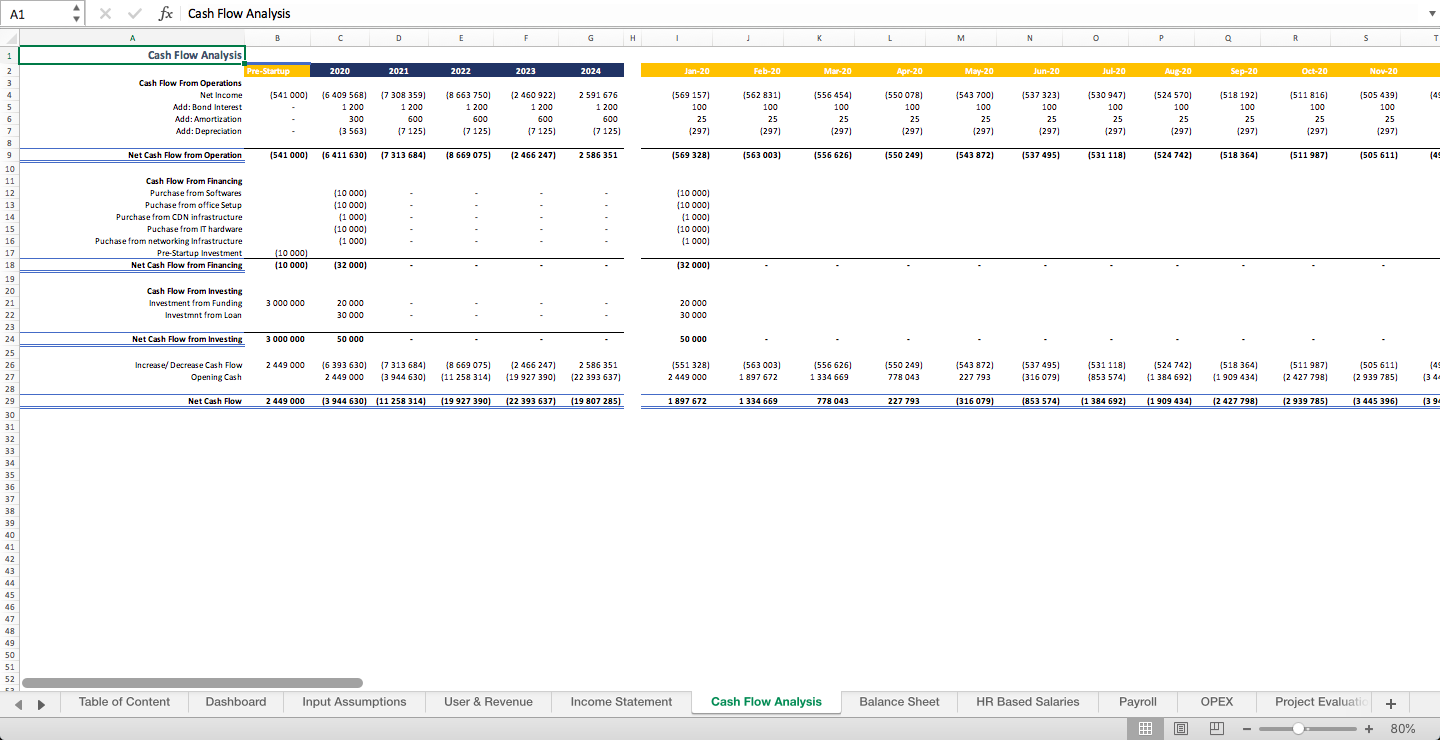
6. Projected Cash Flow Statement - Monthly & Yearly for 5 Years
7. Project ROI, NPV and Investment Required Analysis
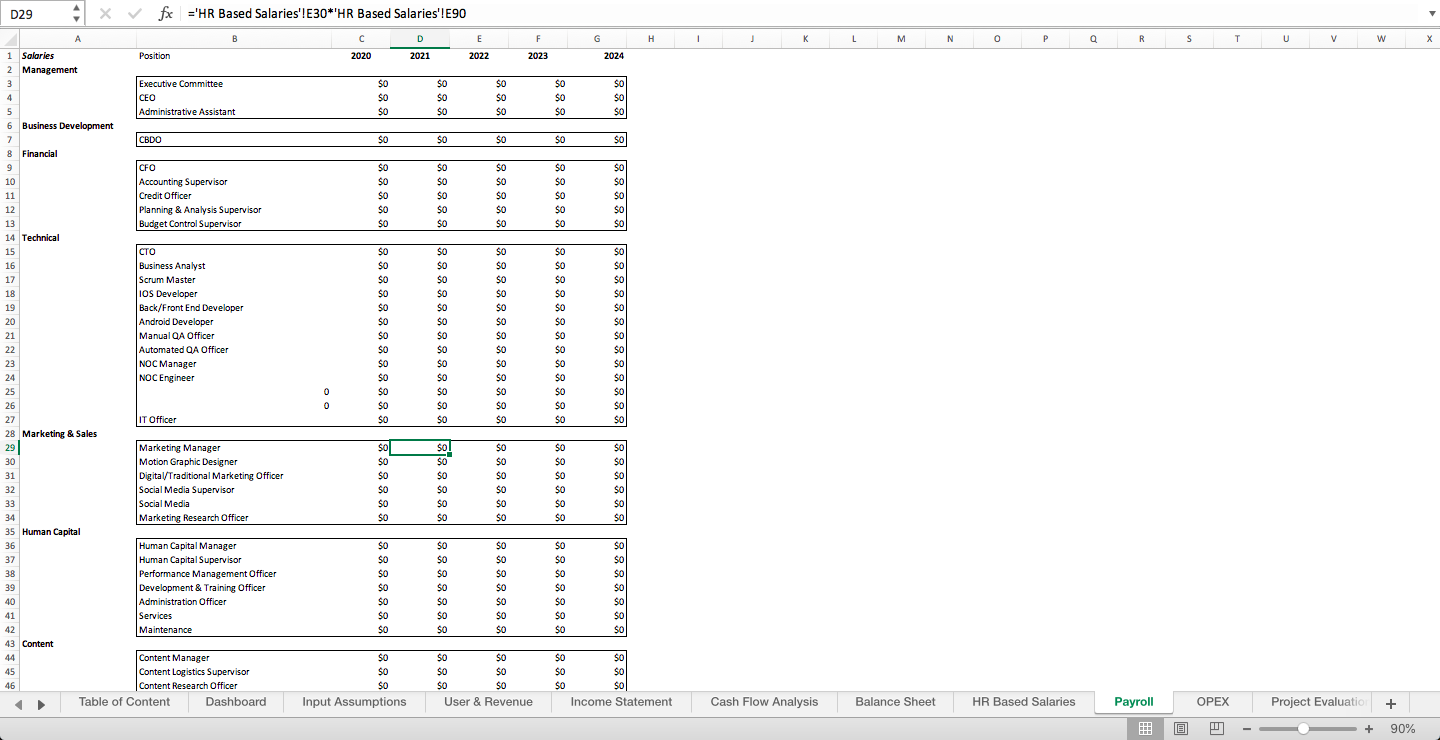
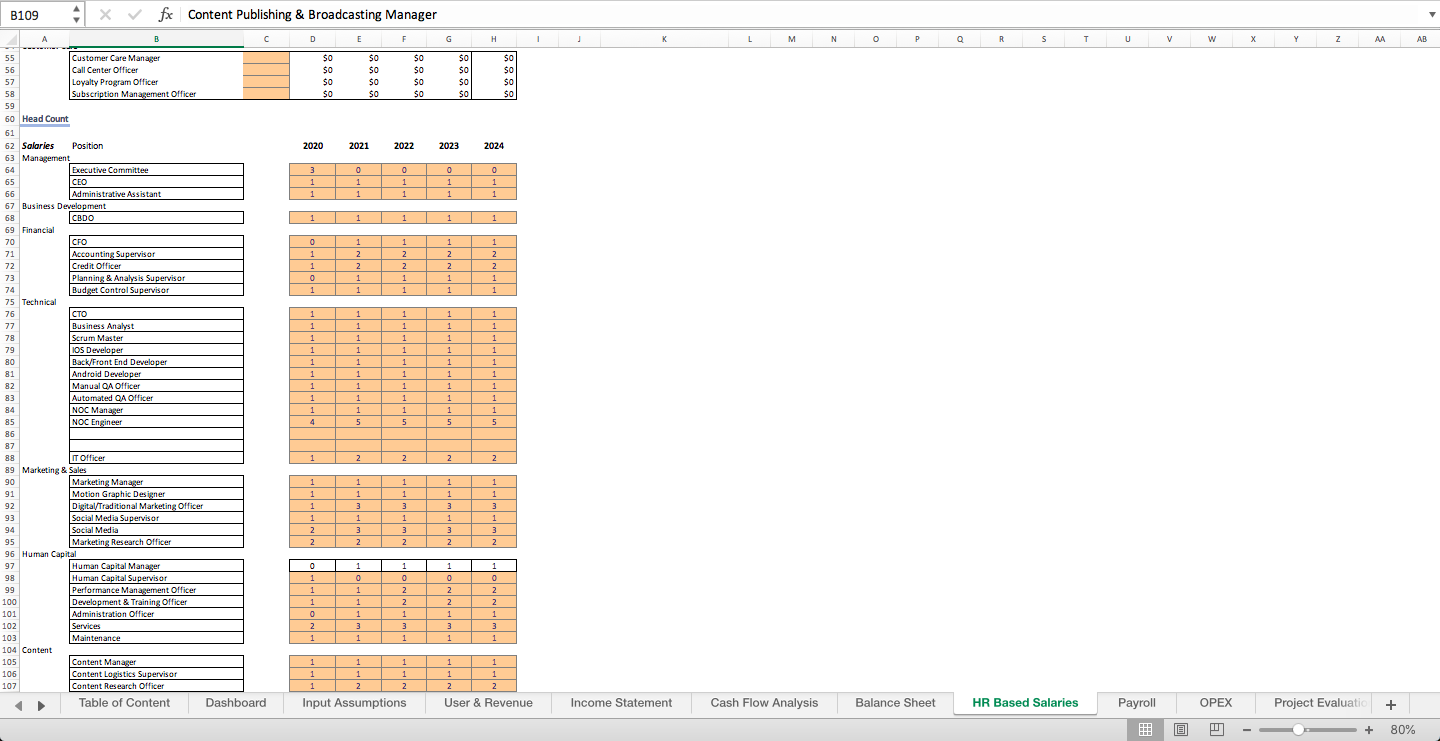
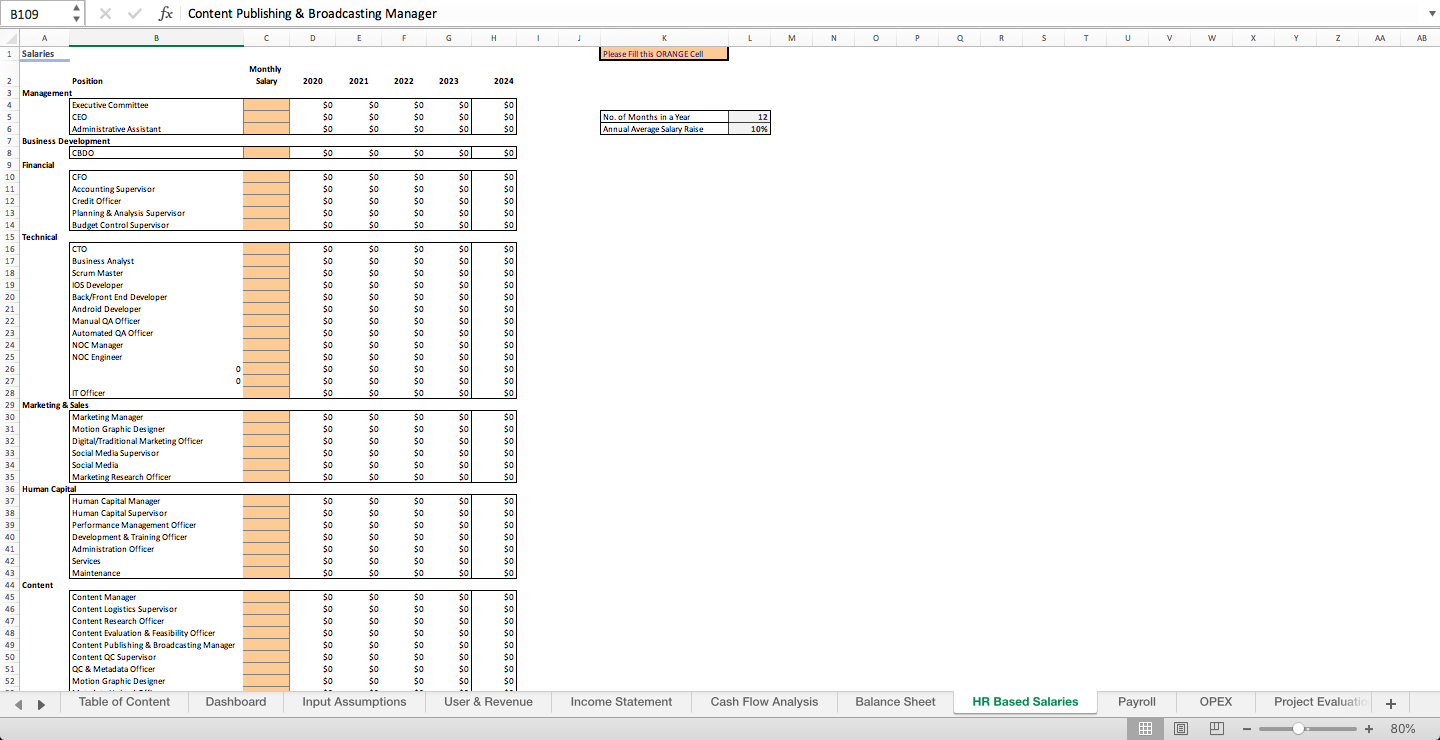
8. Payroll Headcounts
9. Payroll Expenses details
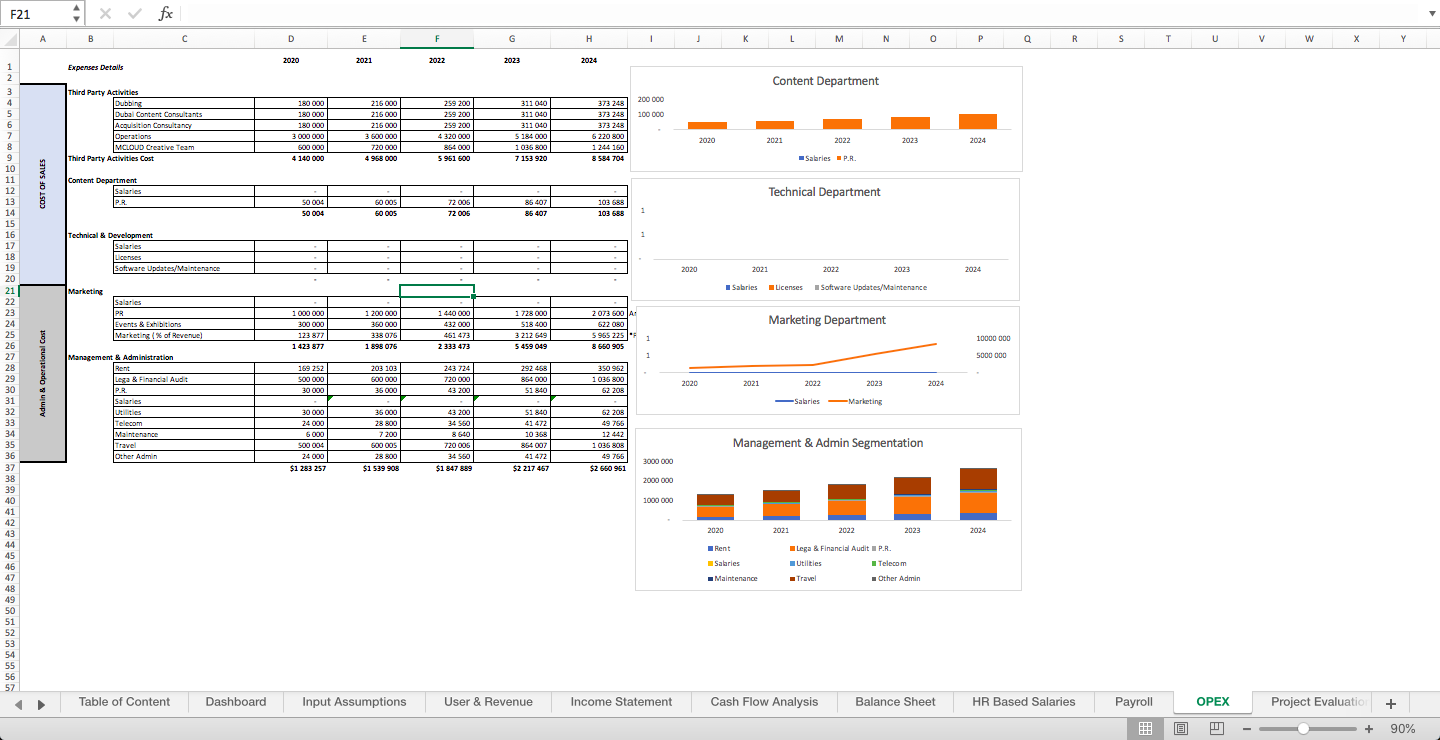
10. Operating Expenses Details - Monthly & Yearly for 5 years
11. Depreciation - Monthly & yearly for 5 Years
12. Amortization
13. Key Metrics such as CAC, CLV, Profitability Analysis
How to use it;
Only ORANGE Cells are the INPUT AREA in the whole Financial Model.
The following are the explanations of the tool, how this model has built and how you can use it to get the rationale for the business.
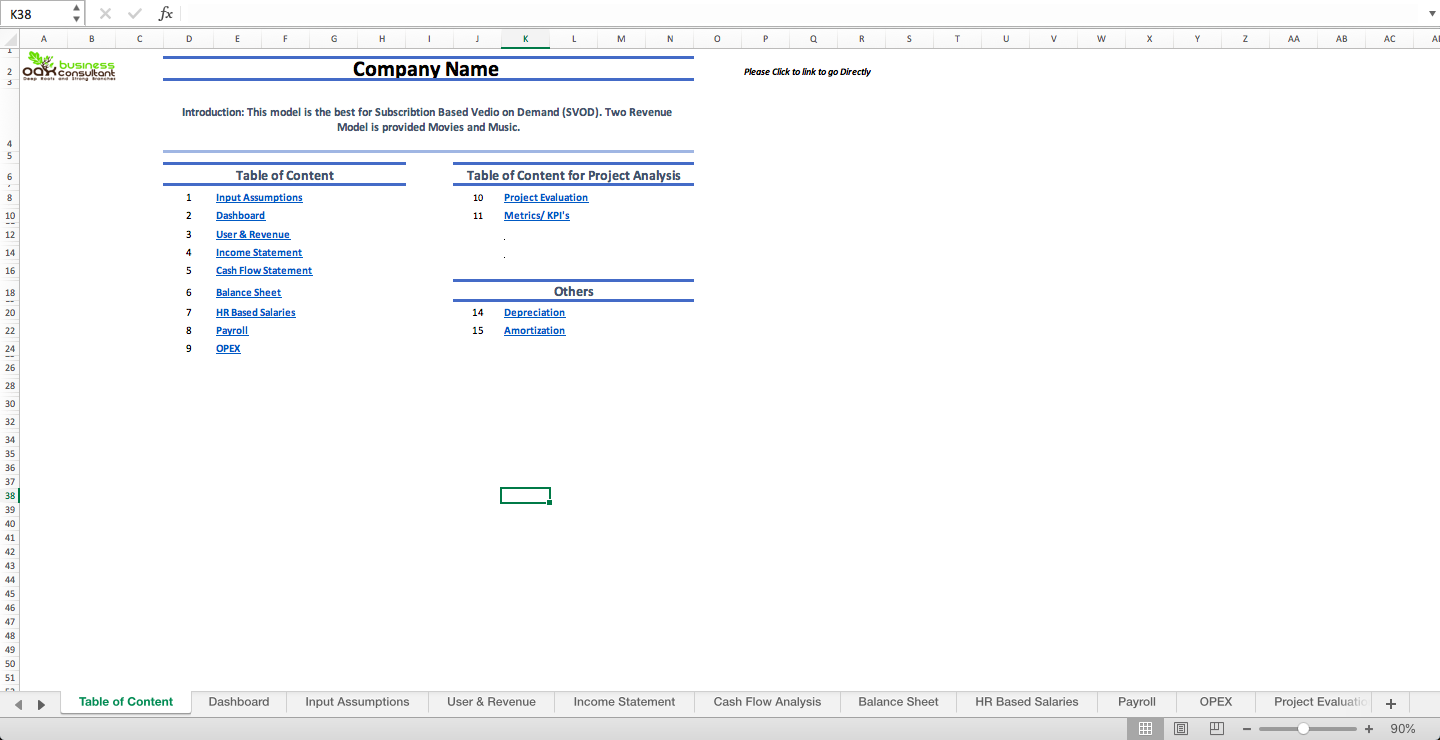
The financial tool starts with the table of content sheet, where you will have the file name and details of the tool.
If you want to go to any specific sheet directly, you just have to click on the content, and it will redirect you to that sheet; however, the actual model starts with an input sheet, or you can say, the input sheet is the main sheet among all sheets. We called it an input sheet, because all data that you have, you enter in a sheet in multiple areas of the tool.
However, in this tool, all variables will be included in an input sheet. It is easy to use because you can change all the variables in a single sheet instead of having to go to every sheet and changing the variable to analyze it further.
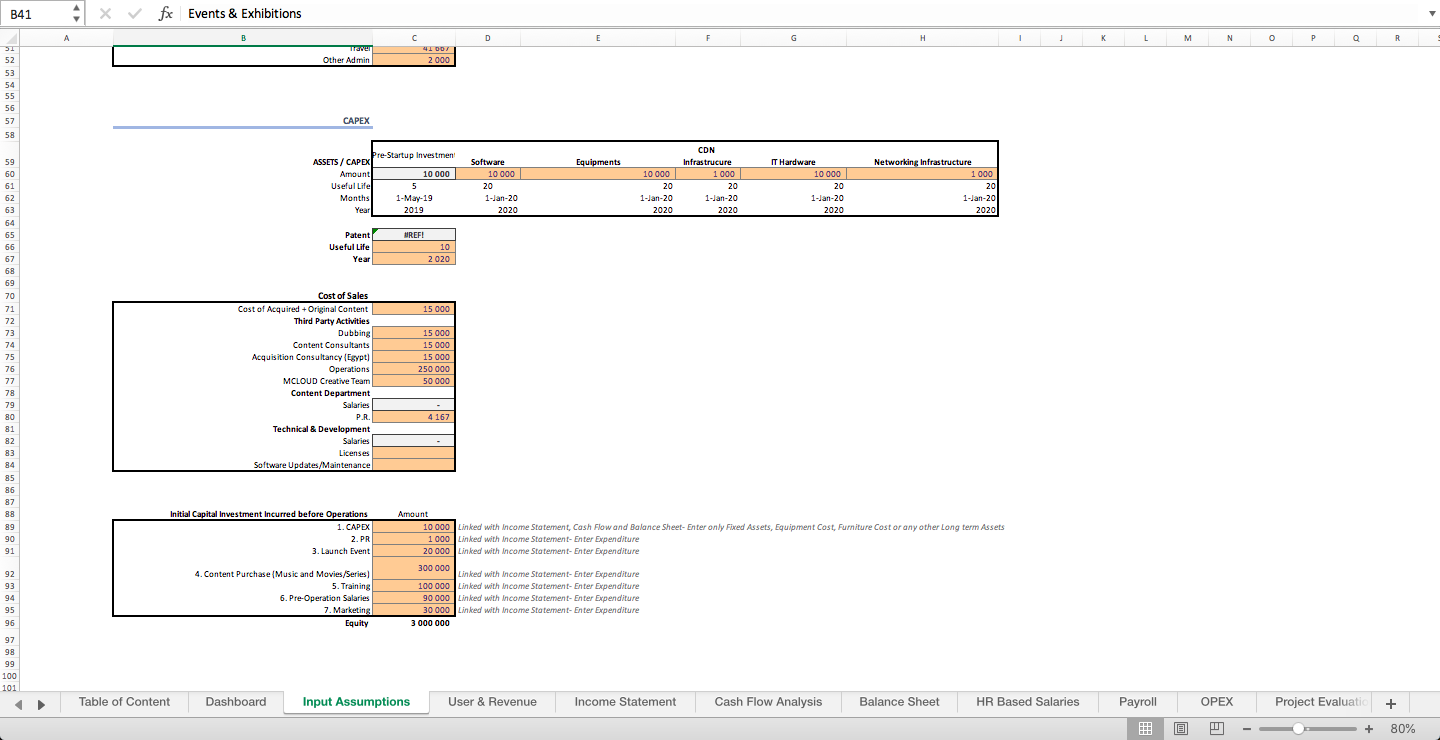
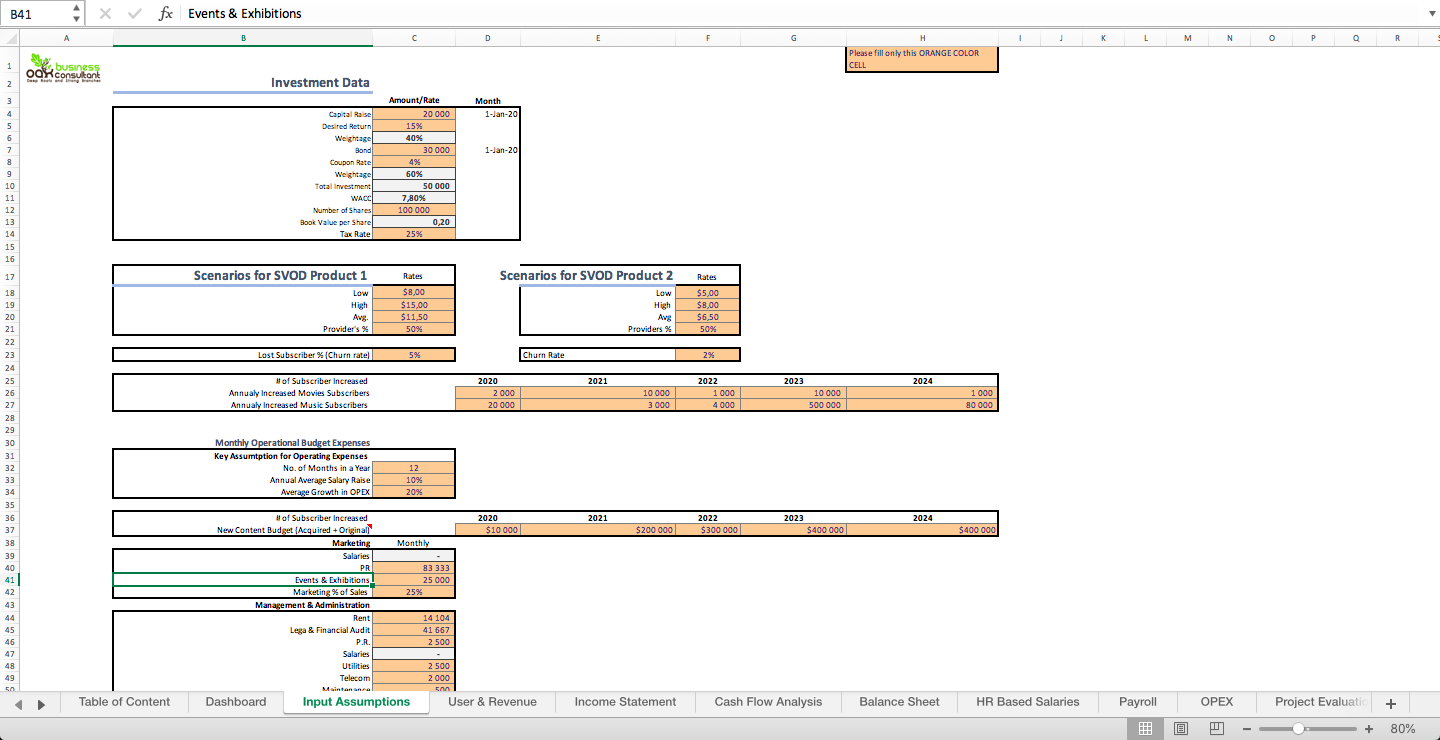
INPUT SHEET: In the input, you will find all the variables like Investments, months of investment, CapEx, OpeEx (marketing, utilities, etc.) and payrolls. You just need to change the input cell (which is in a brown cell), and the whole model will get the update instantly.
The next sheet would be the
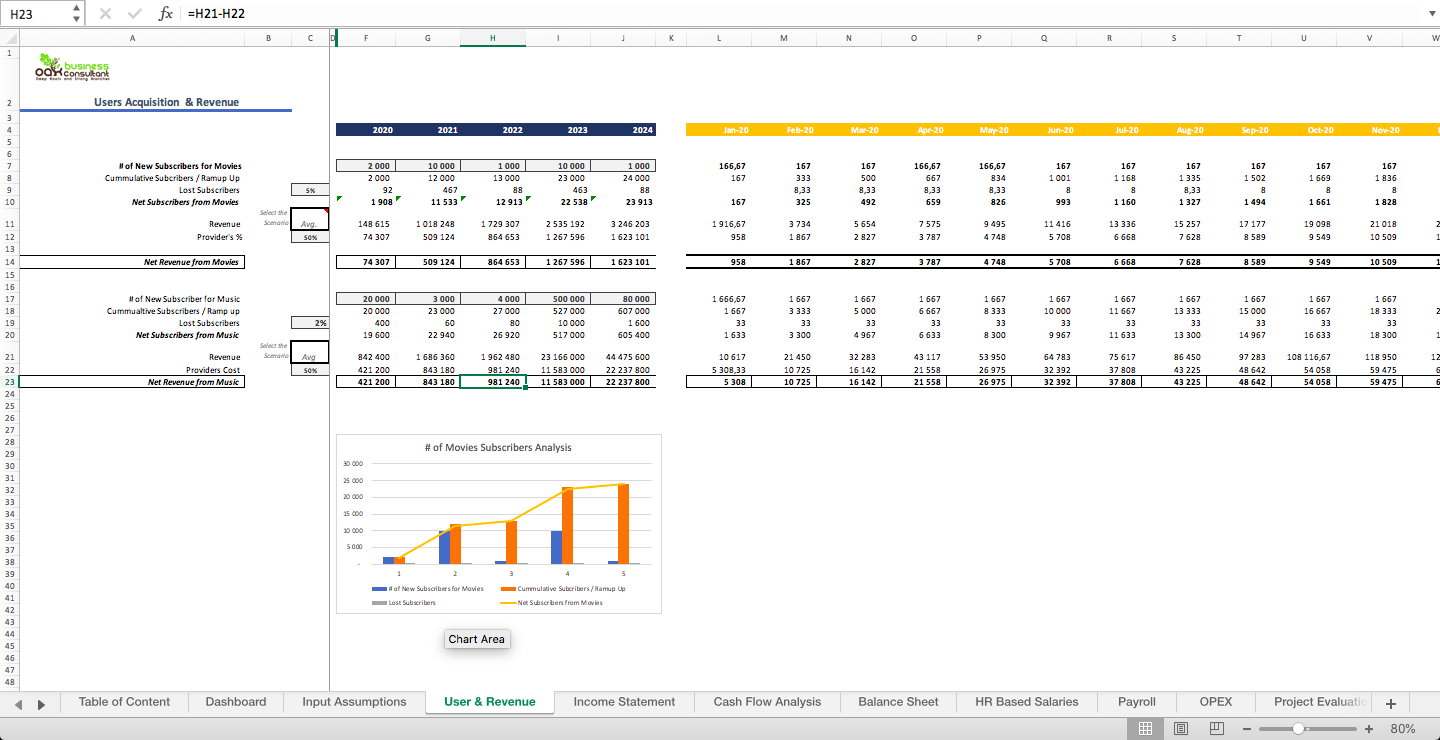
User Acquisition Sheet and
Revenue sheet.
There are 2 revenue channels, through which you can earn money. Furthermore, you can also use both revenue channels and can customize according to your revenue head. If you have only 1 revenue channel, you can leave the second revenue channel empty. In the same sheet, you will see a new and cumulative customer’s subscribers, then you can see a price, which is directly linked with the input sheet. Finally, you will have revenue in the tab. This flow would be the same for both the revenue channels.
Then you will find
- the Income Statements,
- Cash Flow Statements and
- Balance Sheet separately.
The best part of this model is that the number of months reflected in the input sheet will automatically update the number of the month on the cash flow and balance sheet. You don’t need to change it on your own.
- Income Statement is linked with the User Acquisition and Revenue sheet, whereas COGS and Opex is directly linked with input sheet and HR based salaries.
- The cash flow statement consists of three parts,
Cash flow from operations,
Investing and
Financing.
All 3 sections are linked with the Income Statement and Input Sheet, and the same happens with the balance sheet.
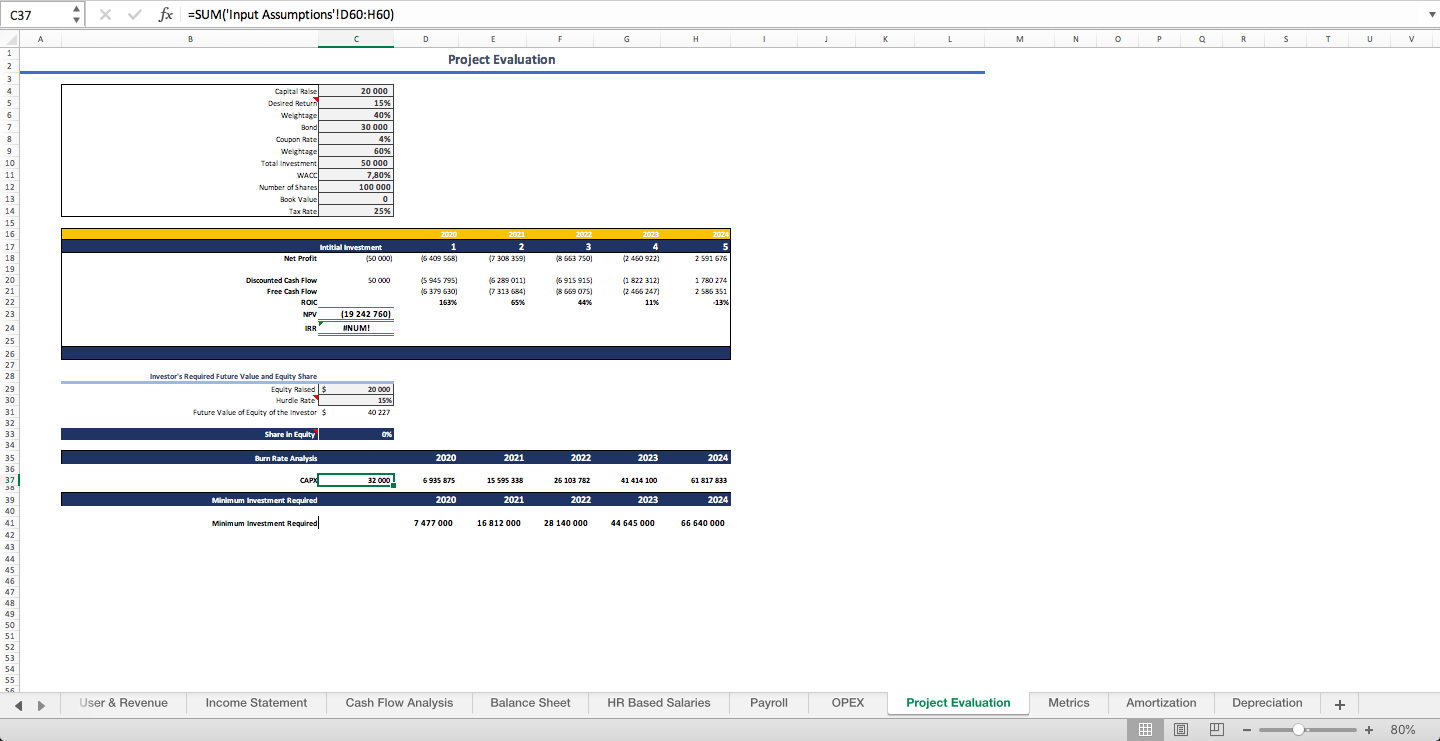
- Project Evaluation Sheet:
Then the most important tools are the project evaluation, to whom we have created a long 3 Statement financial model. We analysis the forecasted future income and discount back it to with the rate that you will put in the tools. Then the tool will automatically generate
- the NPV,
- IRR Free Cash Flow to analyze the feasibility of the project.
If NPV is positive, that means the project is feasible. Not only we have analyzed the NPV etc., but also we have analyzed the equity that entrepreneurs should give away with investors according to investment and future earnings.
Moreover, we have provided
- the Burn Rate Analysis and
- Minimum Investment.
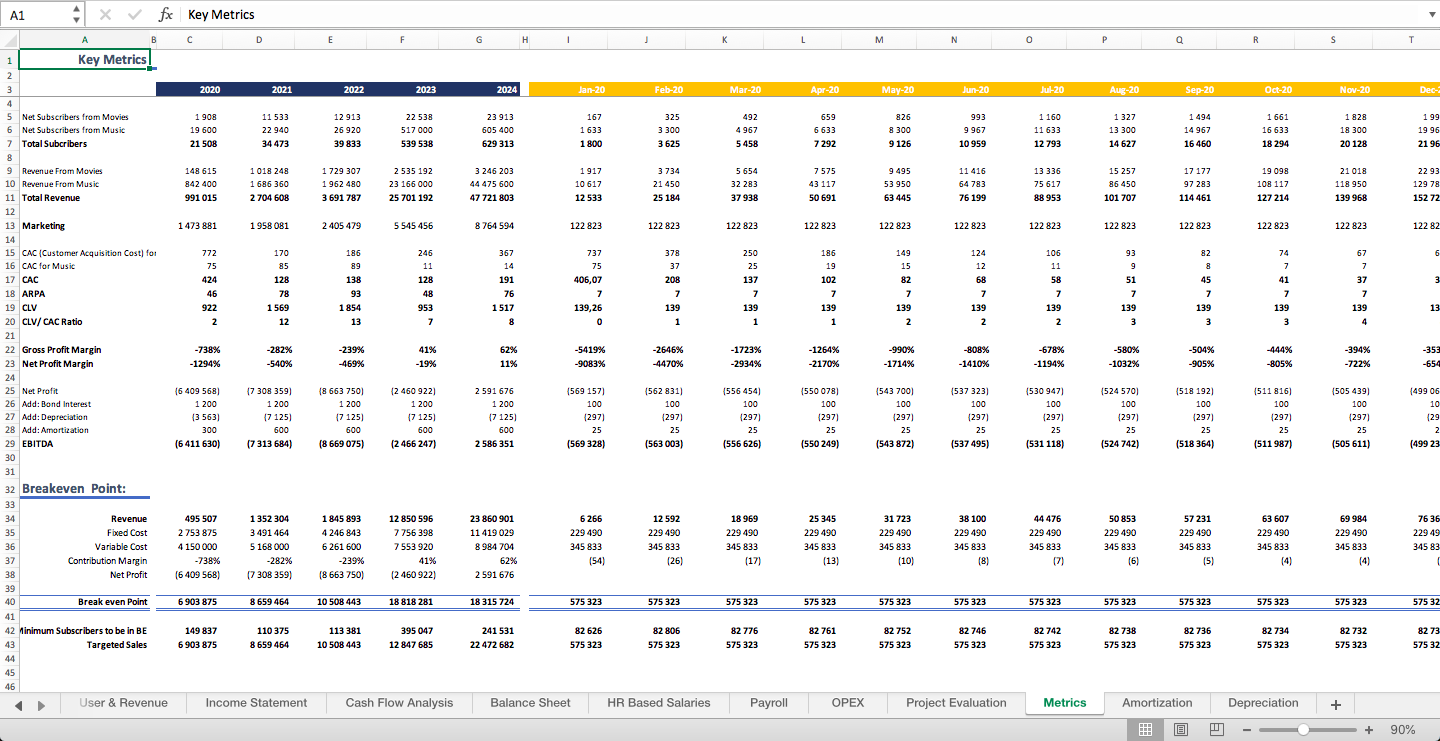
After that, we need to analyze
- the Operational performance of the project.
In this sheet, you will have
- Breakeven Analysis,
- Minimum Subscribers to be B.E,
- Target Sales.
Along with that, we have
- Cost of Customer Acquisitions,
- Average Revenue per Customers and
- Customer Life Time Value.
These metrics are very important for marketing and operational analysis.
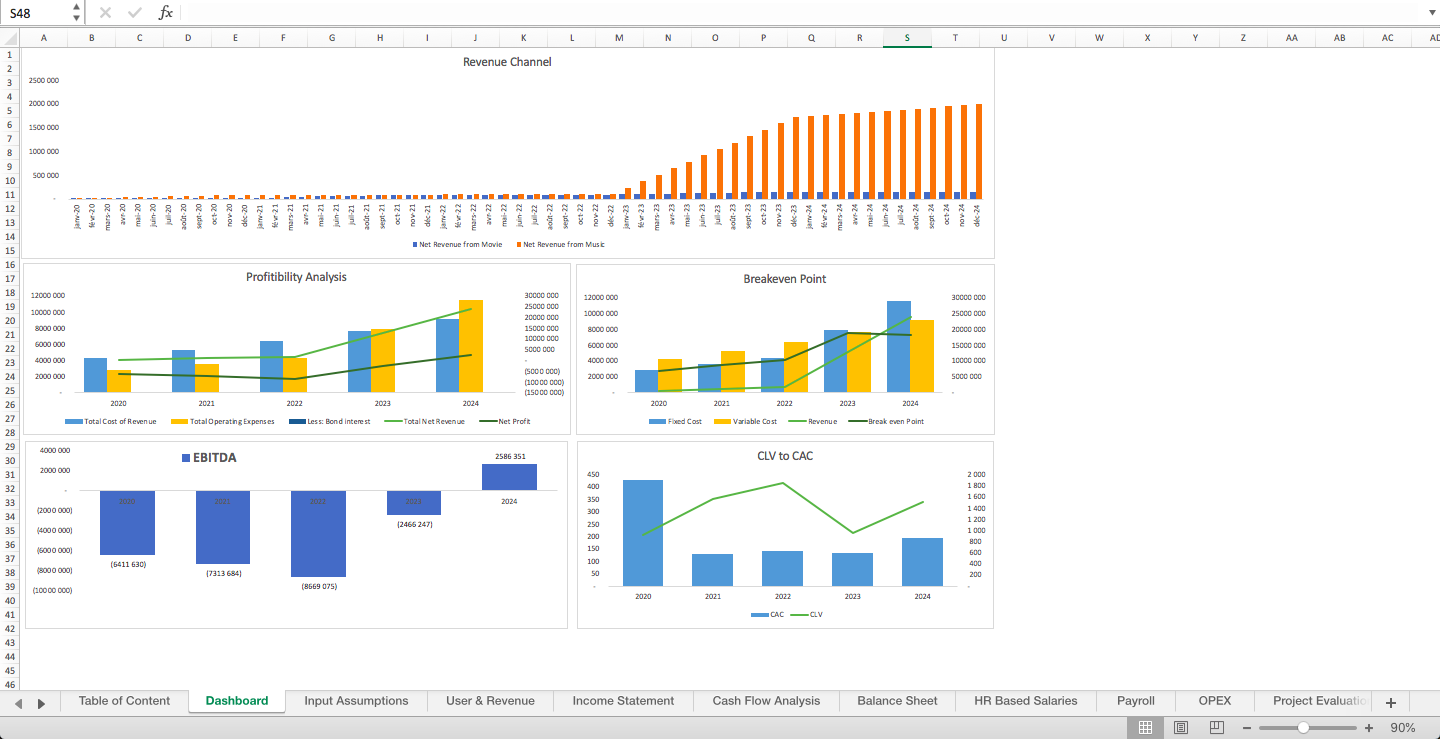
-Dashboard
The most important tool for any Financial Model is the Dashboard, which is the graphical representation of the project. Either you are an investor or entrepreneur, you would always want to see the graphical representation of the business, which can help you analyze the business and help in decision making.
In the Dashboard, we have
- Profitability Graphs,
- EBITDA,
- Cash Flow, and
- Breakeven,
- Revenue Contribution and
- CAC and CLV graphs.
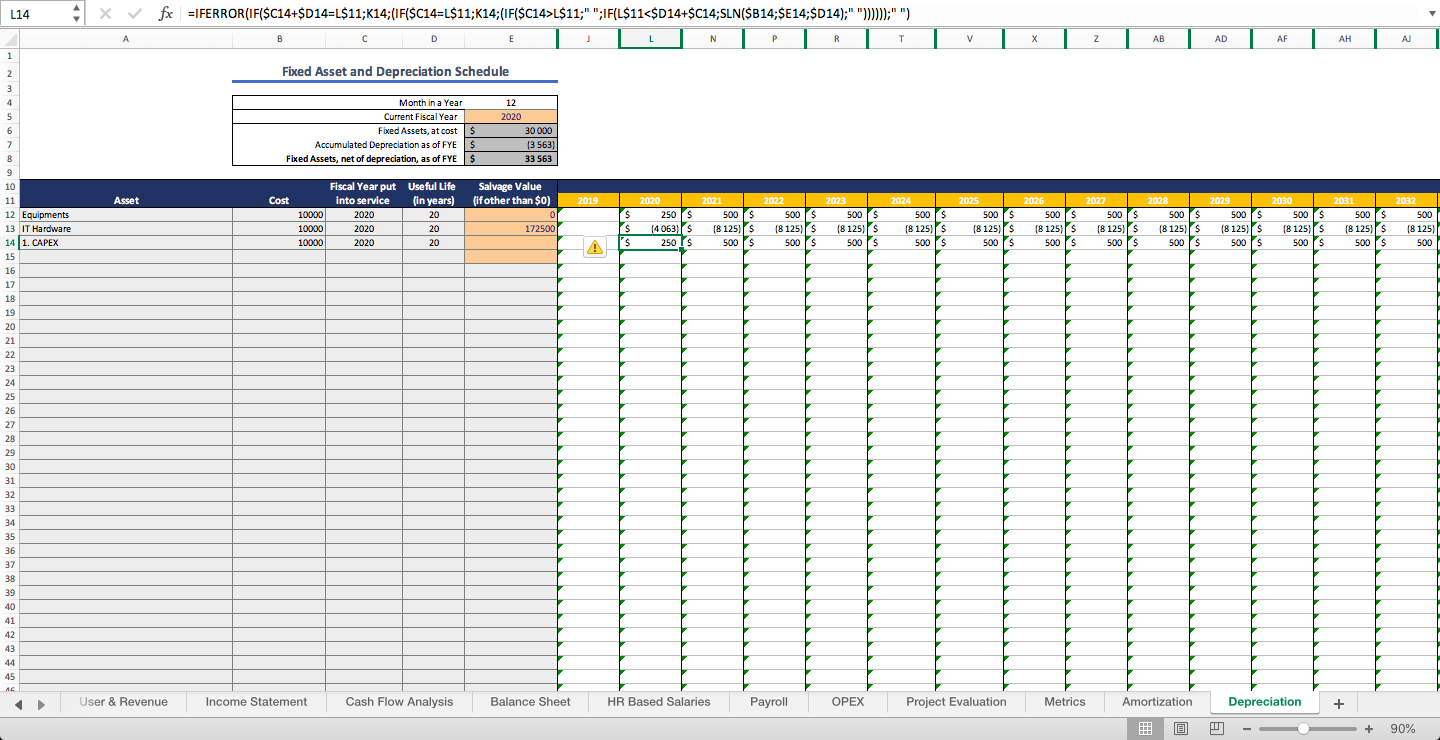
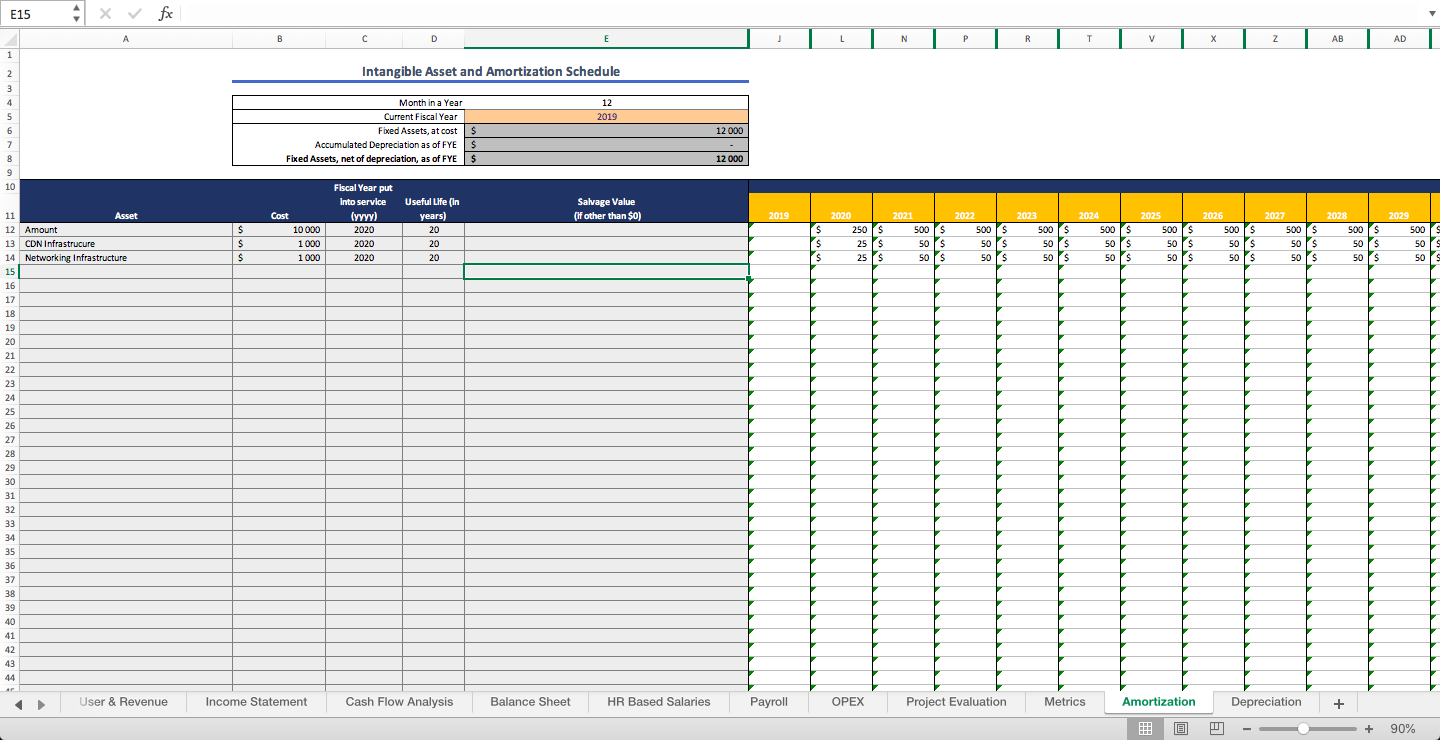
Last but not least, we have a sheet of
- Depreciation and
- Amortizations,
which is linked with the input sheet and Income Statements.
Along with that, we have
- HR bases Salaries,
- Payroll and
- Opex
to calculate the operational expenses separately then linked with the Income Statement.
In this Financial Model, we have detailed Monthly and 5 years:
1. User Acquisition (2 Revenue Streamlines)
2. Dashboard
3. Operating Expenses Analysis
4. Projected Income Statement - Monthly and yearly for 5 Years
5. Projected Balance sheet Statement -Monthly & Yearly for 5 Years
6. Projected Cash Flow Statement - Monthly & Yearly for 5 Years
7. Project ROI, NPV and Investment Required Analysis
8. Payroll Headcounts
9. Payroll Expenses details
10. Operating Expenses Details - Monthly & Yearly for 5 years
11. Depreciation - Monthly & yearly for 5 Years
12. Amortization
13. Key Metrics such as CAC, CLV, Profitability Analysis
How to use it;
Only ORANGE Cells are the INPUT AREA in the whole Financial Model.
The following are the explanations of the tool, how this model has built and how you can use it to get the rationale for the business.
The financial tool starts with the table of content sheet, where you will have the file name and details of the tool.
If you want to go to any specific sheet directly, you just have to click on the content, and it will redirect you to that sheet; however, the actual model starts with an input sheet, or you can say, the input sheet is the main sheet among all sheets. We called it an input sheet, because all data that you have, you enter in a sheet in multiple areas of the tool.
However, in this tool, all variables will be included in an input sheet. It is easy to use because you can change all the variables in a single sheet instead of having to go to every sheet and changing the variable to analyze it further.
INPUT SHEET: In the input, you will find all the variables like Investments, months of investment, CapEx, OpeEx (marketing, utilities, etc.) and payrolls. You just need to change the input cell (which is in a brown cell), and the whole model will get the update instantly.
The next sheet would be the
User Acquisition Sheet and
Revenue sheet.
There are 2 revenue channels, through which you can earn money. Furthermore, you can also use both revenue channels and can customize according to your revenue head. If you have only 1 revenue channel, you can leave the second revenue channel empty. In the same sheet, you will see a new and cumulative customer’s subscribers, then you can see a price, which is directly linked with the input sheet. Finally, you will have revenue in the tab. This flow would be the same for both the revenue channels.
Then you will find
- the Income Statements,
- Cash Flow Statements and
- Balance Sheet separately.
The best part of this model is that the number of months reflected in the input sheet will automatically update the number of the month on the cash flow and balance sheet. You don’t need to change it on your own.
- Income Statement is linked with the User Acquisition and Revenue sheet, whereas COGS and Opex is directly linked with input sheet and HR based salaries.
- The cash flow statement consists of three parts,
Cash flow from operations,
Investing and
Financing.
All 3 sections are linked with the Income Statement and Input Sheet, and the same happens with the balance sheet.
- Project Evaluation Sheet:
Then the most important tools are the project evaluation, to whom we have created a long 3 Statement financial model. We analysis the forecasted future income and discount back it to with the rate that you will put in the tools. Then the tool will automatically generate
- the NPV,
- IRR Free Cash Flow to analyze the feasibility of the project.
If NPV is positive, that means the project is feasible. Not only we have analyzed the NPV etc., but also we have analyzed the equity that entrepreneurs should give away with investors according to investment and future earnings.
Moreover, we have provided
- the Burn Rate Analysis and
- Minimum Investment.
After that, we need to analyze
- the Operational performance of the project.
In this sheet, you will have
- Breakeven Analysis,
- Minimum Subscribers to be B.E,
- Target Sales.
Along with that, we have
- Cost of Customer Acquisitions,
- Average Revenue per Customers and
- Customer Life Time Value.
These metrics are very important for marketing and operational analysis.
-Dashboard
The most important tool for any Financial Model is the Dashboard, which is the graphical representation of the project. Either you are an investor or entrepreneur, you would always want to see the graphical representation of the business, which can help you analyze the business and help in decision making.
In the Dashboard, we have
- Profitability Graphs,
- EBITDA,
- Cash Flow, and
- Breakeven,
- Revenue Contribution and
- CAC and CLV graphs.
Last but not least, we have a sheet of
- Depreciation and
- Amortizations,
which is linked with the input sheet and Income Statements.
Along with that, we have
- HR bases Salaries,
- Payroll and
- Opex
to calculate the operational expenses separately then linked with the Income Statement.
This Best Practice includes
1. Excel Financial Model for SVOD (Subscription Based Video on Demand) Business Model like NETFLIX
Further information
Objectives are to provide
Financial Analysis and Valuation for the Subscription-based video in Demand (SVOD) Business Model
Financial Analysis and Financial Planning for Subscription-based video in Demand (SVOD) Business Model
