
Originally published: 29/01/2025 15:51
Last version published: 01/04/2025 13:57
Publication number: ELQ-81339-2
View all versions & Certificate
Last version published: 01/04/2025 13:57
Publication number: ELQ-81339-2
View all versions & Certificate

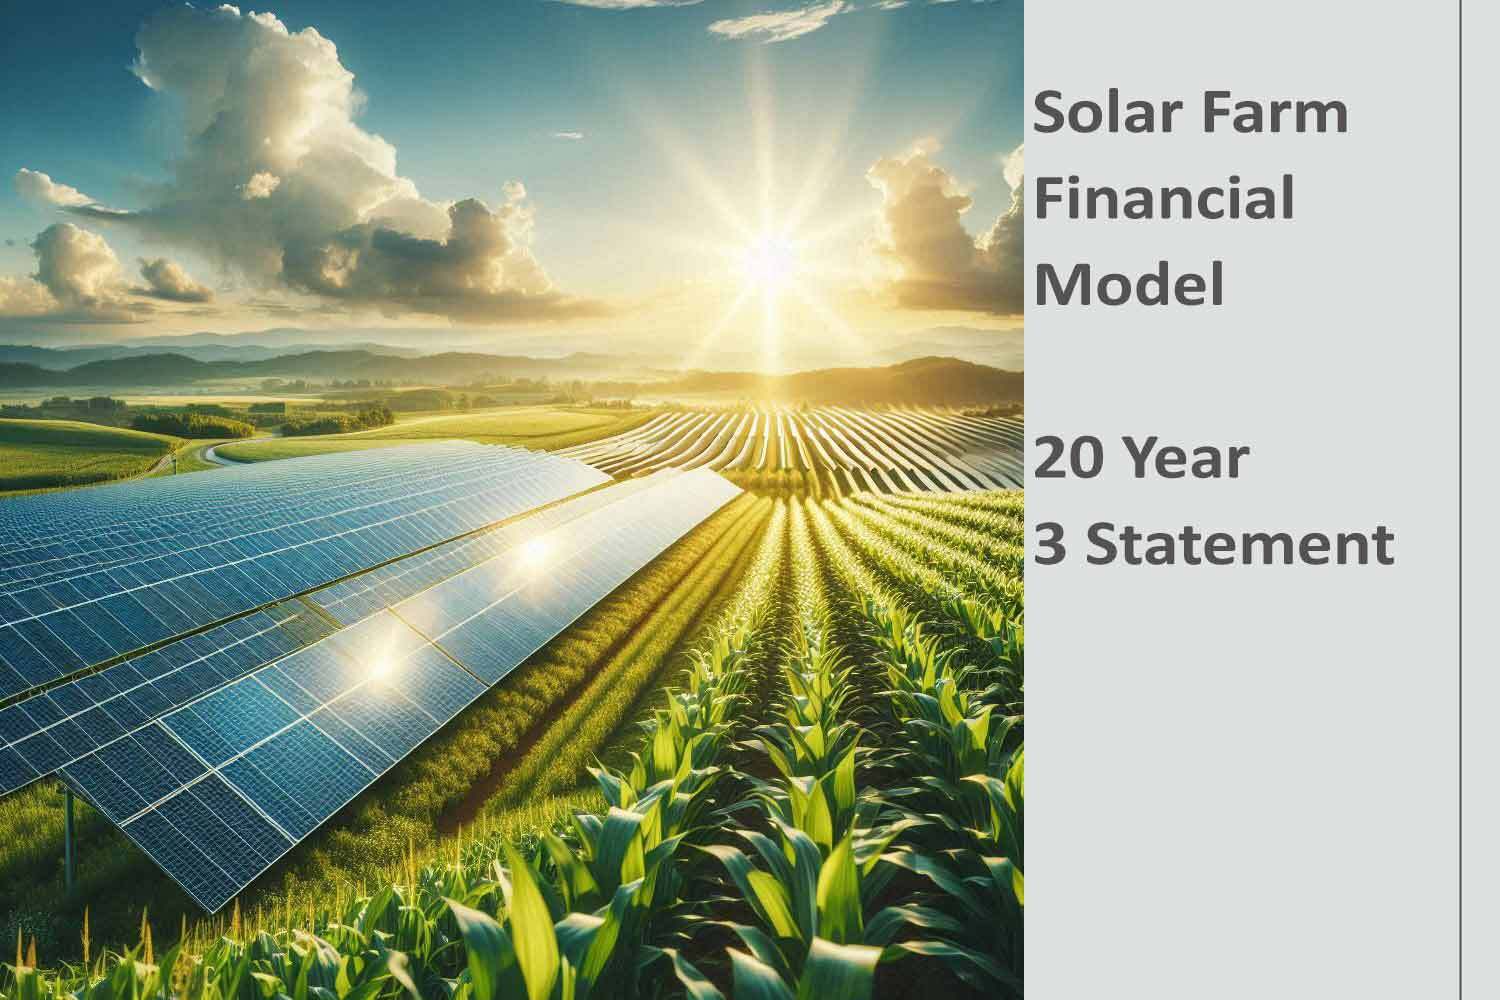
Solar Farm Financial Model 20 Years
Comprehensive editable 20 Year 3-Statement, MS Excel spreadsheet for tracking your Solar Farms finances, Income Statement, Cash Flow Statement, & Balance Sheet
AllFinancialModels offer a curated selection of high-quality yet financial model templates designed to support a wide range of business needs.Follow
solarsolar farmsolar-parkrenewablesolar energyfinancial modelexcelfinancefinance modelfinancial template
Description
A financial model for a Solar Farm typically captures all the critical financial metrics and revenue streams while integrating the operating and capital expenditure involved in running the business.
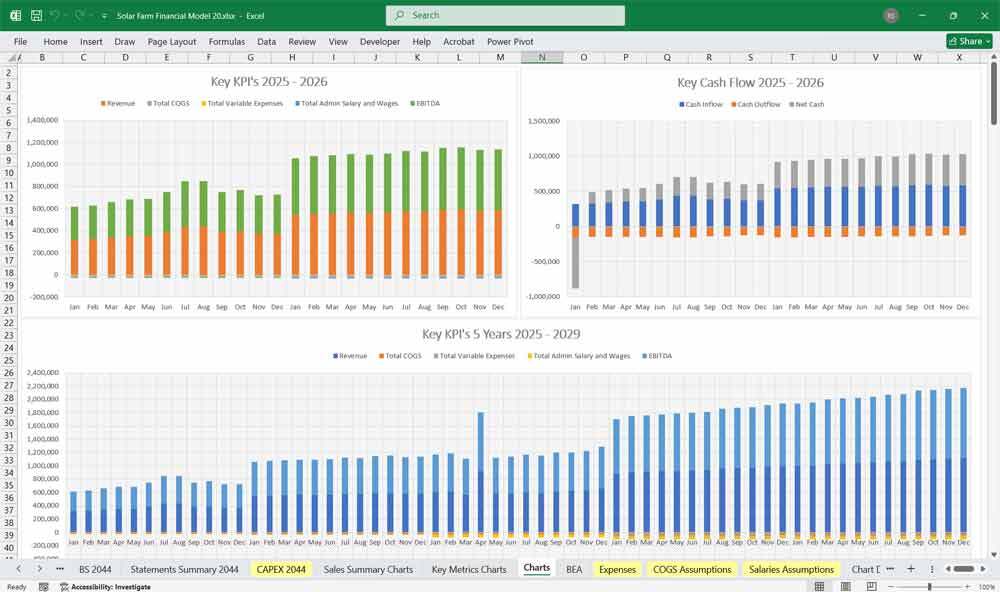
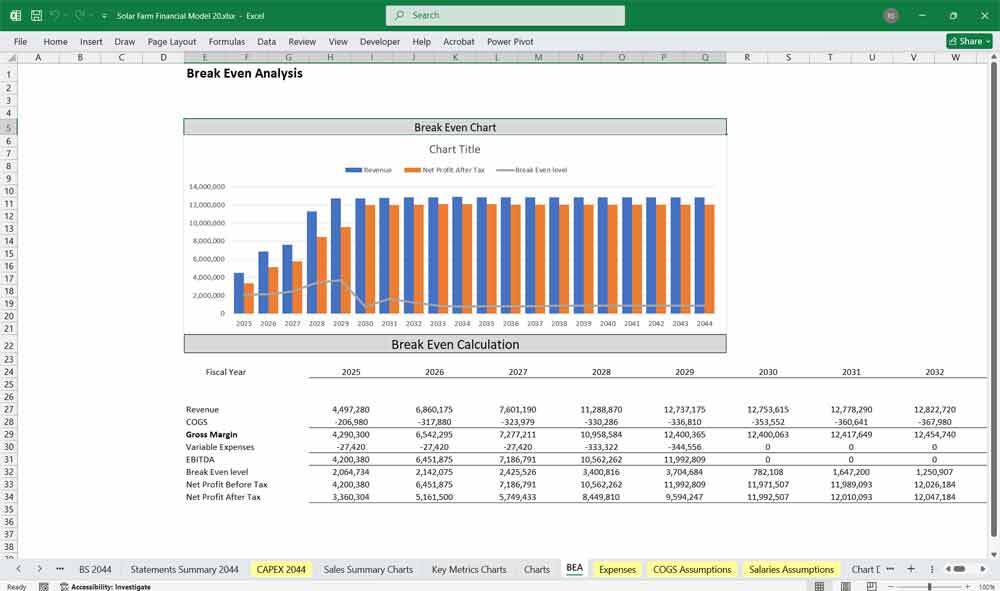
20x income, cash flow, balance sheets, CAPEX tables, yearly summary sheets, and revenue and expenditure charts with the specified revenue streams, BEA charts, electricity revenue summary charts, salary tabs, and expense spreadsheets.
Over 140 MS Excel Tabs of your Solar Farm financial data to monitor.
1. Key Components of the Solar Farm Financial Model
This solar farm financial model evaluates the financial viability of the project by forecasting revenues, expenses, cash flows, and overall profitability. It includes the following major components:
Inputs
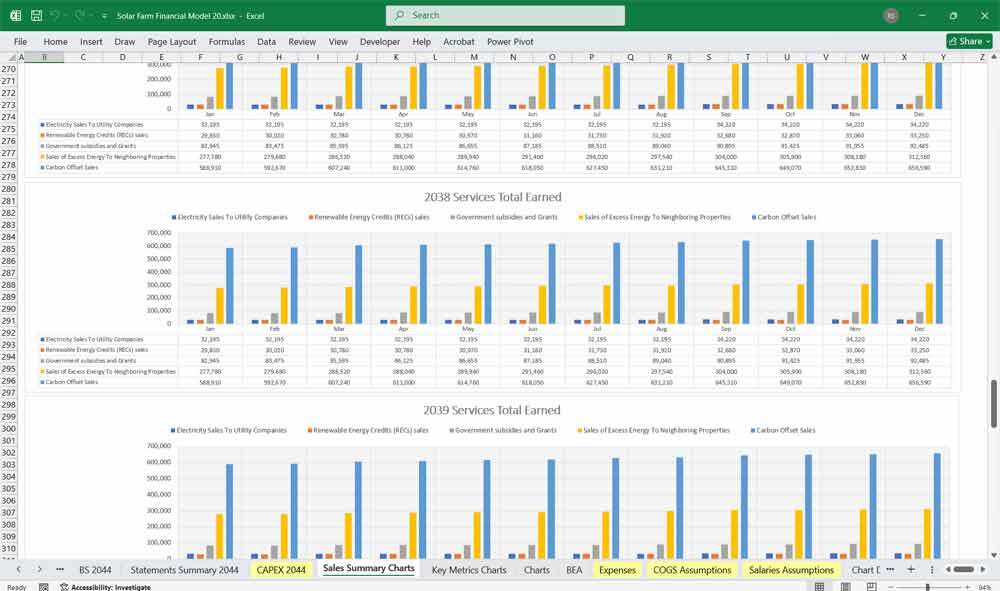
Revenue Assumptions
- Electricity sales to utility companies
- Renewable Energy Credits (RECs) sales
- Government subsidies and grants
- Sales of excess energy to neighboring properties)
- Carbon offset sales
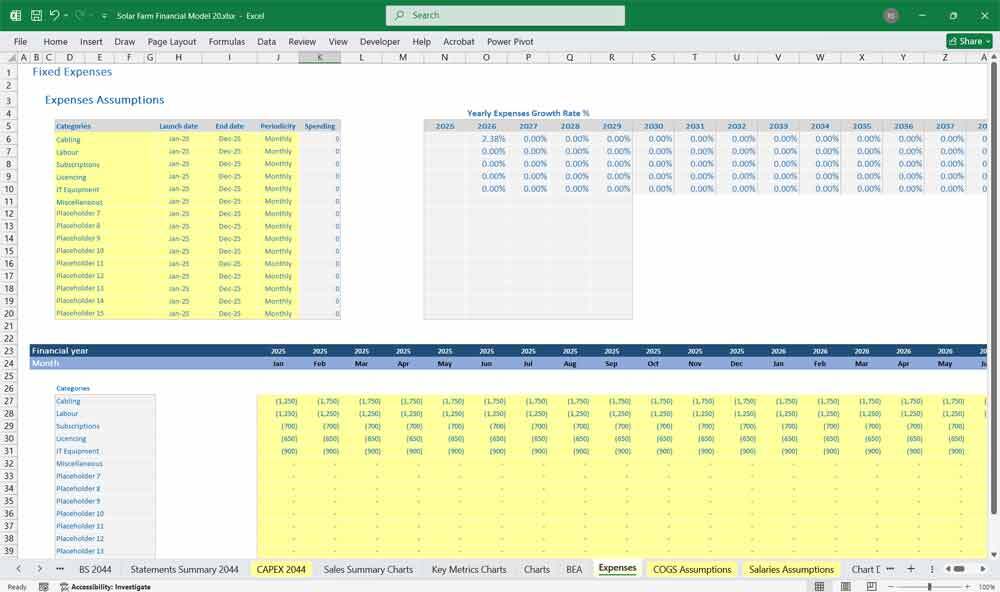
Selling and general expense Assumptions
- Land lease or purchase costs
- Equipment maintenance and repairs
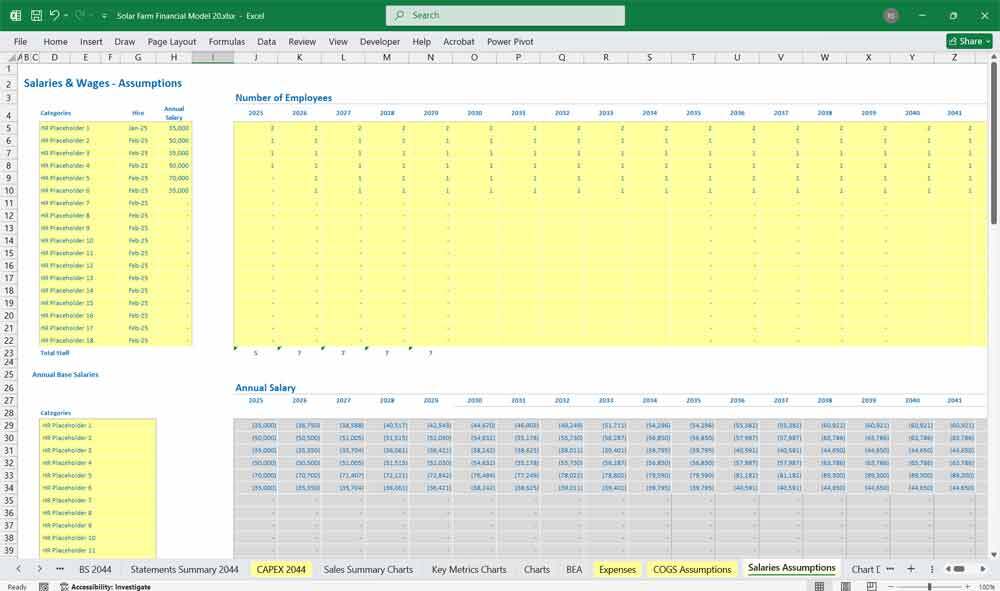
- Payroll for employees
- Insurance premiums
- Permitting and regulatory compliance fees
- Professional services (legal, accounting, etc.)
- Storage and transportation costs
- Marketing and advertising expenses
- Utilities (electricity, water, etc.)
- Monitoring and data collection services
- Training and development programs for employees
- Waste disposal and environmental remediation costs
- Technology and software expenses
- Research and development costs.
- Loan servicing fees
- Miscellaneous professional consulting
- Contingency funds
- Miscellaneous expenses
- Tax and Financial Assumptions
- Corporate Tax Rate (%)
- Depreciation Schedule (straight-line, MACRS, etc.)
- Discount Rate (% for NPV/IRR calculations)
---
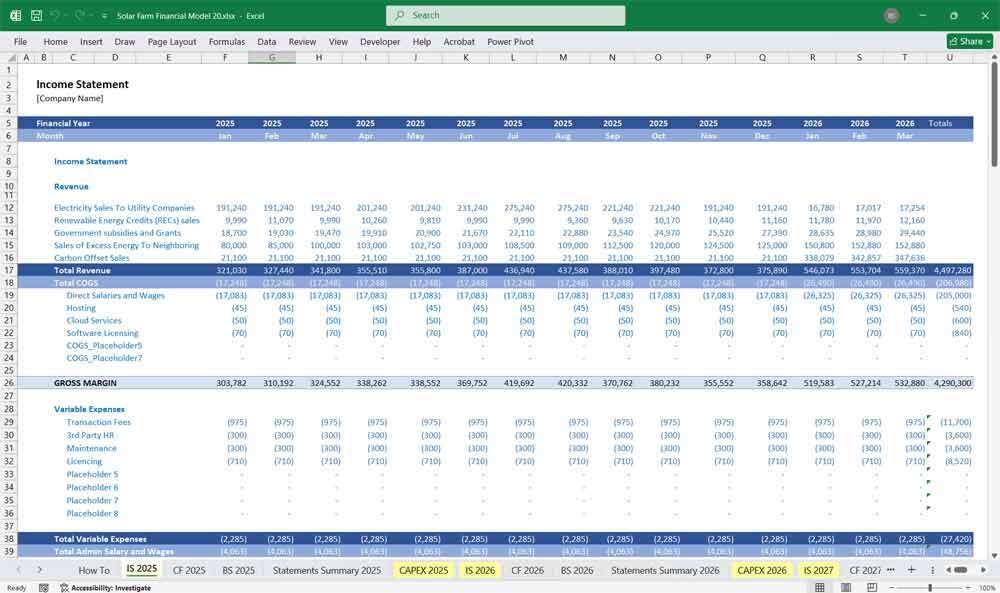
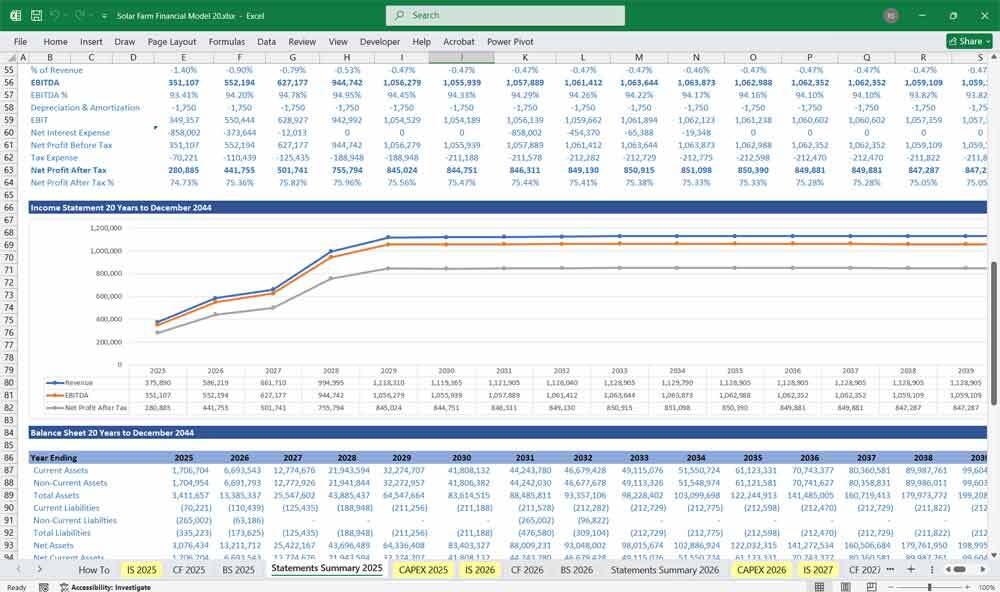
2. Income Statement
The income statement forecasts profitability and includes the following:
Revenue
1. Generated MWh: Energy production is calculated as:
{Generated MWh} = \text{Installed Capacity (MW)} \times \text{Capacity Factor} \times {Hours in a Year (8760)}
Adjust for degradation over time.
2. PPA Revenue:
{Revenue} = text{Generated MWh} times text{PPA Rate}
- Add escalation if the PPA terms include price increases over time.
- Consider additional revenue from renewable energy credits or incentives.
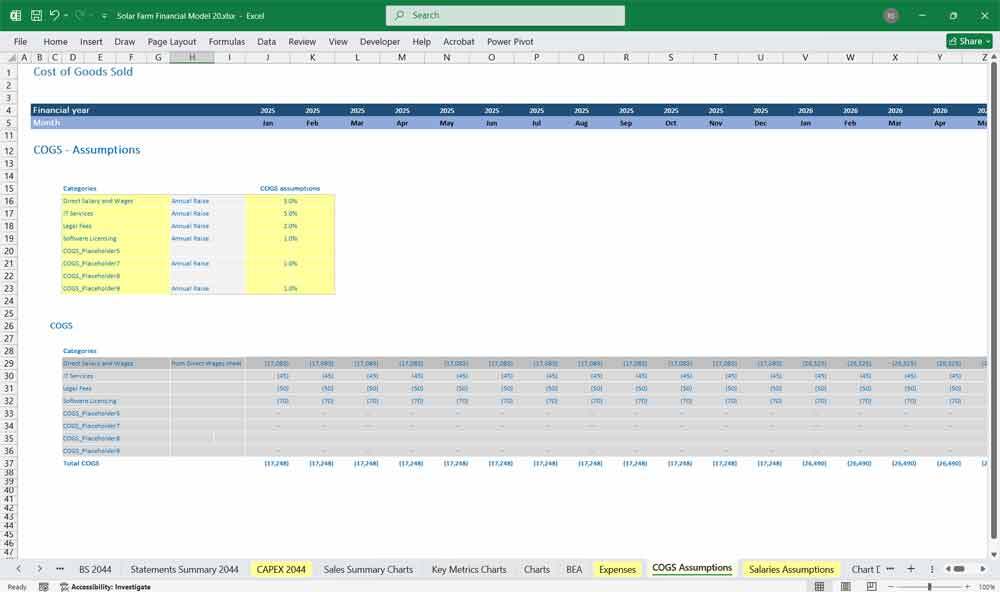
Expenses
- Operating Costs: Includes maintenance, land lease, and insurance.
- Depreciation: Depreciation of CapEx over the asset's useful life.
- Financing Costs: Interest payments on loans.
Profitability Metrics
- Gross Profit = Revenue - Operating Costs
- EBIT (Earnings Before Interest and Taxes) = Gross Profit - Depreciation
- Net Income = EBIT - Interest - Taxes
---
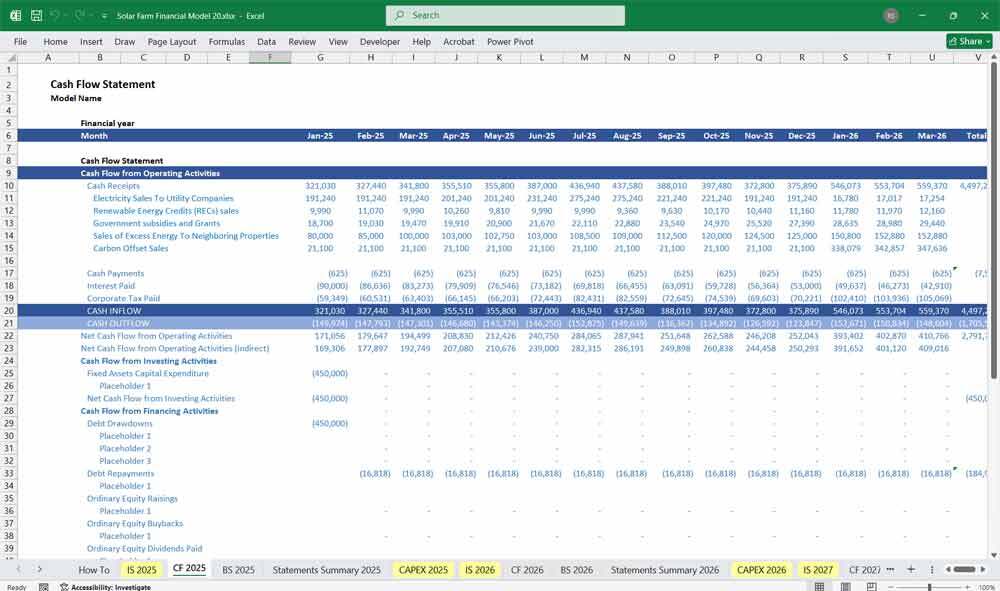
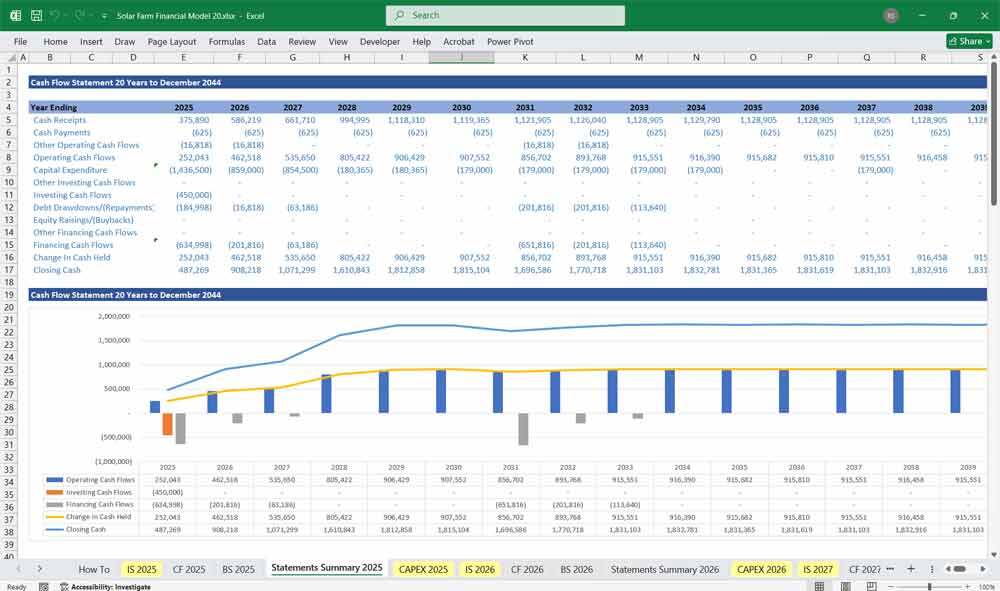
3. Cash Flow Statement
The cash flow statement tracks the cash inflows and outflows, ensuring liquidity for the solar farm:
Operating Activities
- Cash Inflows: Revenue from PPA.
- Cash Outflows: Operating expenses, taxes, and insurance.
Investing Activities
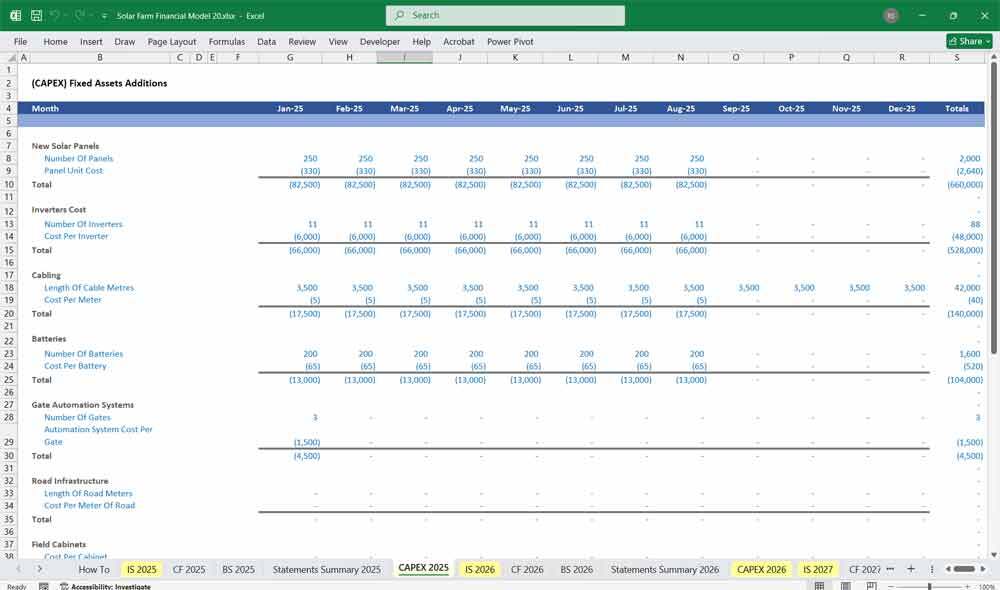
- CapEx: Initial investment in land, panels, inverters, and other infrastructure.
Financing Activities
- Loan Proceeds: Debt financing raised for the project.
- Repayment of Loans: Scheduled principal and interest payments.
- Equity Contributions: Funds from investors.
Net Cash Flow
text{Net Cash Flow} = text{Operating Cash Flow} + text{Investing Cash Flow} + text{Financing Cash Flow}
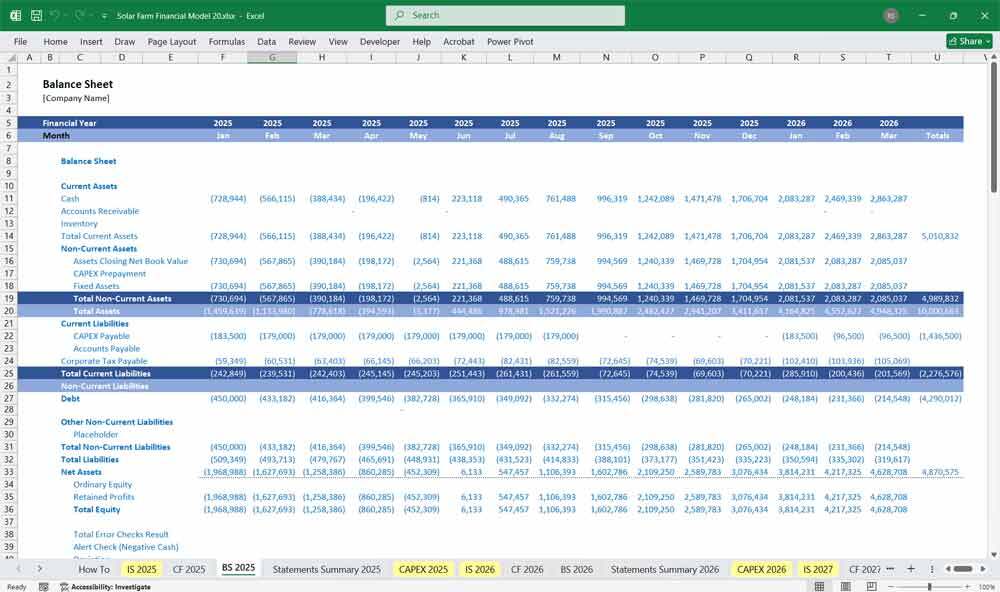
4. Balance Sheet
The balance sheet tracks the project’s assets, liabilities, and equity over time:
Assets
- Current Assets: Cash, accounts receivable (e.g., from PPA payments).
- Non-Current Assets: Solar farm equipment (net of depreciation), land value.
Liabilities
- Current Liabilities: Short-term loan repayments.
- Long-Term Liabilities: Outstanding debt for financing the solar farm.
Equity
- Retained Earnings: Accumulated profits reinvested into the project.
- Shareholder Equity: Contributions from equity investors.
---
5. Financial KPIs
To evaluate project feasibility, include the following metrics:
- IRR (Internal Rate of Return): Measures return on investment.
- NPV (Net Present Value): Determines the value of future cash flows discounted to the present.
- DSCR (Debt Service Coverage Ratio): Indicates the project's ability to service debt:
text{DSCR} = frac{{Net Operating Income}}{{Debt Payments}}
6. Detailed Model Sections
Generated MWh
A separate section calculates the annual energy production:
- Year 1: Based on Installed Capacity and Capacity Factor.
- Subsequent Years: Adjust for degradation.
PPA
- Define the PPA terms, including rate ($/MWh), escalation rate, and contract duration.
- Incorporate revenue from other sources (e.g., renewable energy credits).
Revenue
Combine revenues from PPA and other sources for the total income forecast.
---
This structure provides a comprehensive overview of a solar farm’s financial model.
A financial model for a Solar Farm typically captures all the critical financial metrics and revenue streams while integrating the operating and capital expenditure involved in running the business.
20x income, cash flow, balance sheets, CAPEX tables, yearly summary sheets, and revenue and expenditure charts with the specified revenue streams, BEA charts, electricity revenue summary charts, salary tabs, and expense spreadsheets.
Over 140 MS Excel Tabs of your Solar Farm financial data to monitor.
1. Key Components of the Solar Farm Financial Model
This solar farm financial model evaluates the financial viability of the project by forecasting revenues, expenses, cash flows, and overall profitability. It includes the following major components:
Inputs
Revenue Assumptions
- Electricity sales to utility companies
- Renewable Energy Credits (RECs) sales
- Government subsidies and grants
- Sales of excess energy to neighboring properties)
- Carbon offset sales
Selling and general expense Assumptions
- Land lease or purchase costs
- Equipment maintenance and repairs
- Payroll for employees
- Insurance premiums
- Permitting and regulatory compliance fees
- Professional services (legal, accounting, etc.)
- Storage and transportation costs
- Marketing and advertising expenses
- Utilities (electricity, water, etc.)
- Monitoring and data collection services
- Training and development programs for employees
- Waste disposal and environmental remediation costs
- Technology and software expenses
- Research and development costs.
- Loan servicing fees
- Miscellaneous professional consulting
- Contingency funds
- Miscellaneous expenses
- Tax and Financial Assumptions
- Corporate Tax Rate (%)
- Depreciation Schedule (straight-line, MACRS, etc.)
- Discount Rate (% for NPV/IRR calculations)
---
2. Income Statement
The income statement forecasts profitability and includes the following:
Revenue
1. Generated MWh: Energy production is calculated as:
{Generated MWh} = \text{Installed Capacity (MW)} \times \text{Capacity Factor} \times {Hours in a Year (8760)}
Adjust for degradation over time.
2. PPA Revenue:
{Revenue} = text{Generated MWh} times text{PPA Rate}
- Add escalation if the PPA terms include price increases over time.
- Consider additional revenue from renewable energy credits or incentives.
Expenses
- Operating Costs: Includes maintenance, land lease, and insurance.
- Depreciation: Depreciation of CapEx over the asset's useful life.
- Financing Costs: Interest payments on loans.
Profitability Metrics
- Gross Profit = Revenue - Operating Costs
- EBIT (Earnings Before Interest and Taxes) = Gross Profit - Depreciation
- Net Income = EBIT - Interest - Taxes
---
3. Cash Flow Statement
The cash flow statement tracks the cash inflows and outflows, ensuring liquidity for the solar farm:
Operating Activities
- Cash Inflows: Revenue from PPA.
- Cash Outflows: Operating expenses, taxes, and insurance.
Investing Activities
- CapEx: Initial investment in land, panels, inverters, and other infrastructure.
Financing Activities
- Loan Proceeds: Debt financing raised for the project.
- Repayment of Loans: Scheduled principal and interest payments.
- Equity Contributions: Funds from investors.
Net Cash Flow
text{Net Cash Flow} = text{Operating Cash Flow} + text{Investing Cash Flow} + text{Financing Cash Flow}
4. Balance Sheet
The balance sheet tracks the project’s assets, liabilities, and equity over time:
Assets
- Current Assets: Cash, accounts receivable (e.g., from PPA payments).
- Non-Current Assets: Solar farm equipment (net of depreciation), land value.
Liabilities
- Current Liabilities: Short-term loan repayments.
- Long-Term Liabilities: Outstanding debt for financing the solar farm.
Equity
- Retained Earnings: Accumulated profits reinvested into the project.
- Shareholder Equity: Contributions from equity investors.
---
5. Financial KPIs
To evaluate project feasibility, include the following metrics:
- IRR (Internal Rate of Return): Measures return on investment.
- NPV (Net Present Value): Determines the value of future cash flows discounted to the present.
- DSCR (Debt Service Coverage Ratio): Indicates the project's ability to service debt:
text{DSCR} = frac{{Net Operating Income}}{{Debt Payments}}
6. Detailed Model Sections
Generated MWh
A separate section calculates the annual energy production:
- Year 1: Based on Installed Capacity and Capacity Factor.
- Subsequent Years: Adjust for degradation.
PPA
- Define the PPA terms, including rate ($/MWh), escalation rate, and contract duration.
- Incorporate revenue from other sources (e.g., renewable energy credits).
Revenue
Combine revenues from PPA and other sources for the total income forecast.
---
This structure provides a comprehensive overview of a solar farm’s financial model.
This Best Practice includes
1 Excel Financial Model
Further information
Provides thorough oversight, tracking, and reporting of Solar Farm finances, including updates on budget utilisation and projections.
