
Originally published: 12/06/2026 12:10
Publication number: ELQ-19048-1
View all versions & Certificate
Publication number: ELQ-19048-1
View all versions & Certificate

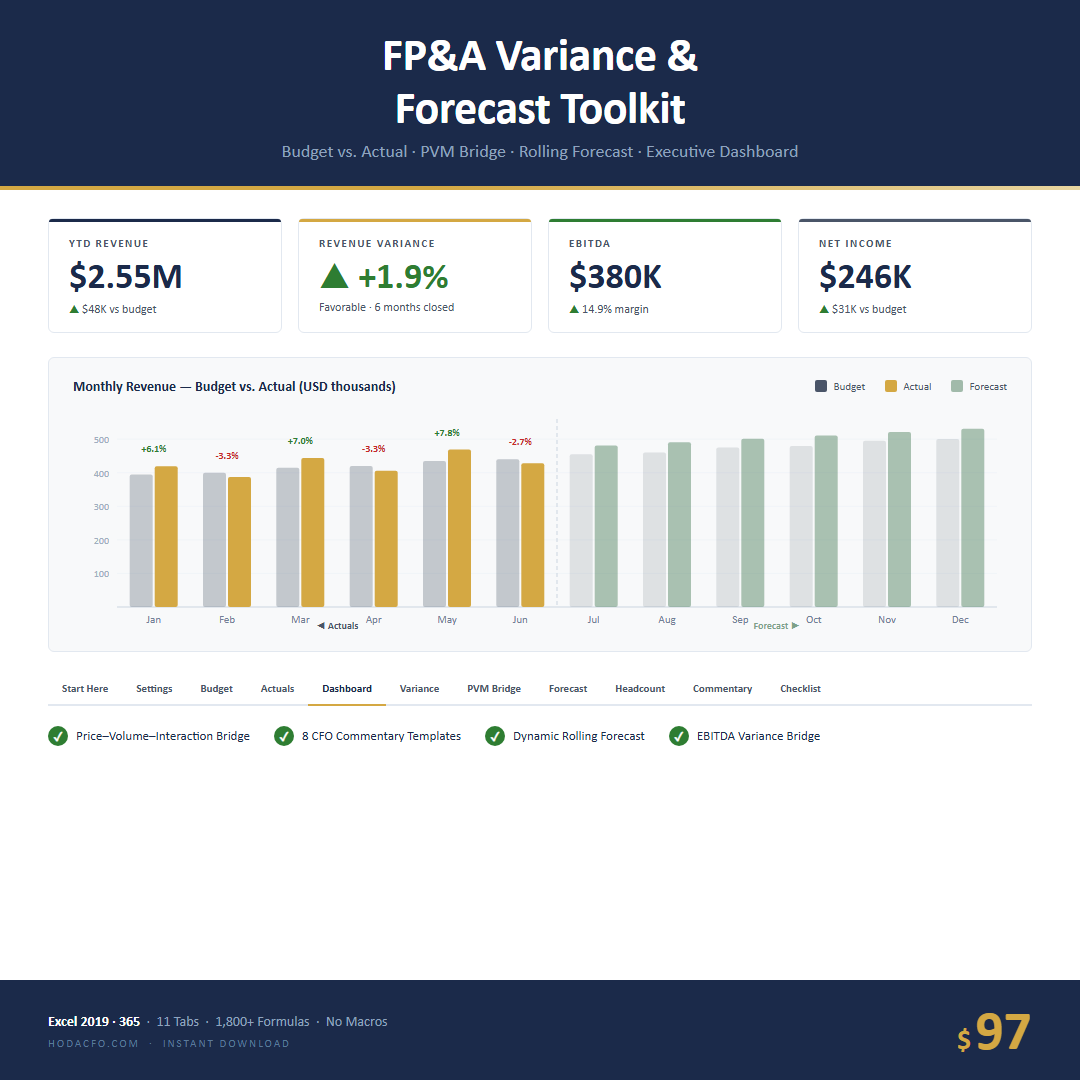
FP&A Variance & Forecast Toolkit — Excel | Budget vs Actual | PVM Bridge | Rolling Forecast | Headcount Plan
11-tab FP&A workbook: variance analysis, PVM bridge, rolling forecast, headcount plan, dashboard. Excel. $97.
UAE Financial Controller | Filing FTA VAT201 Returns Since January 2018 | 9 Years UAE Finance ExperienceFollow
Further information
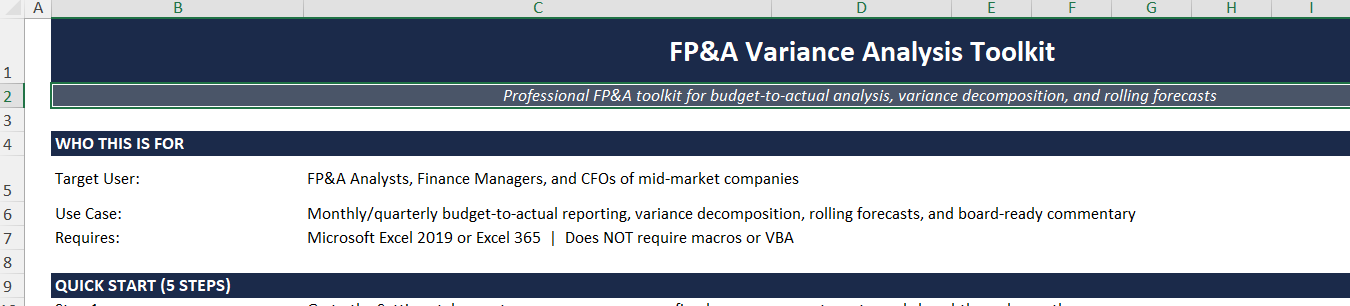
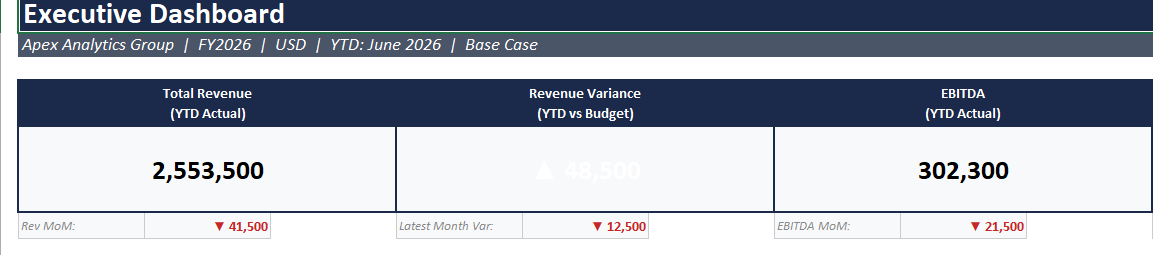
Run a complete month-end close from a single workbook. Present board-ready variance analysis, decompose revenue into Price-Volume-Interaction effects, and maintain a rolling forecast that locks closed months automatically.
Companies with $5M–$500M revenue
running monthly close cycles with board or investor reporting.
Finance teams of 1–5 people who own the full close process in Excel.
Companies with $5M–$500M revenue running monthly close cycles with board or investor reporting.
Finance teams of 1–5 people who own the full close process in Excel.
