
Publication number: ELQ-57706-1
View all versions & Certificate

A/B Price Test Analyzer
A/B Price Test Analyzer applies proper statistical methods to your test results and tells you with confidence whether your price change improved performance.
🧪 A/B Price Test Analyzer — Interactive HTML Dashboard
By Data'sOk
━━━━━━━━━━━━━━━━━━━━━━━━
Did your price test actually work — or did it just look like it did?
Most e-commerce businesses run price tests and judge the result by whichever variant had more sales. That’s not analysis — that’s guesswork with extra steps. Without statistical significance testing, you’re as likely to be reading random noise as a real signal.
The Data’sOk A/B Price Test Analyzer applies proper statistical methods to your test results and tells you with confidence whether your price change genuinely improved performance — or whether you’d be rolling out a change based on luck.
One HTML file. Opens in any browser. No software required. No data ever leaves your computer.
━━━━━━━━━━━━━━━━━━━━━━━━
WHAT YOU GET
🏆 Automatic verdict banner
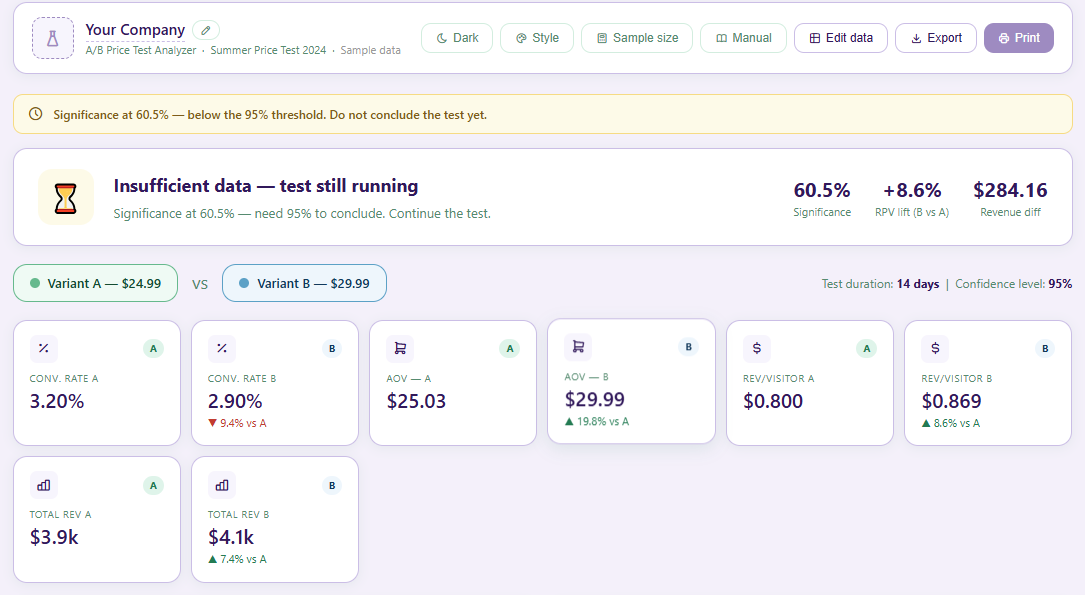
One clear conclusion at the top: 🏆 B wins, 🔄 A holds, ⏳ still running, or 🤝 no difference — with significance %, revenue lift, and revenue difference shown instantly.
📊 8 KPI cards
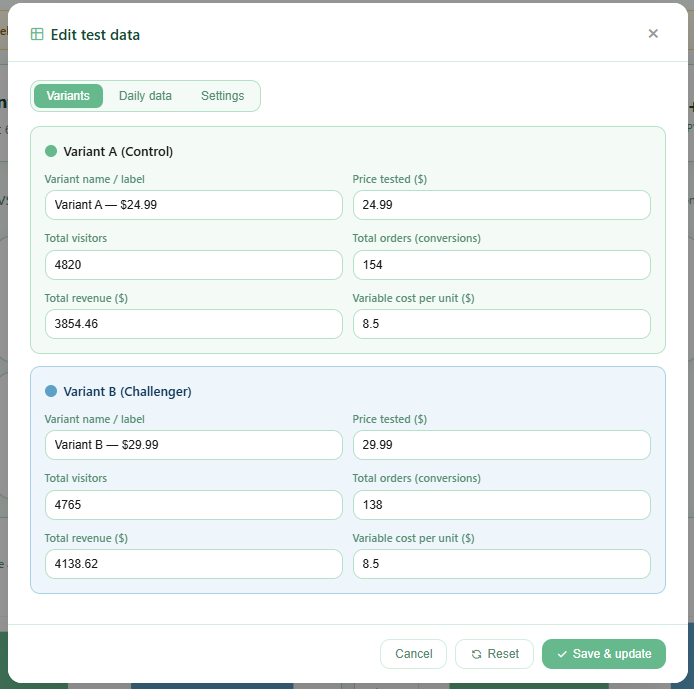
Conversion rate, AOV, revenue per visitor, and total revenue for both variants — each with % lift on the challenger.
📈 7 interactive charts
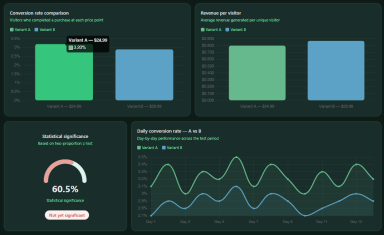
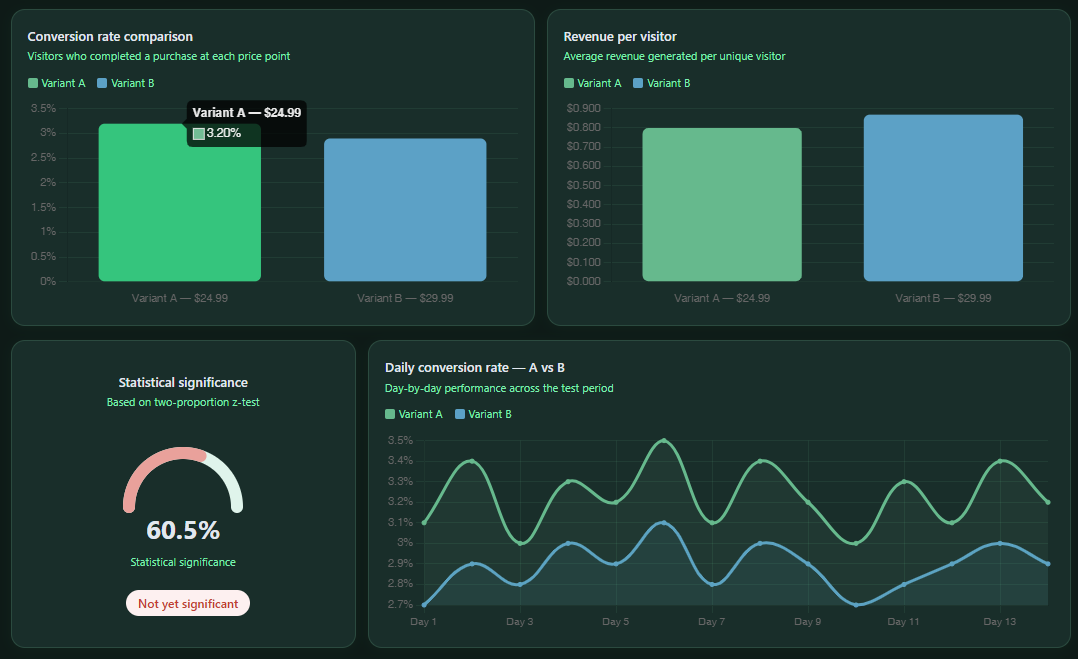
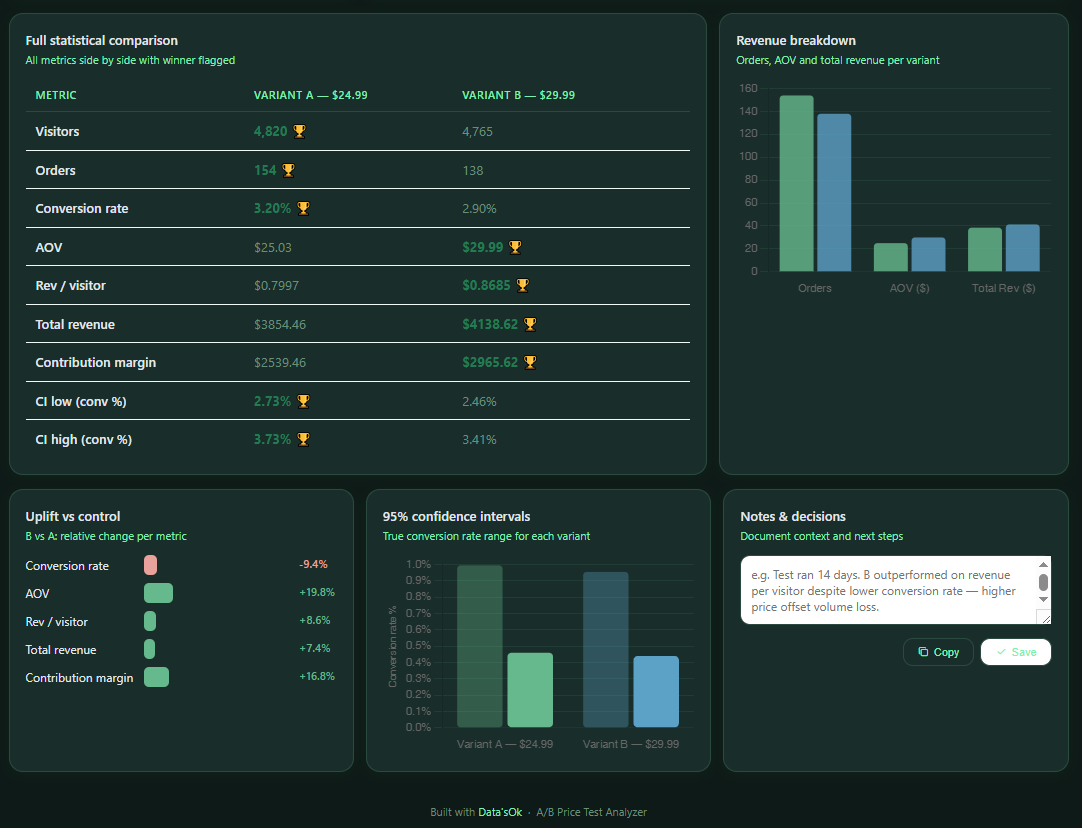
Conversion rate comparison, revenue per visitor, statistical significance gauge (arc meter), daily conversion trend A vs B, revenue breakdown, 95% confidence intervals (Wilson method), and uplift vs control bars.
📐 Full statistical comparison table
Every metric side by side with 🏆 trophy on the winner: visitors, orders, conversion rate, AOV, revenue per visitor, total revenue, contribution margin, and confidence intervals.
⚠️ Smart alert banner
Automatic warnings: sample too small, test not yet significant, uneven traffic split between variants.
🧭 Sample size calculator
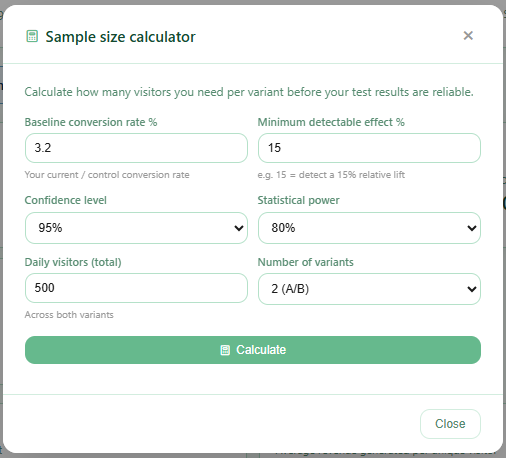
Before you run a test: enter your baseline conversion rate, minimum detectable effect, confidence level, statistical power, and daily traffic — get the required visitors per variant and days to run.
🎨 Full branding customisation
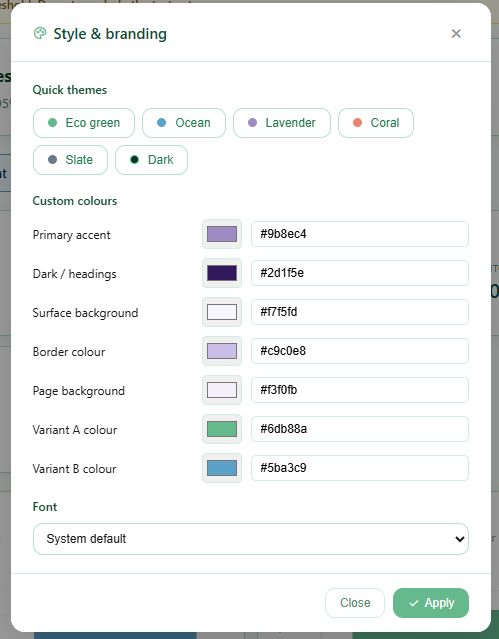
Upload your logo. Edit your company name. Choose from 5 colour themes + dark mode toggle. Set custom hex colours for every element including the A and B variant colours.
📖 Built-in user manual
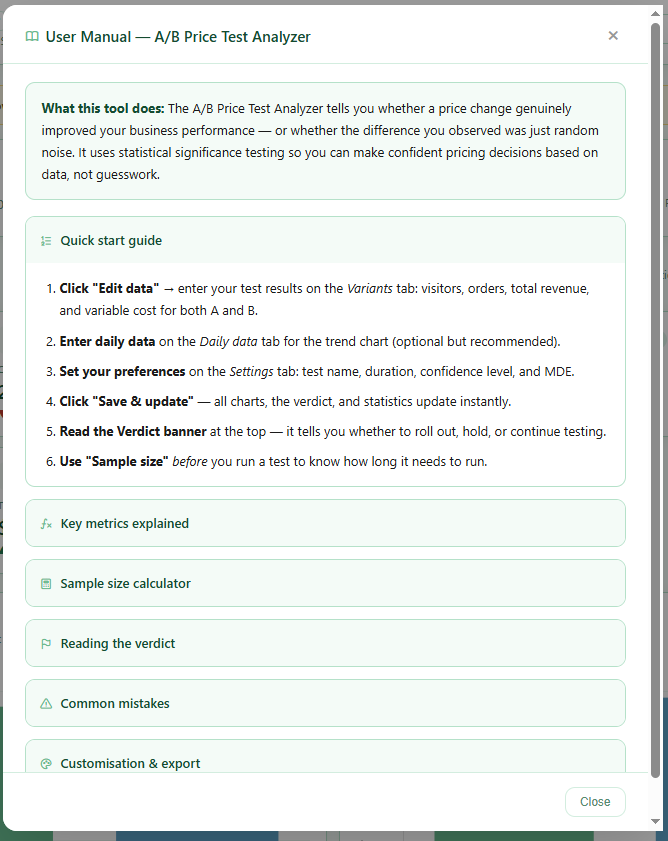
Collapsible in-app guide covering all metrics, how to read the verdict, the sample size calculator, common A/B testing mistakes, and export options.
💾 Export & import
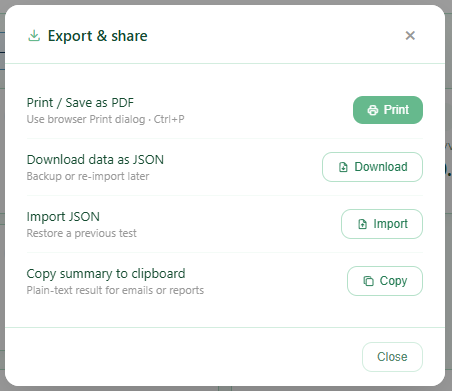
Download data as JSON, re-import later, copy a plain-text summary to clipboard, or print to PDF.
📝 Notes & decisions panel
Document your conclusions, context, and next steps — included in the print view.
━━━━━━━━━━━━━━━━━━━━━━━━
WHO IT'S FOR
→ E-commerce managers who run price tests and want statistically valid conclusions
→ Pricing analysts who need to present test results to leadership with confidence
→ Product managers building a rigorous pricing experimentation process
→ Consultants presenting A/B test analysis to retail or e-commerce clients
→ Anyone who has ever rolled out a price change based on a test that may not have been long enough
━━━━━━━━━━━━━━━━━━━━━━━━
WHY IT'S DIFFERENT
Most A/B test “analyzers” compare two numbers and tell you which is bigger. This one applies a two-proportion z-test, Wilson confidence intervals, and a sample size calculator to make sure your conclusion is statistically defensible — not just directionally plausible.
It also measures the right thing: not just conversion rate, but Revenue per Visitor and Contribution Margin. A higher price almost always reduces conversion. What matters is whether it improves your revenue and profit per visitor.
No subscription. No software. No data uploaded anywhere.
━━━━━━━━━━━━━━━━━━━━━━━━
REQUIREMENTS
Any modern browser: Chrome, Firefox, Safari, or Edge. No installation required. Works on Windows, Mac, and Linux.
This Best Practice includes
1 rar. file with an HTML file.
