

Originally published: 25/04/2025 06:46
Publication number: ELQ-37617-1
View all versions & Certificate
Publication number: ELQ-37617-1
View all versions & Certificate

Contract Manufacturing Business 5-Year 3 Statement Financial Projection Model
Versatile 5-Year financial projection model for business outsourcing manufacturing with retail, online & B2B revenue, R&D, 3-statement projections & valuation
contractmanufacturingoutsourcingretailwholesaleexcelfinancial projectionfinancial modelvaluationdashboard
Description
MODEL OVERVIEW
Contract manufacturing is a business arrangement where a company hires a third-party manufacturer to produce its products based on the company's specifications, design, and branding. The hiring company retains ownership of the product concept and often handles marketing and sales, while the contract manufacturer handles the actual production process. This approach allows businesses to reduce costs, speed up production, and focus on core functions like design, marketing, and sales.
Our highly versatile and user-friendly Excel model allows for the preparation of an 5-year rolling 3 statement (Income Statement, Balance Sheet and Cash flow Statement) financial projection with a monthly timeline for a startup or existing business outsourcing manufacturing.
The model allows the user to model up to 15 product categories across 3 sales channels (retail in-store, retail online and/or B2B wholesale) with full manufacturing and other landed costs, detailed payment structure, production lead times, ordering cycles, inventory calculations and R&D costs. In addition model includes projections for staff costs, marketing costs, other operating costs, fixed assets, borrowings, sales tax, corporate tax and dividend distributions.
The model follows good practice financial modelling principles and includes instructions, line-item explanations, checks and input validations and incorporates a discounted cash flow valuation calculation using the projected cash flows.
KEY OUTPUTS
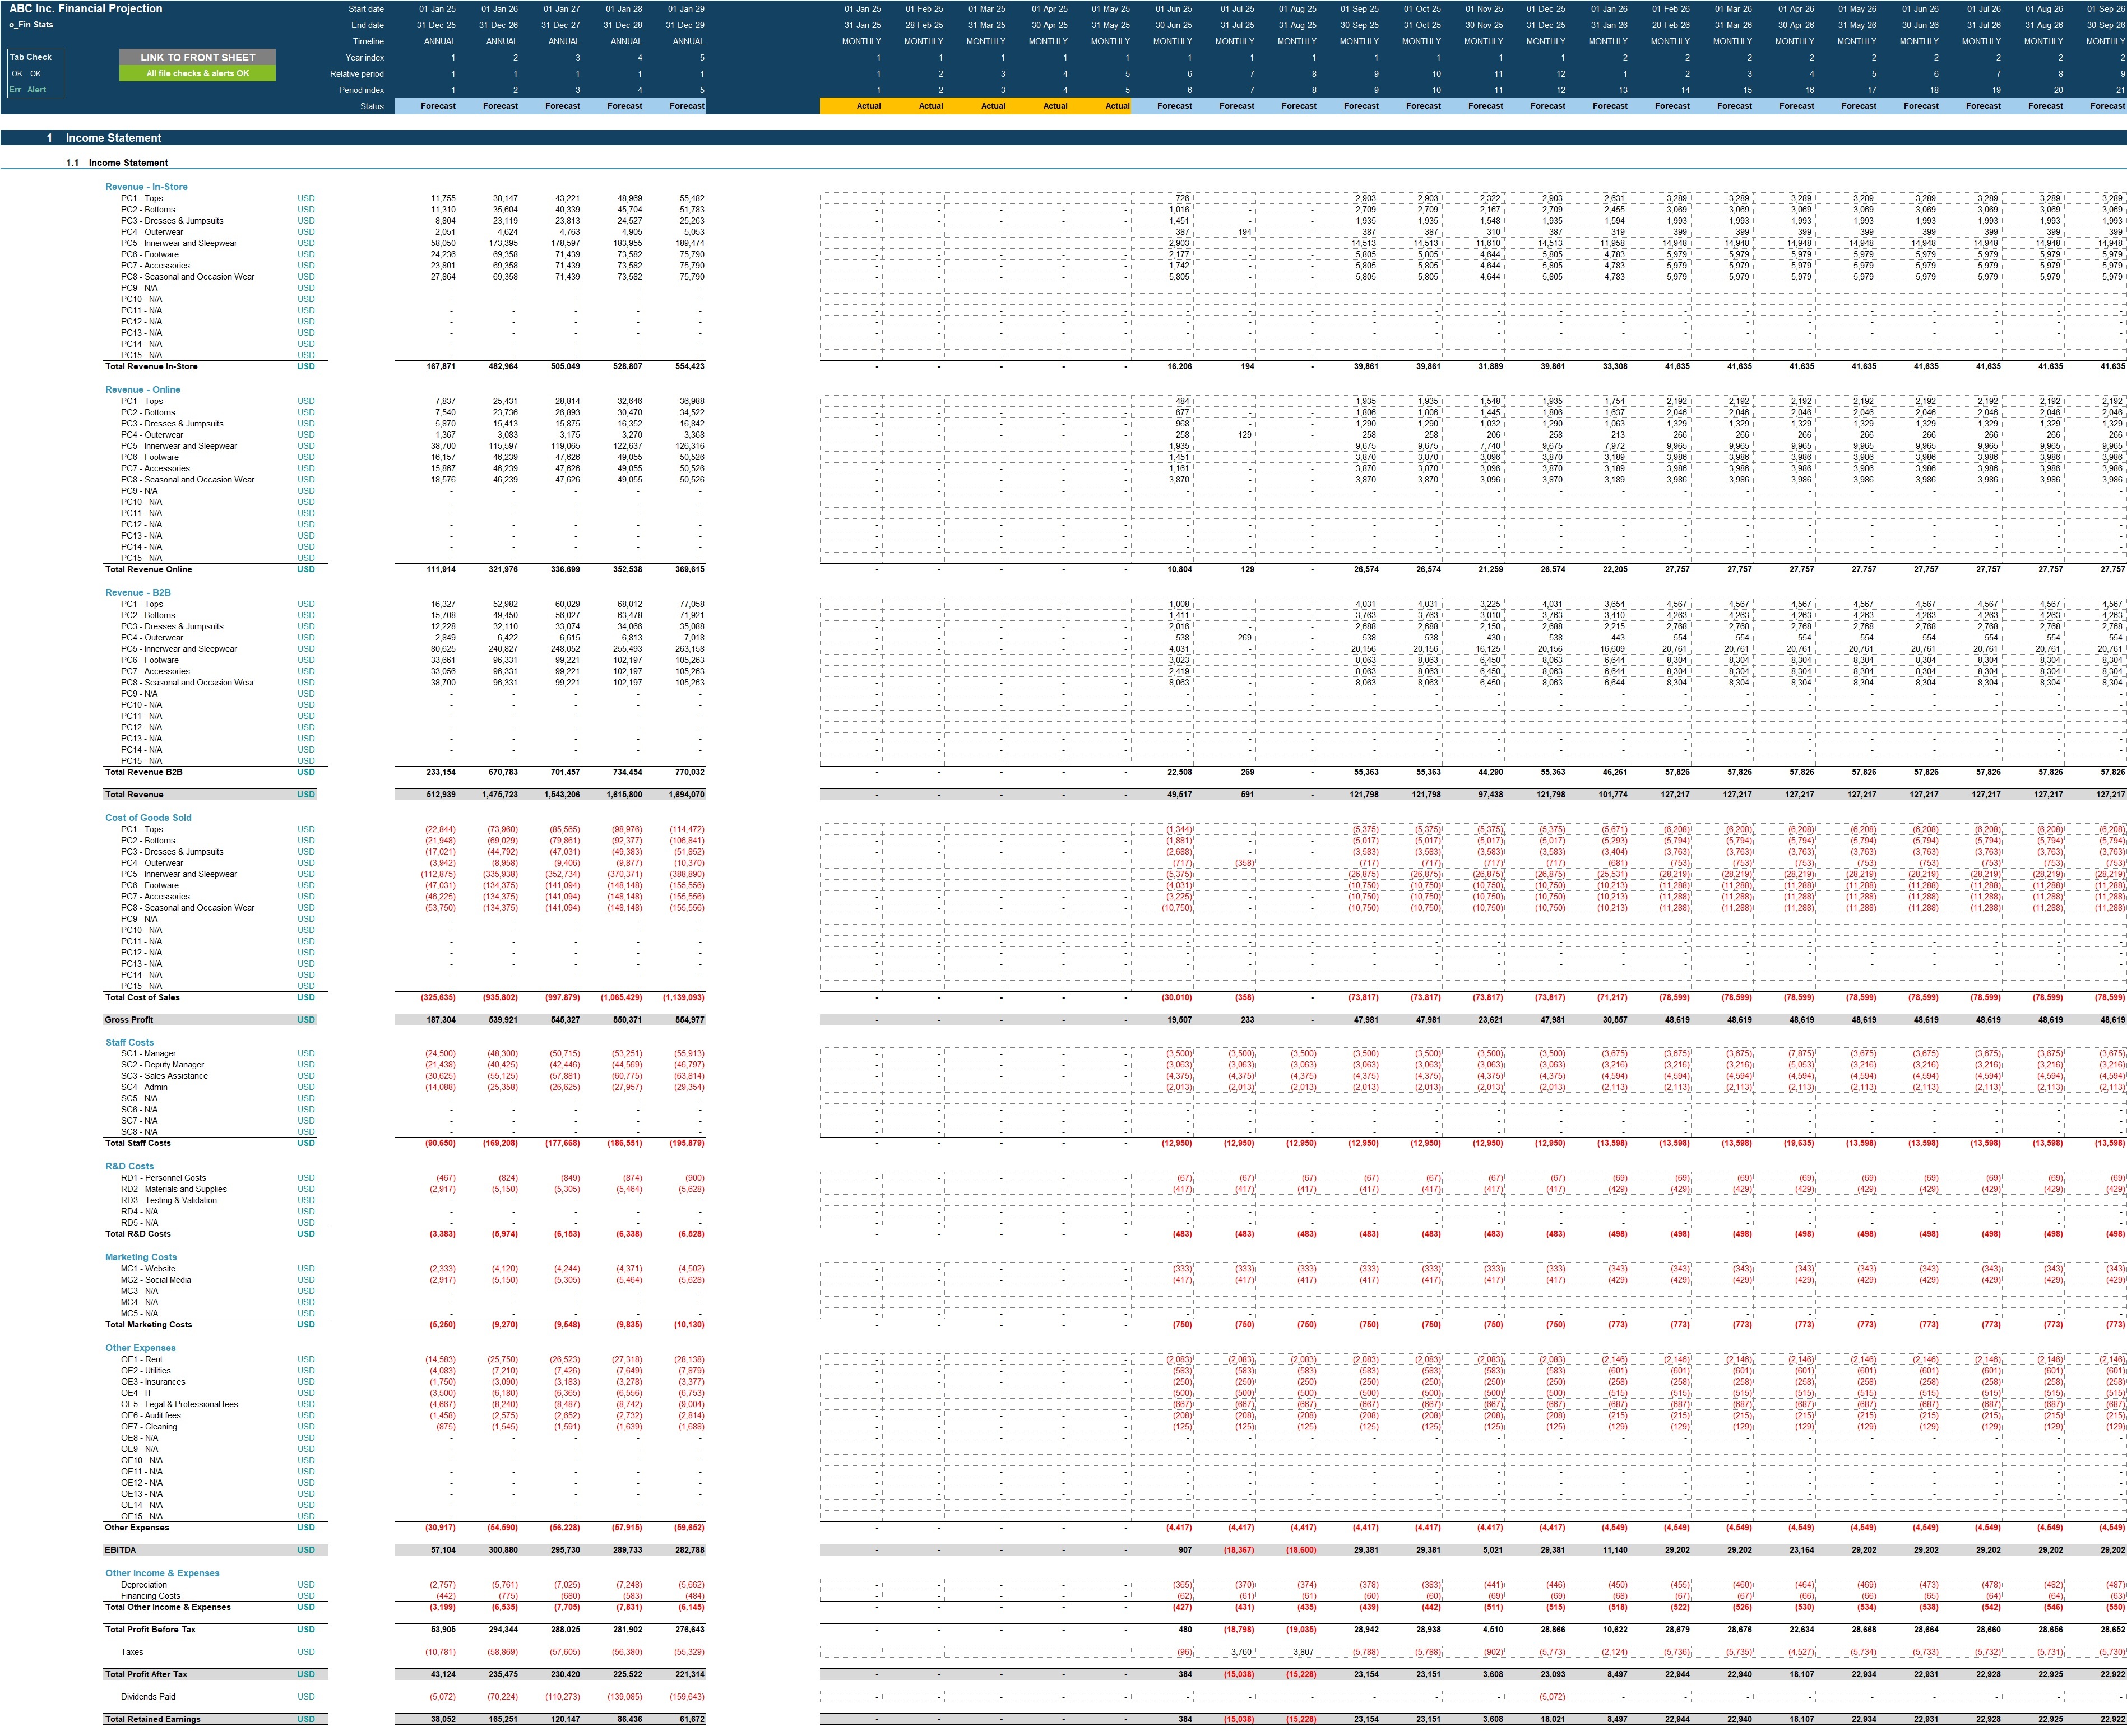
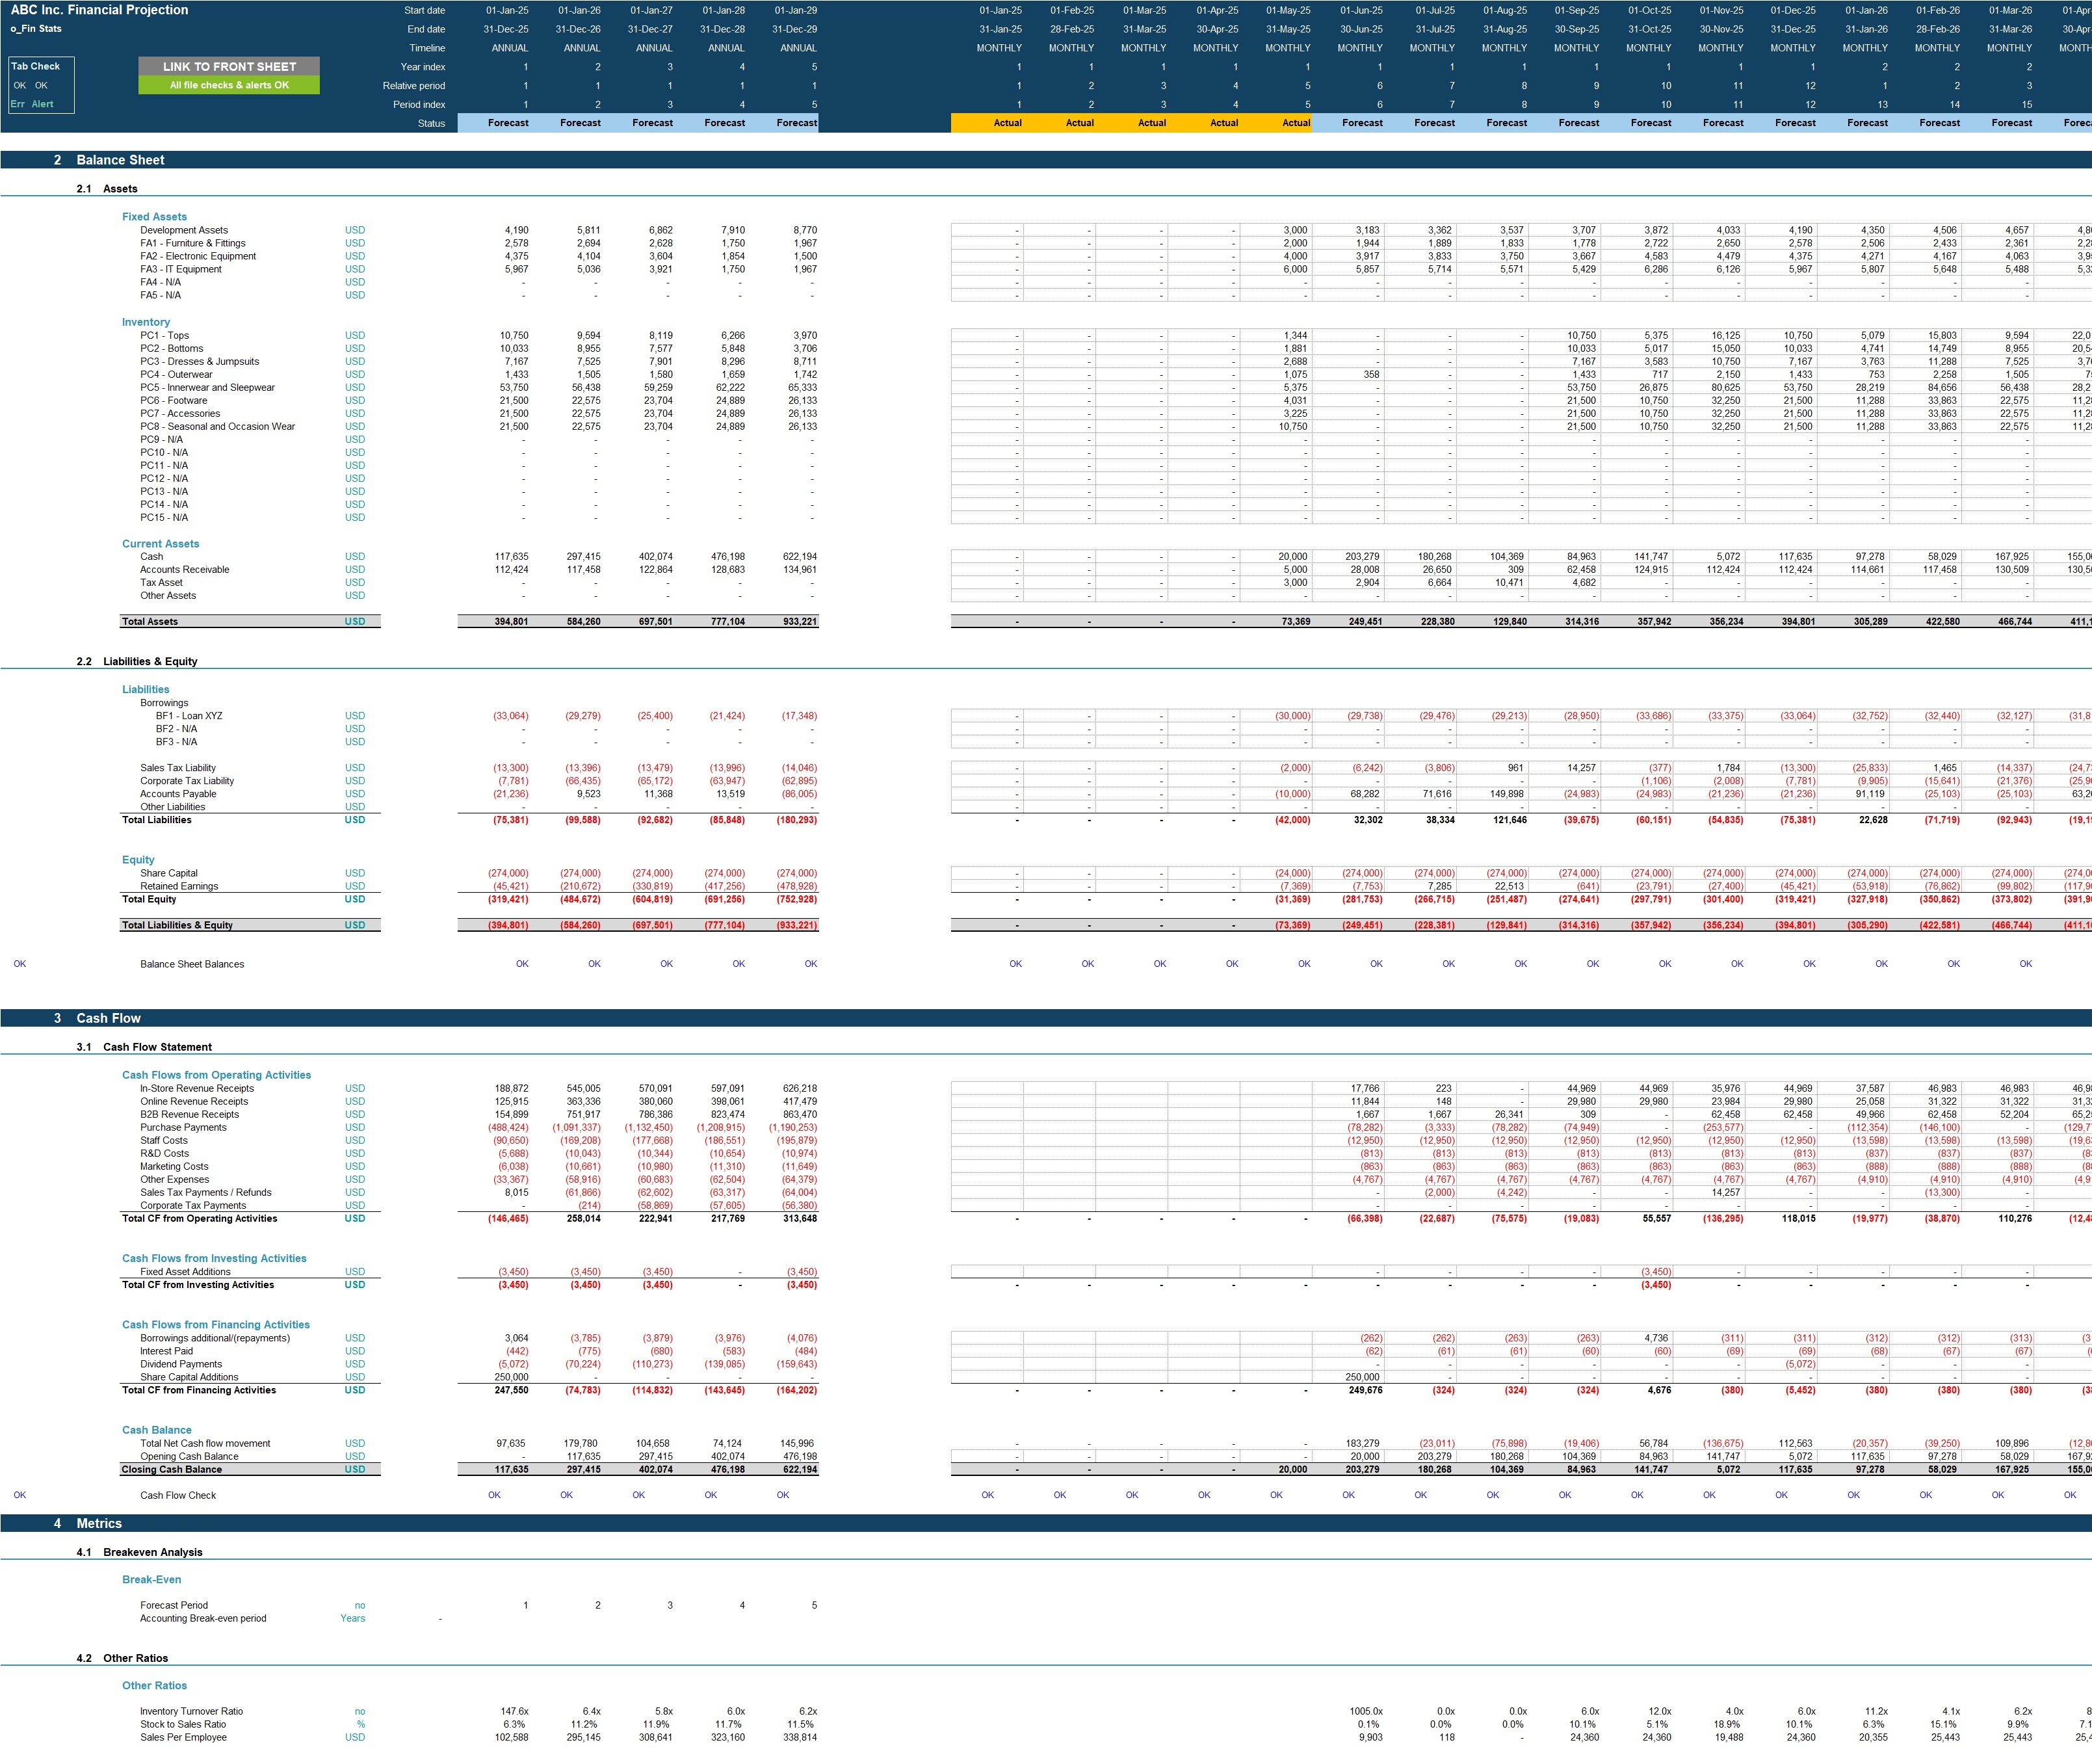
- Projected full financial statements (Income Statement, Balance Sheet and Cash flow Statement) presented on a monthly basis across 5 years and summarised on an annual basis.
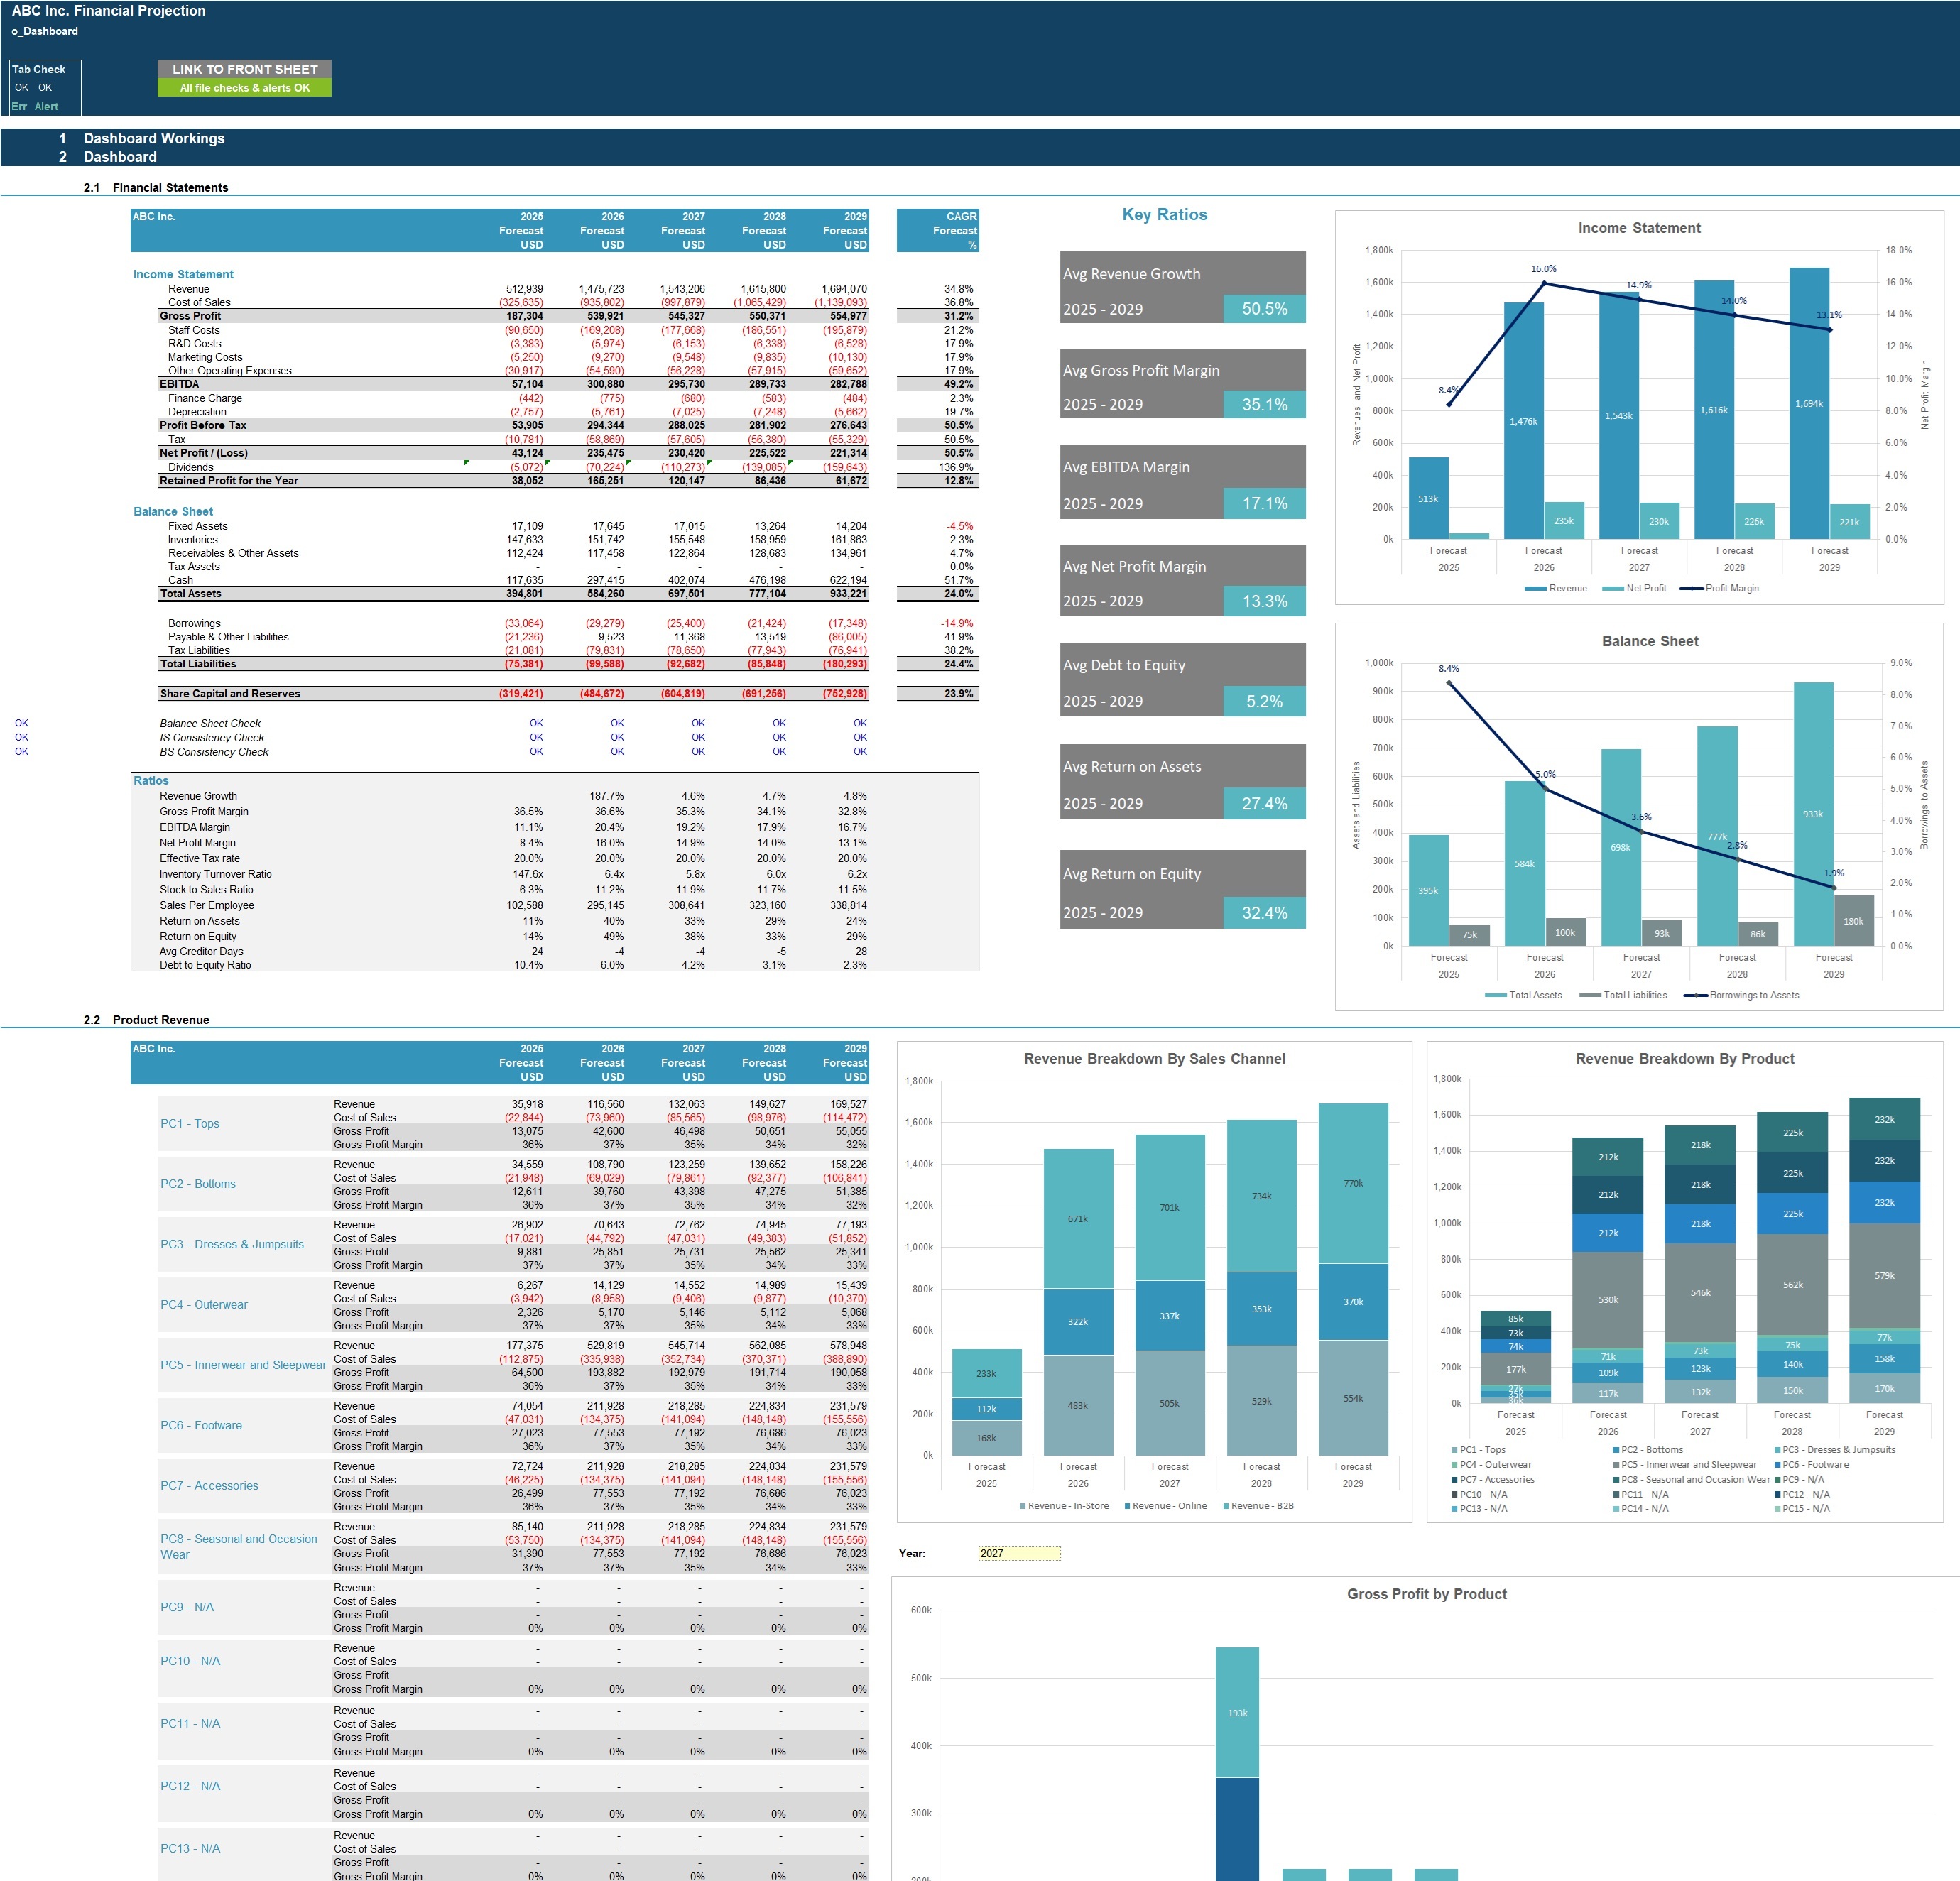
- Dashboard with:
o Summarised projected Income Statement and Balance Sheet;
o Compounded Annual Growth Rate (CAGR) for each summarised income statement and balance sheet line item;
o Key ratios including inventory turnover, stock to sales ratio, sales per employee, average revenue growth, average profit margins, average return on assets and equity and average debt to equity ratio;
o Tables and Bar charts summarising revenue and gross profit by product category
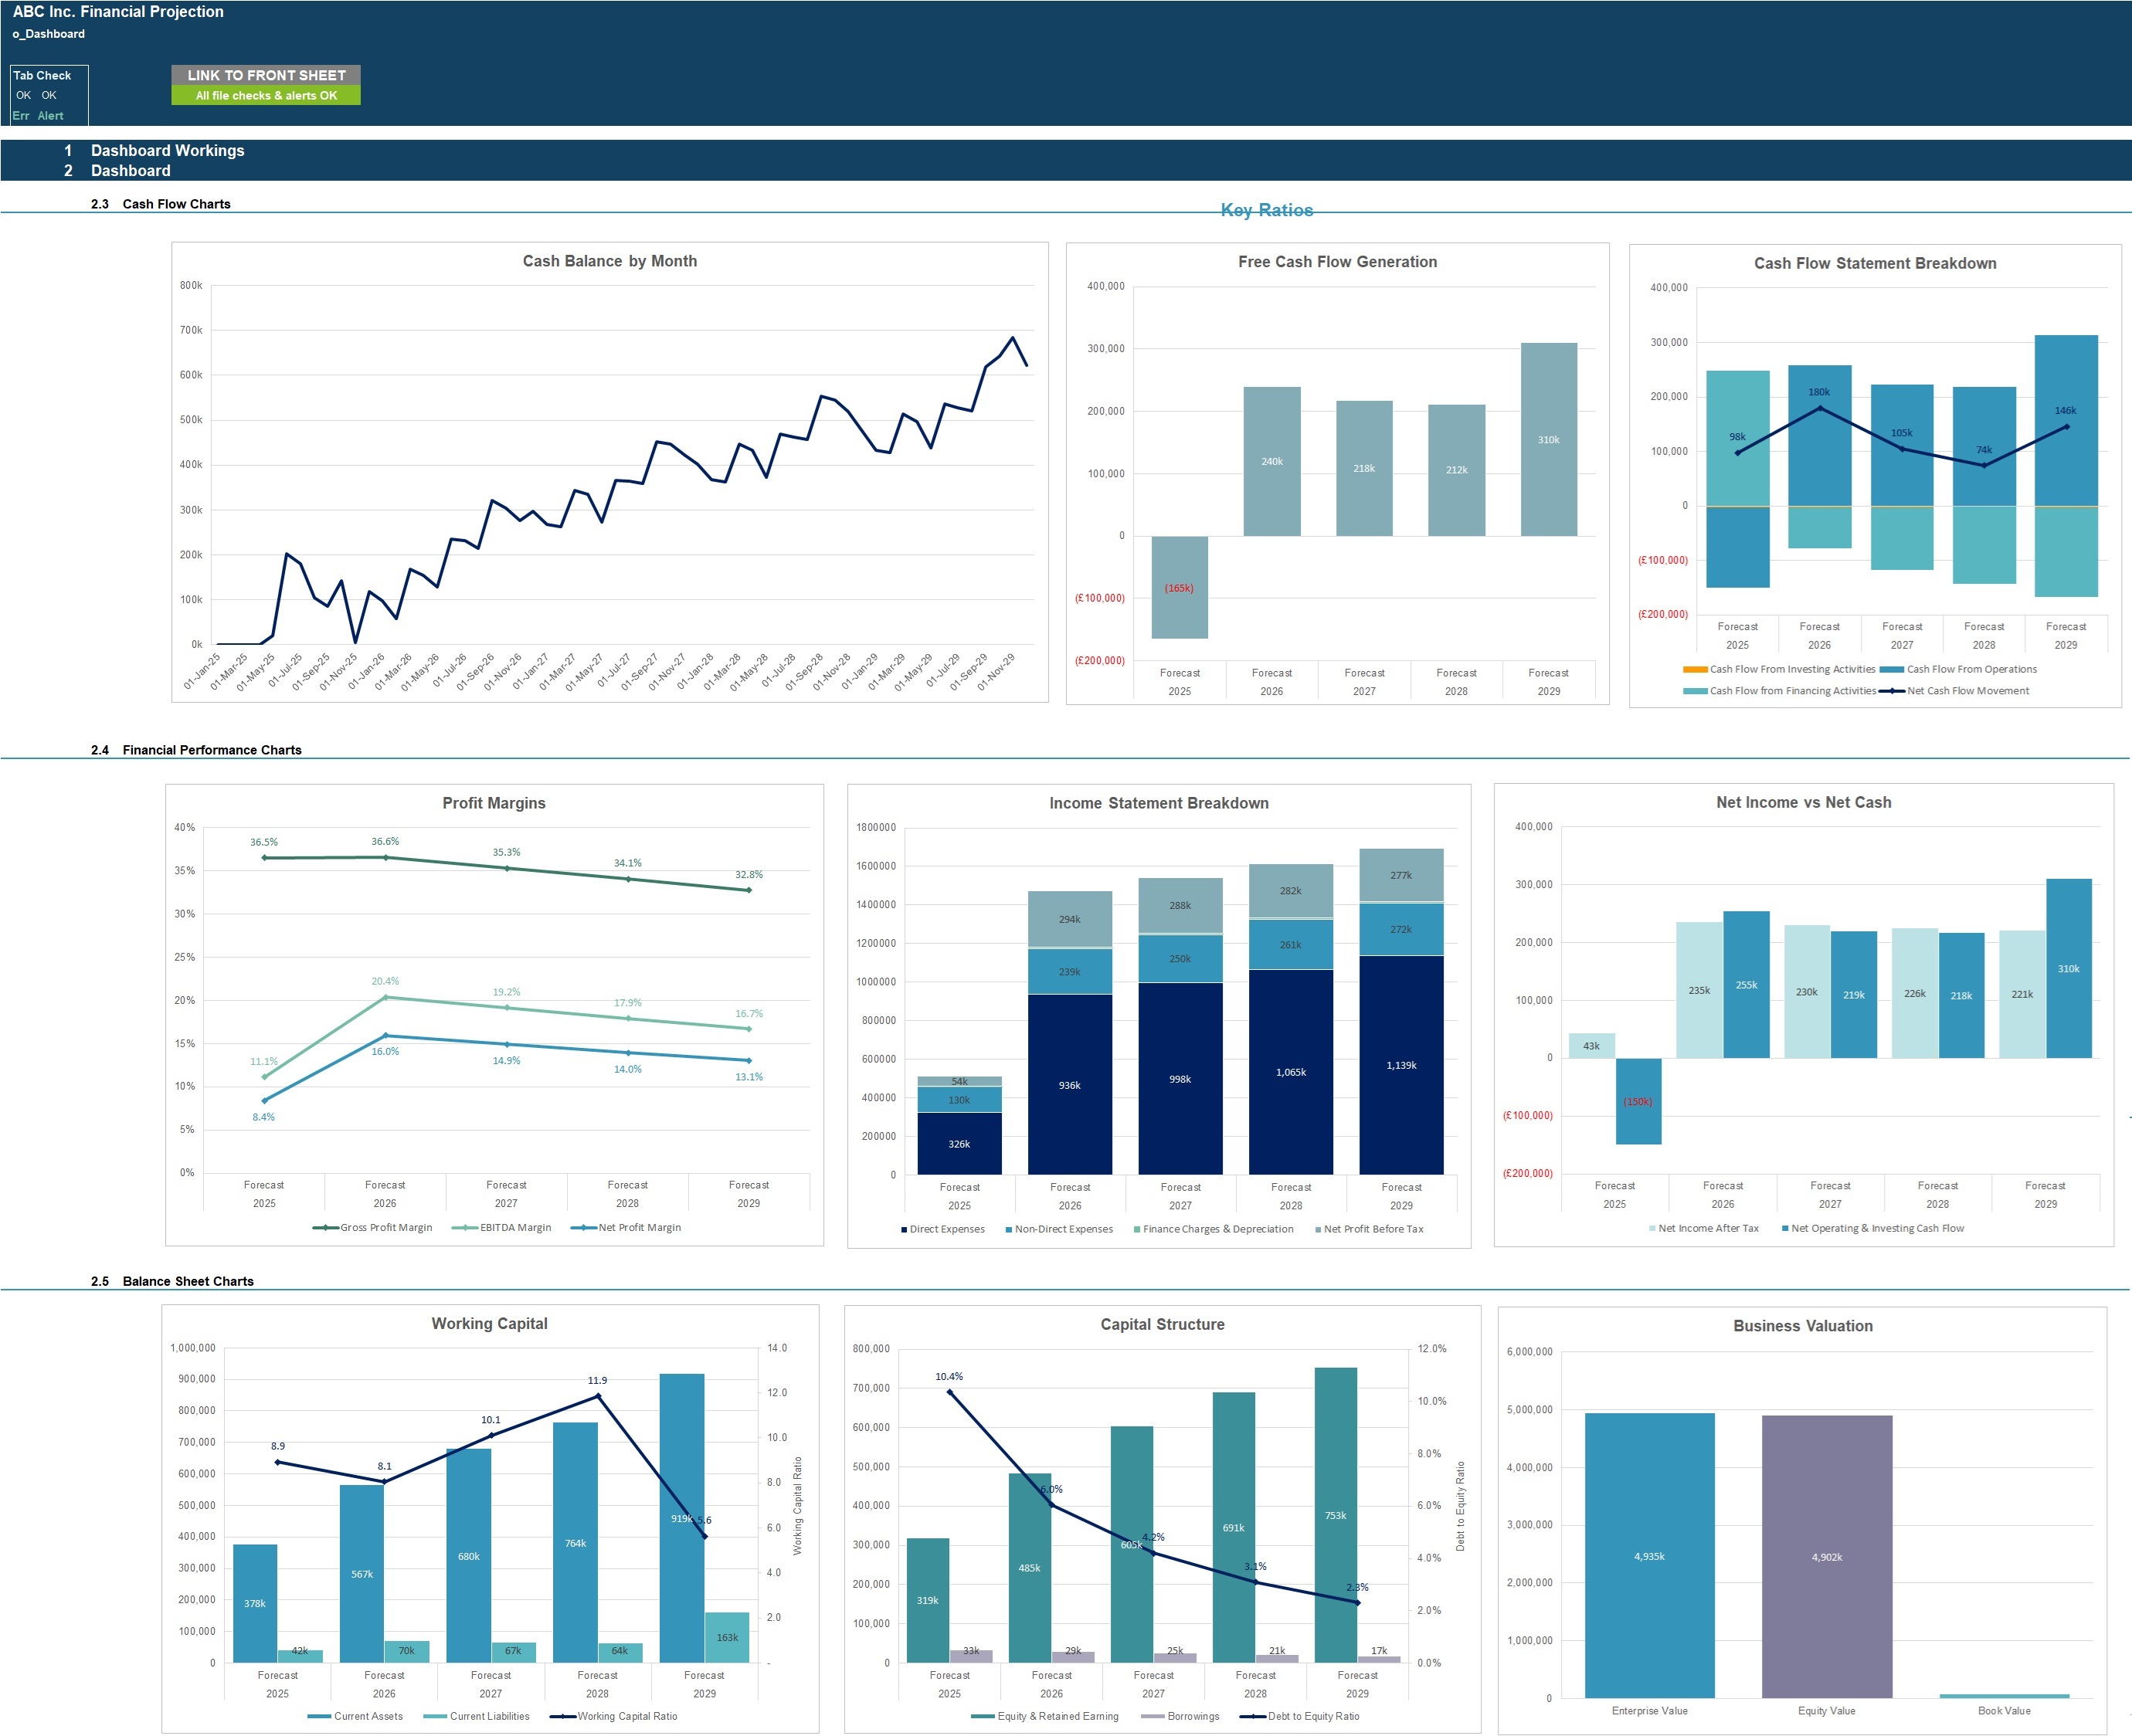
o Charts and graphs showing: cash balance by month, free cash flow generation, cash flow statement breakdown, profit margins, income statement breakdown, net cash vs net income, working capital, valuation and capital structure.
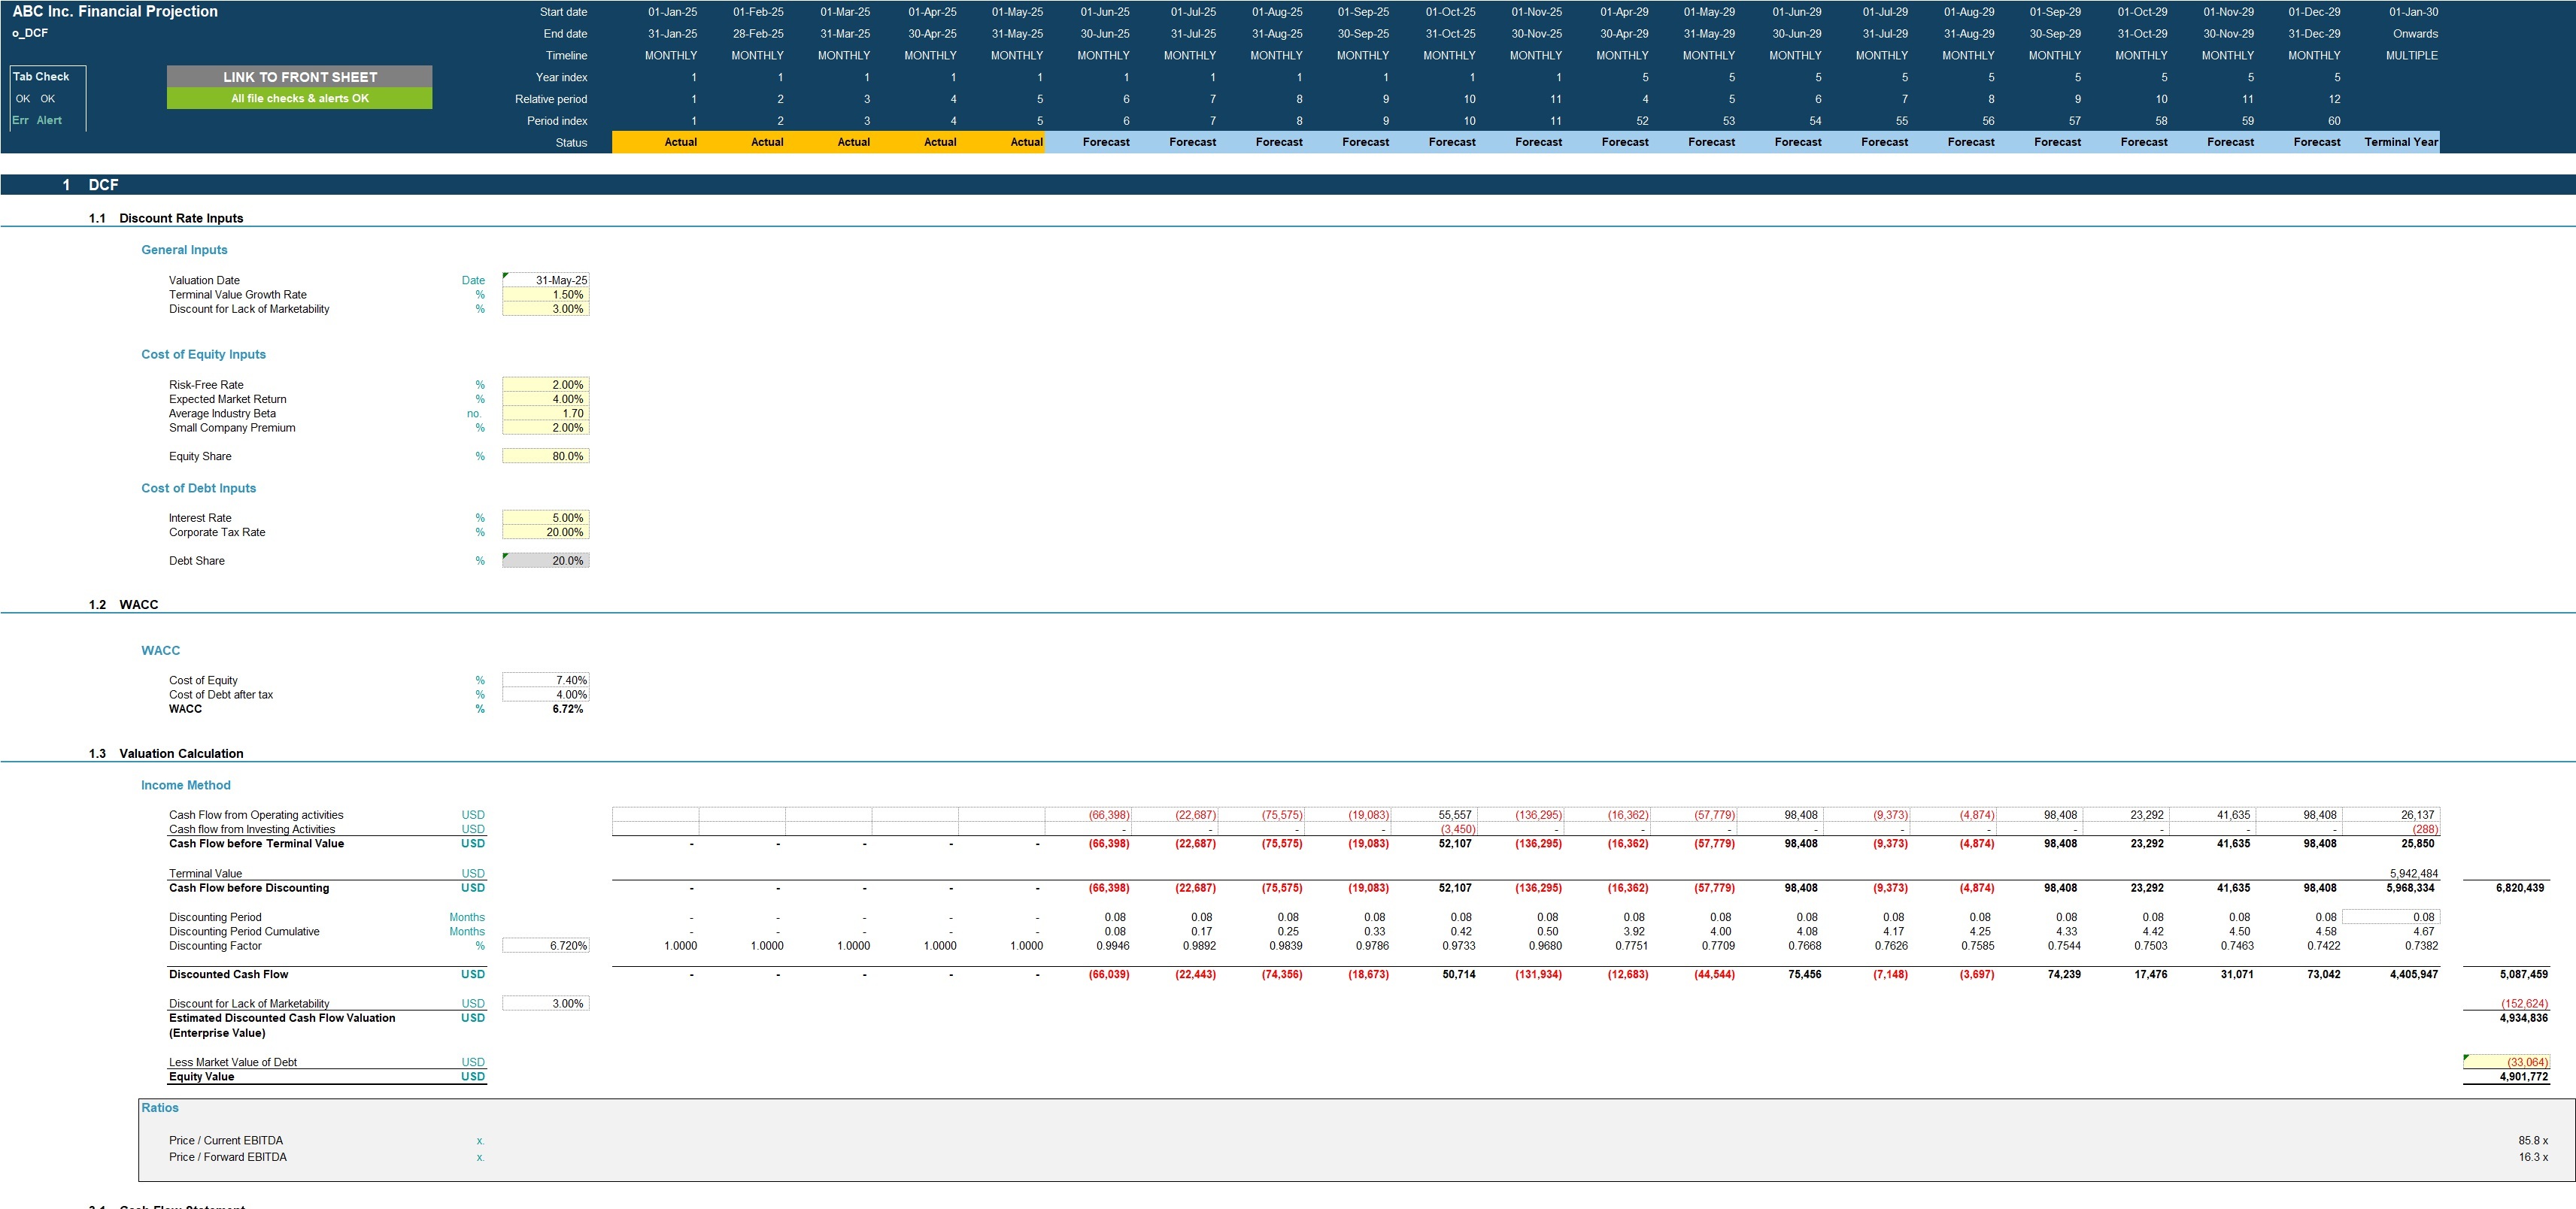
- Discounted cash flow valuation using the projected cash flow output.
- Breakeven analysis
KEY INPUTS
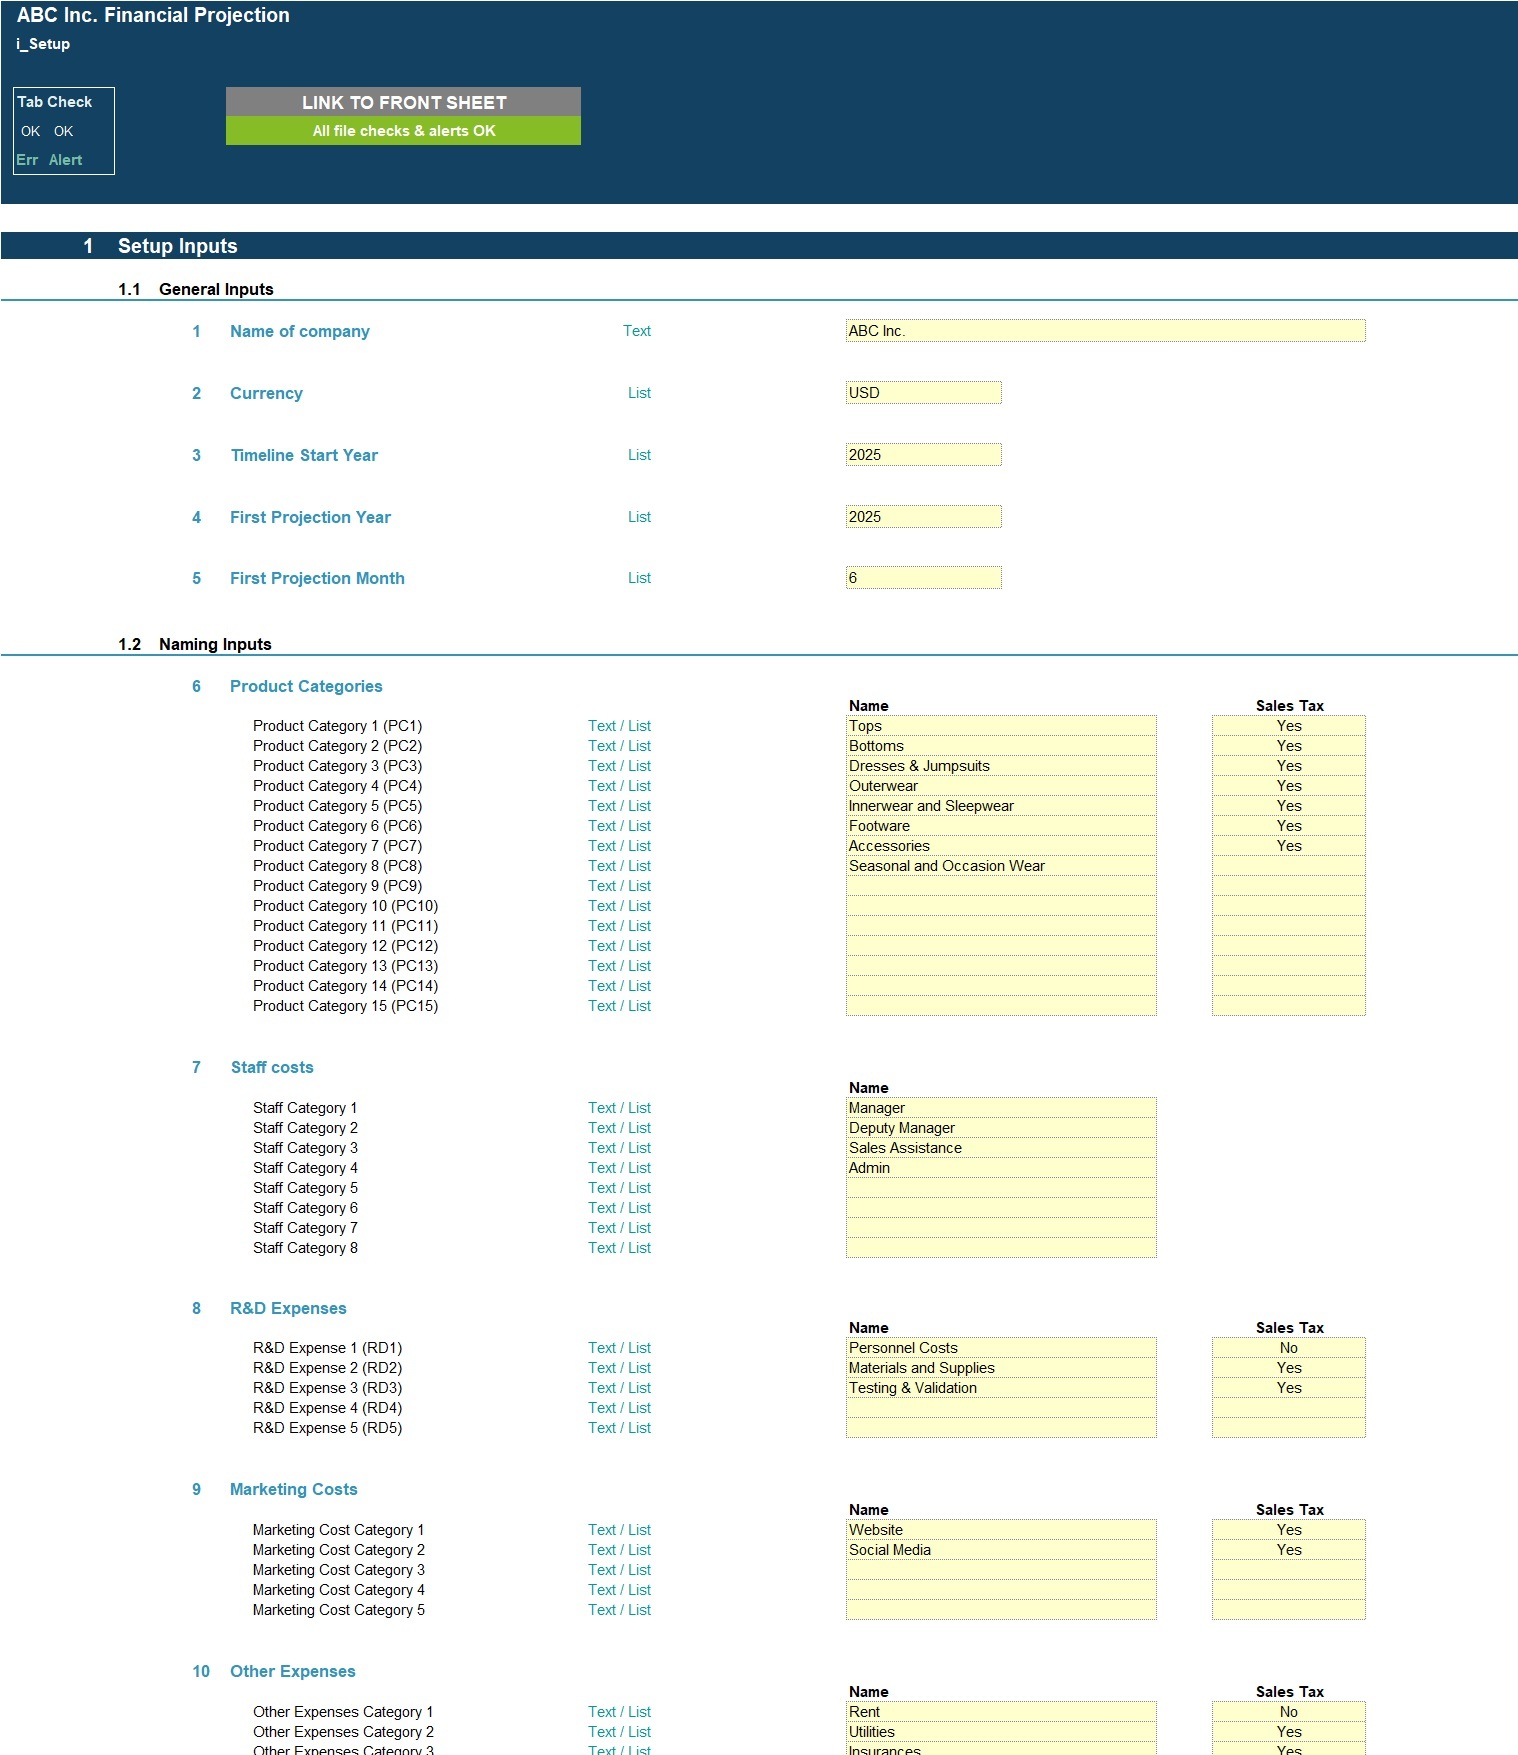
Setup Inputs:
- Name of business;
- Currency;
- First projection year and month;
- Naming for product categories, staff costs, R&D costs, marketing costs, admin costs, fixed assets and borrowings;
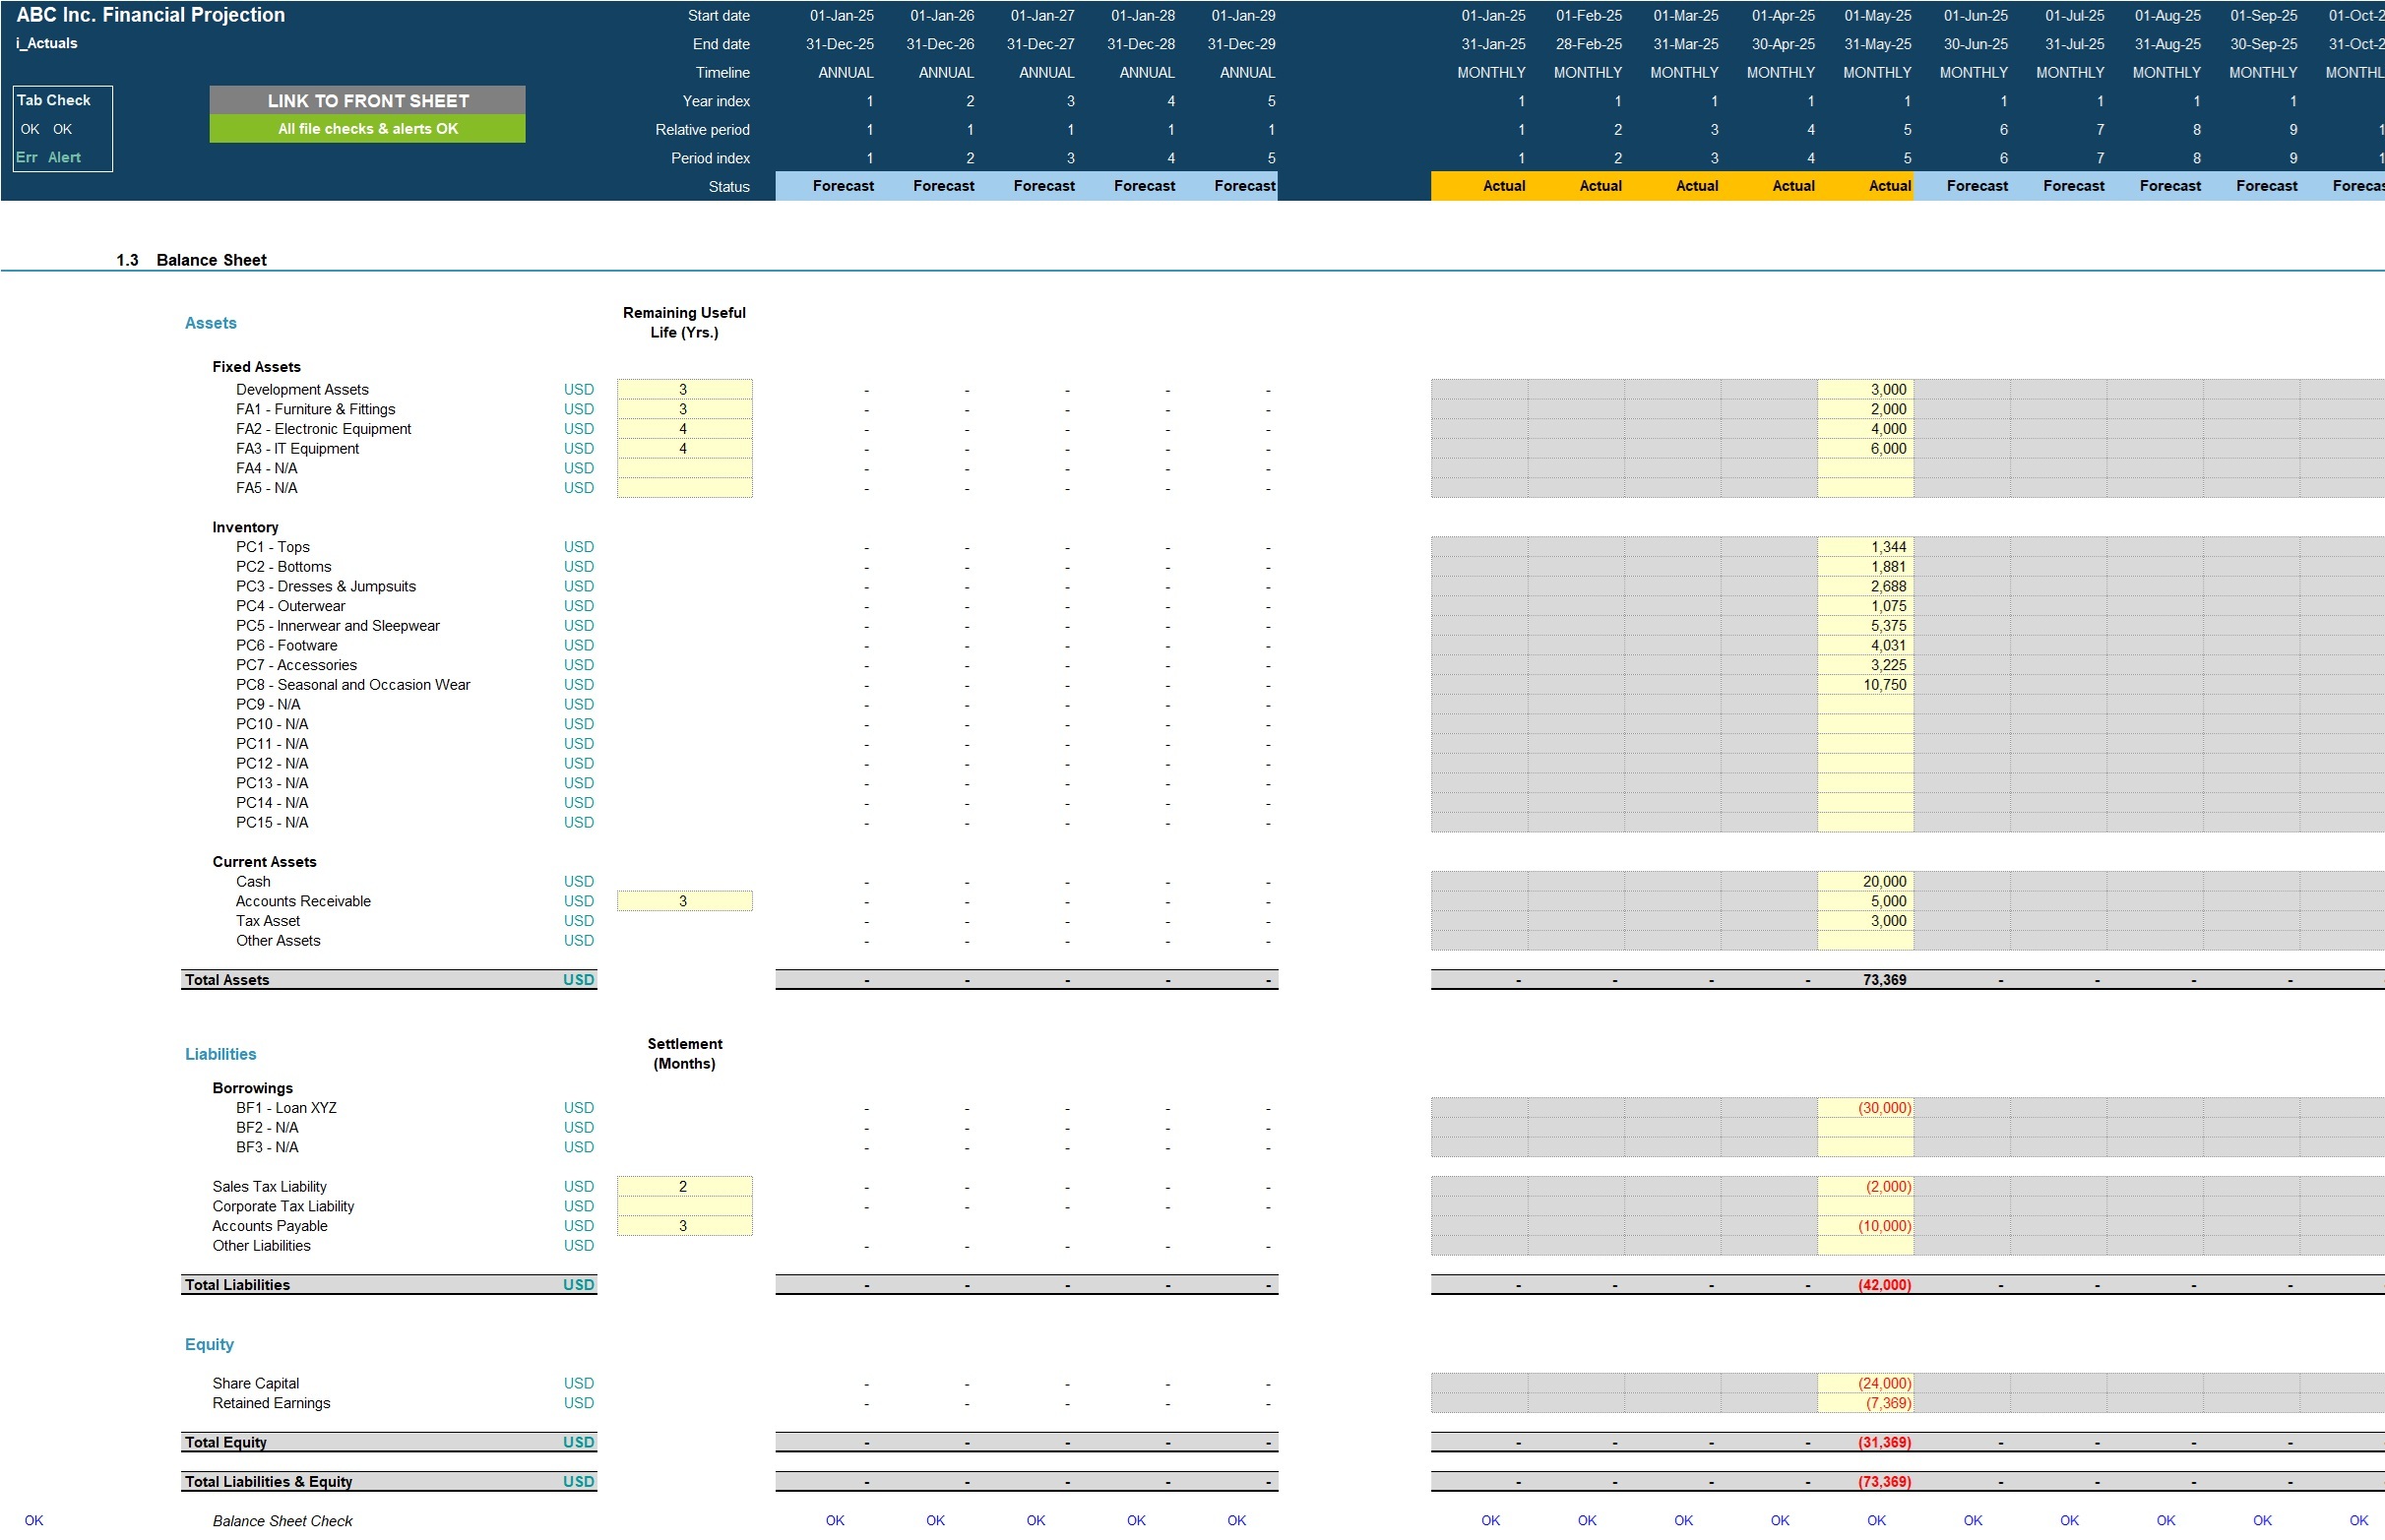
Actuals Inputs:
- Opening balance sheet (for existing businesses);
- Income Statement actuals (for trend analysis);
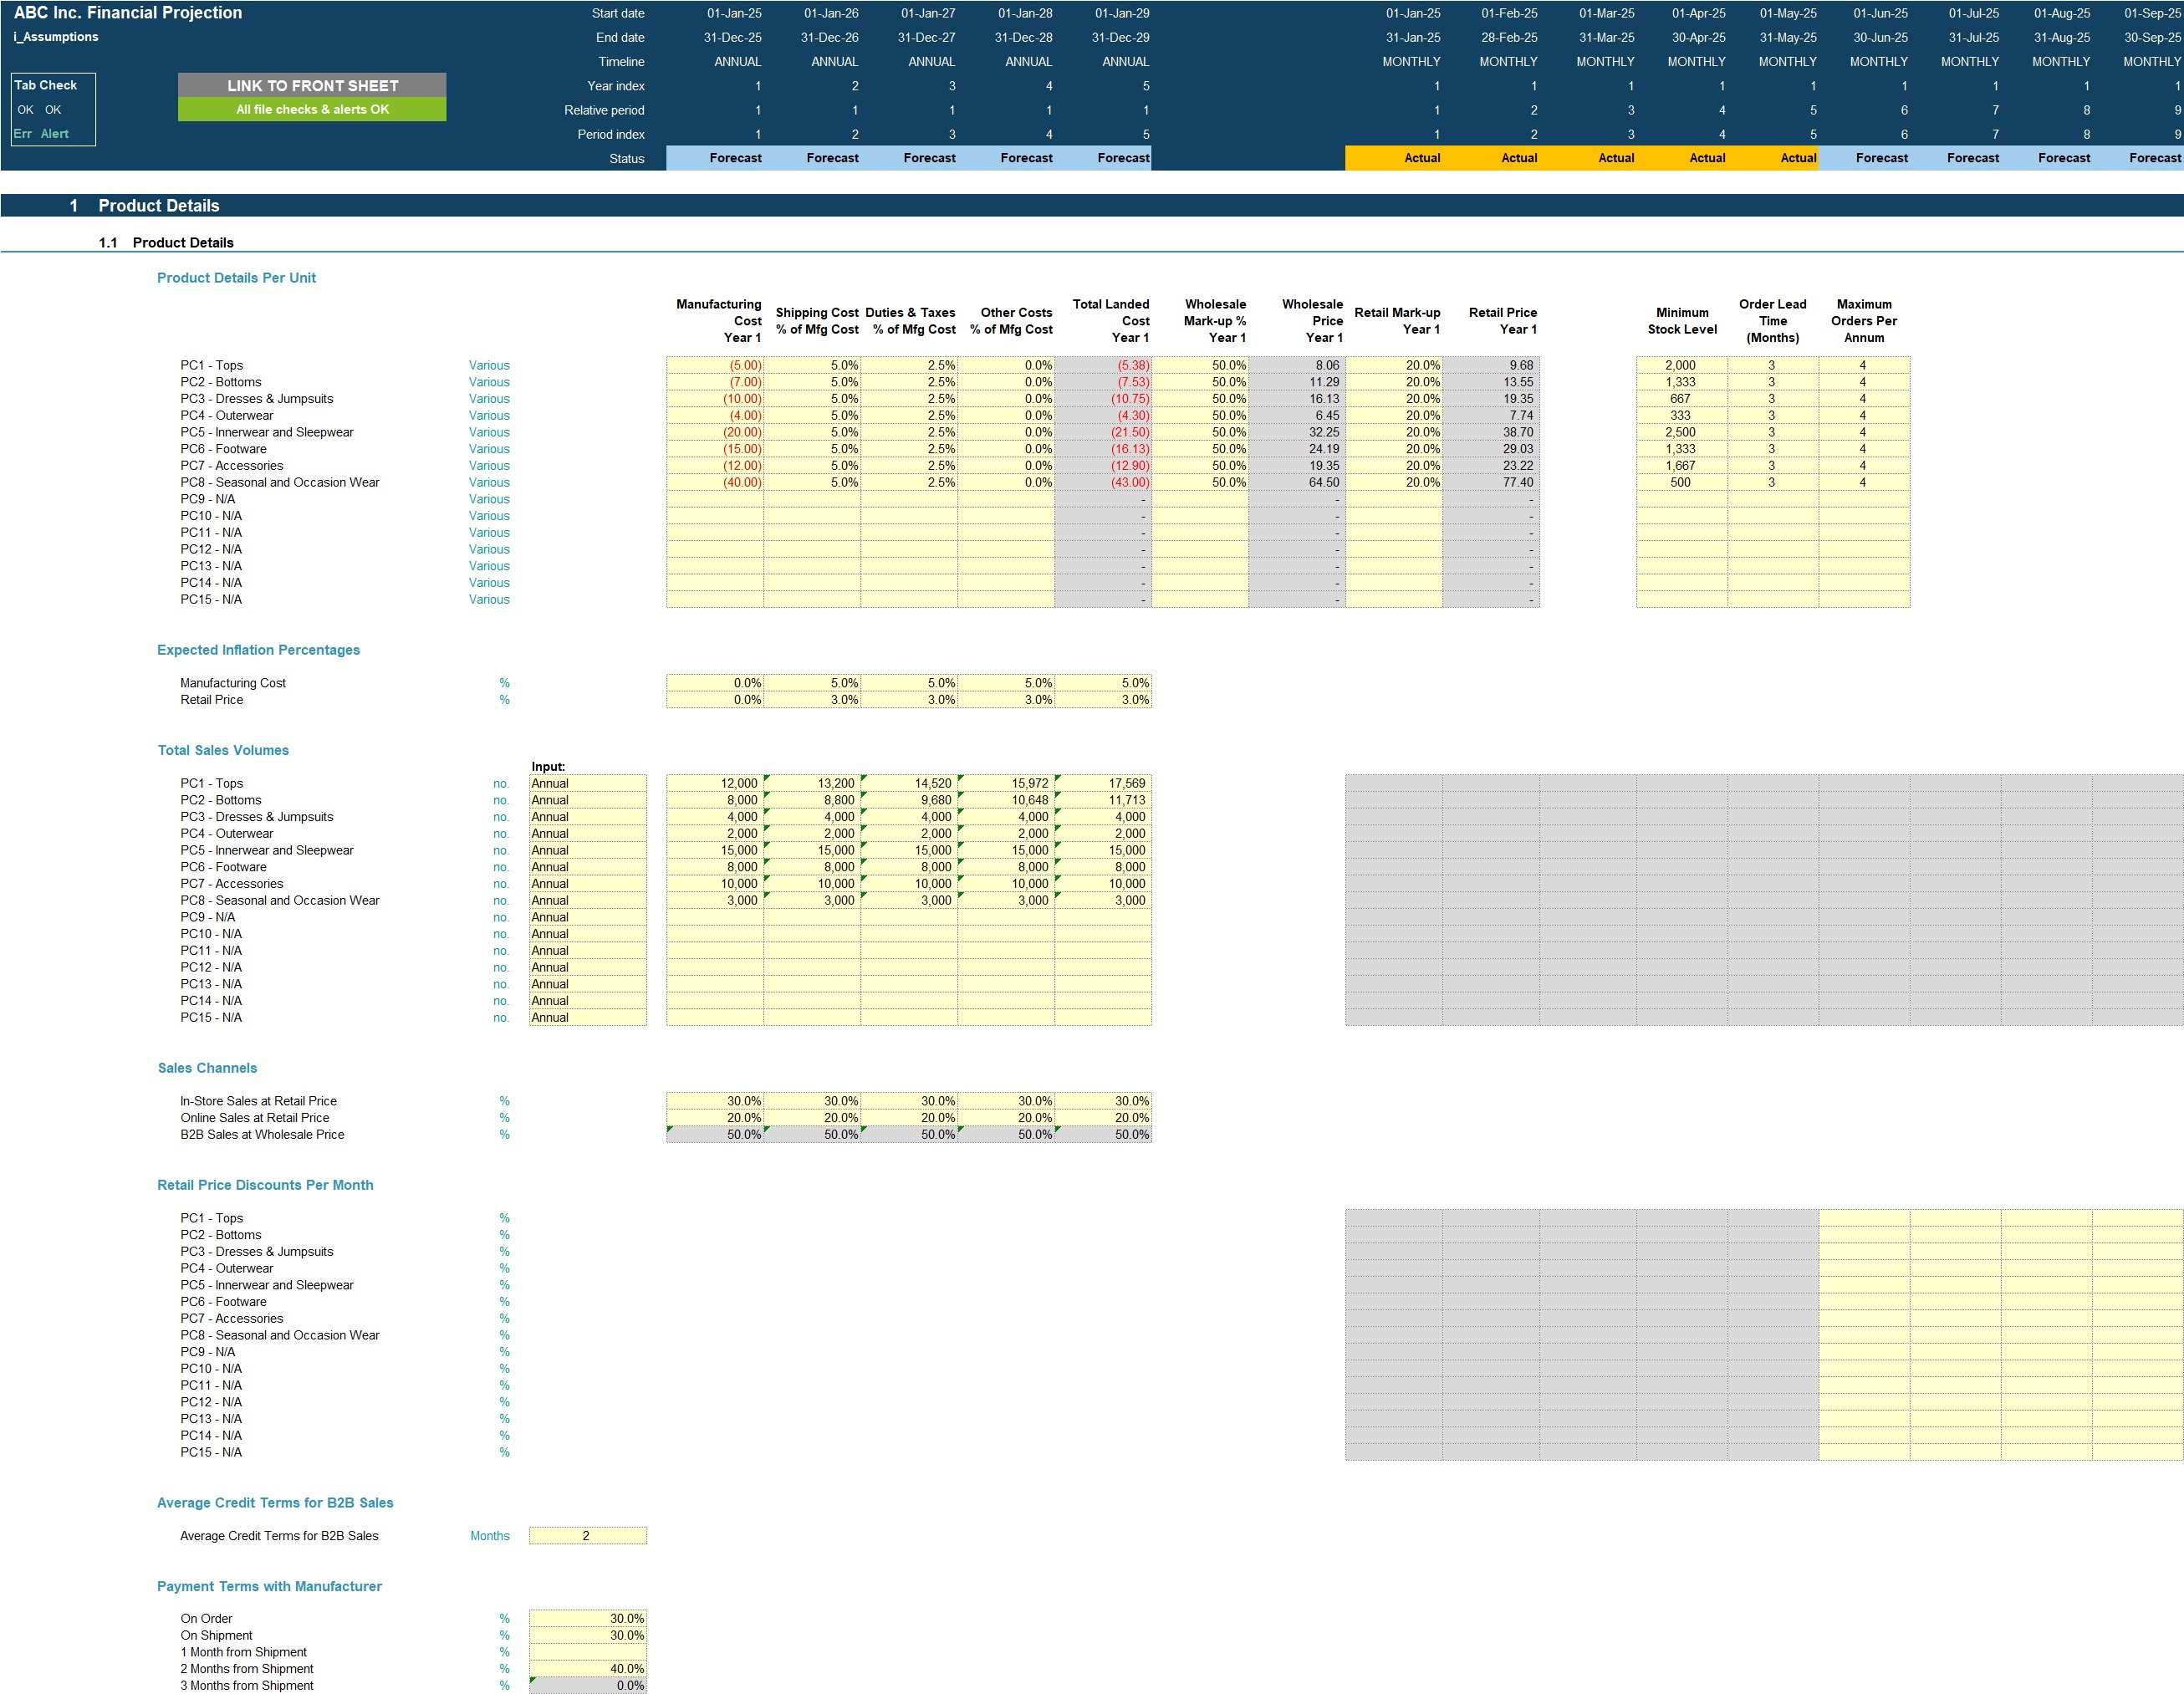
Projection Inputs:
- Product details including manufacturing costs, other landed costs, cost inflation, wholesale mark-up percentage, retail mark-up percentage, minimum stock level, production lead times, ordering frequency per annum and payment structure to manufacturer;
- Revenue inputs including sales volumes, price inflation, split by sales channel, credit terms offered for B2B sales;
- R&D Costs including capitalizable and non-capitalisable portions and useful life for capitalizable portion;
- Other costs inputs including admin staff costs, marketing costs and admin costs;
- Sales and corporate tax inputs including rate and payment periods;
- Dividend inputs including amount (percentage of retained earnings) and frequency;
- Fixed Assets including addition amounts and useful life;
- Borrowings including addition amounts and interest rate;
- Share Capital additions;
- Discount rate inputs (for valuation calculation).
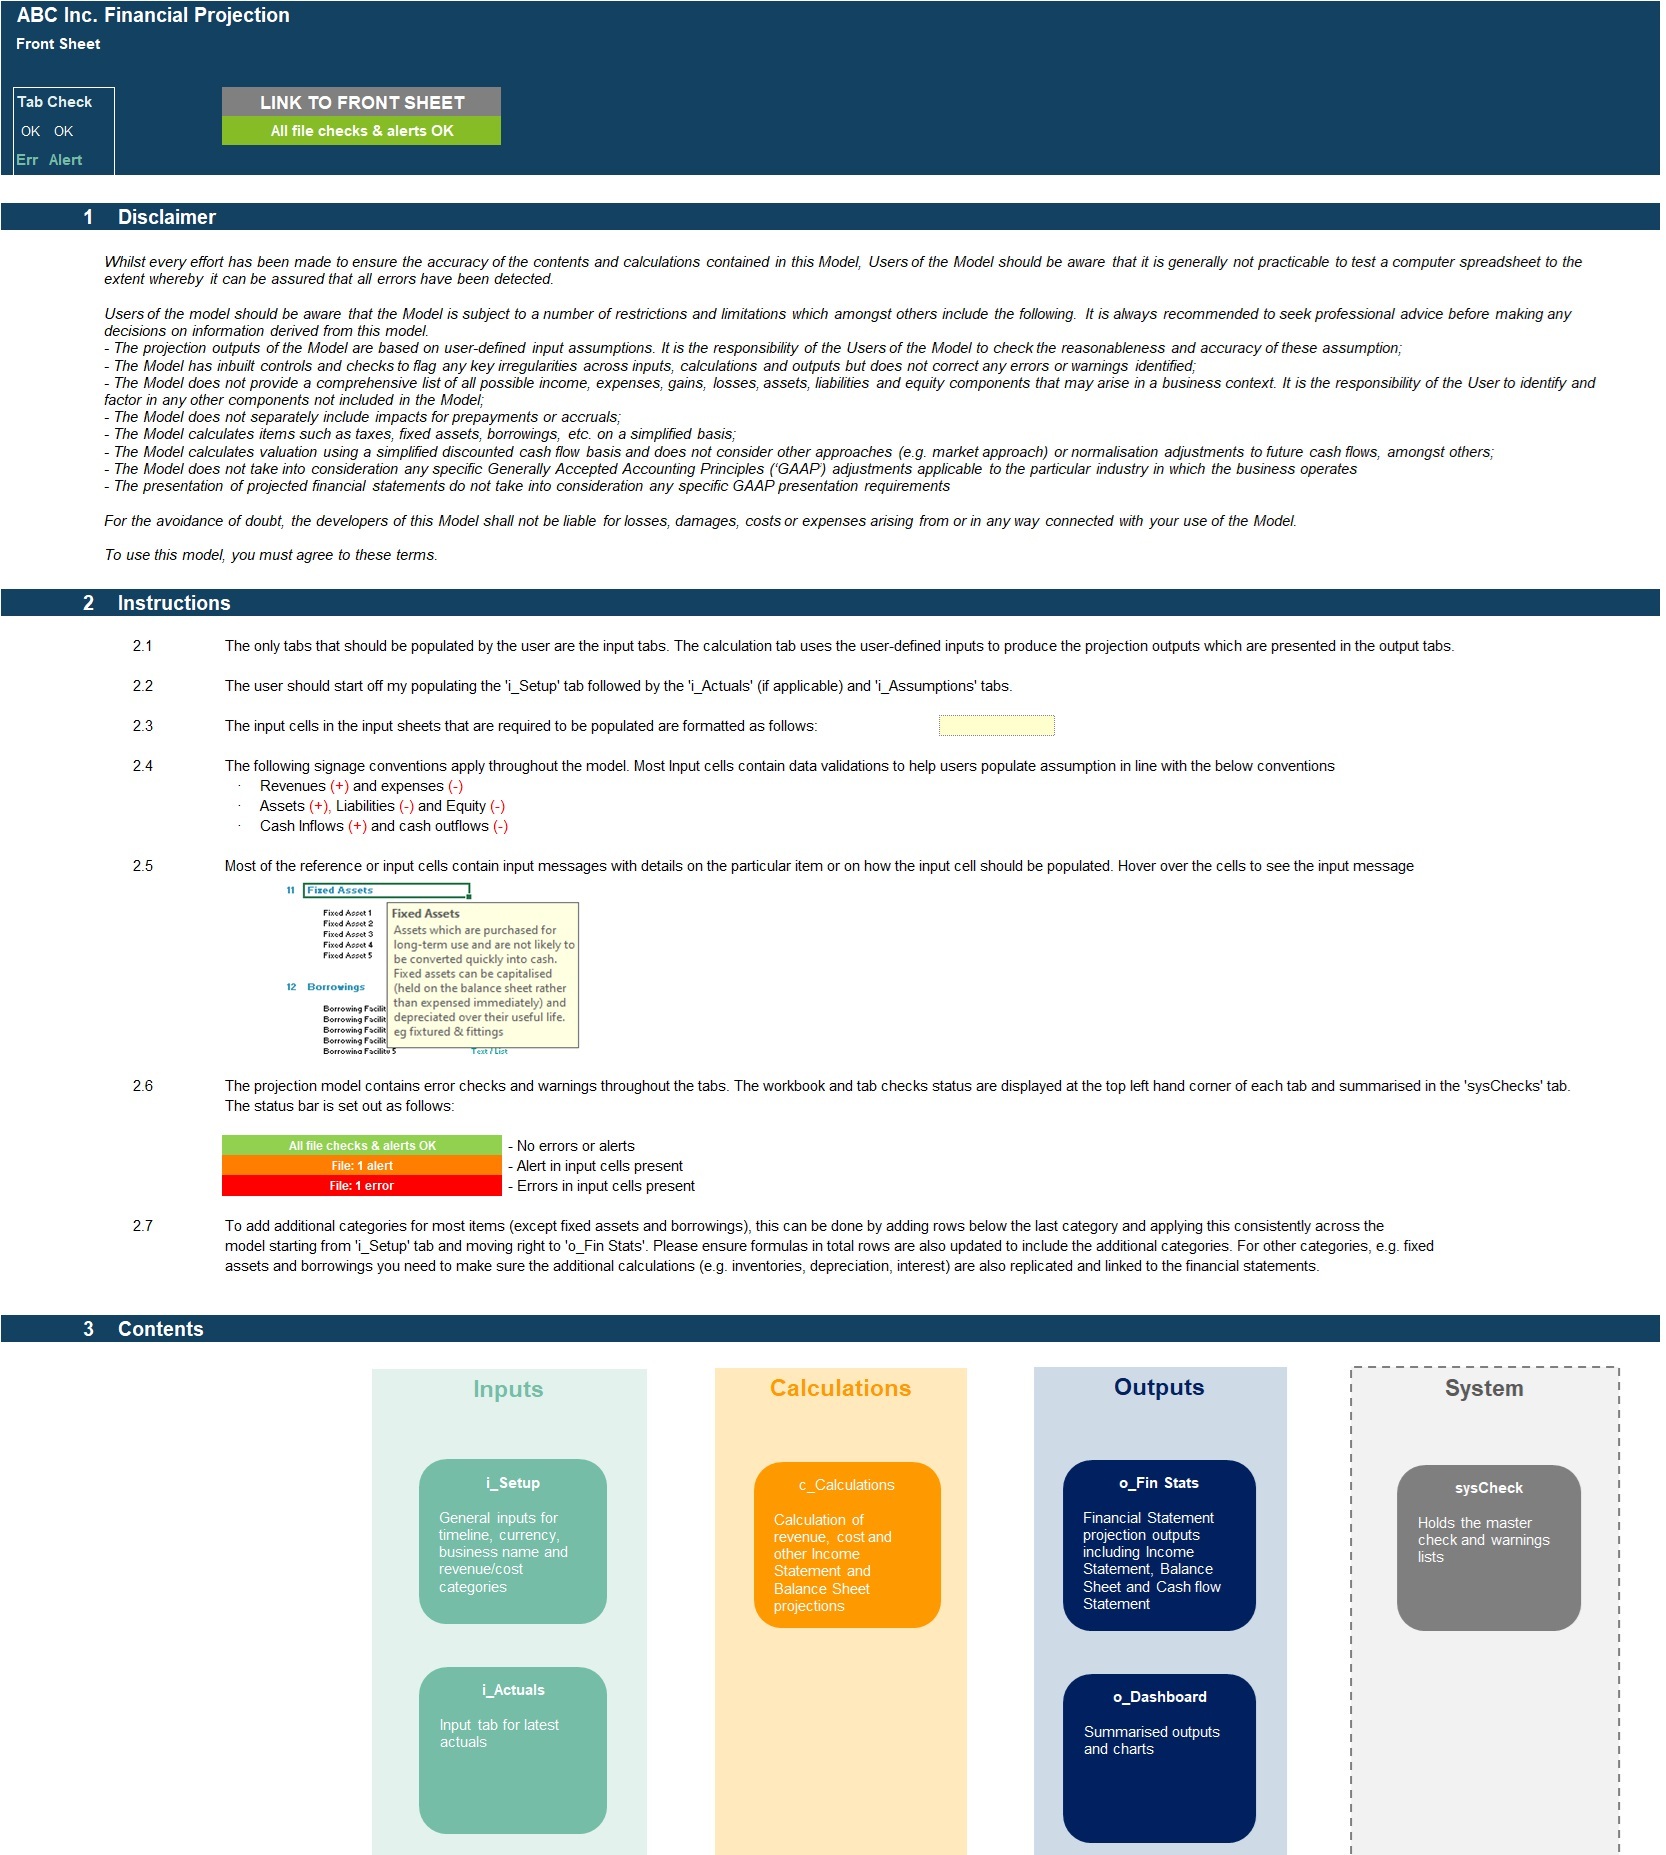
MODEL STRUCTURE
The model comprises of 9 tabs split into input ('i_'), calculation ('c_'), output ('o_’) and system tabs. The tabs to be populated by the user are the input tabs ('i_Setup', ‘i_Actuals’ and 'i_Assumptions'). The calculation tab uses the user-defined inputs to calculate and produce the projection outputs which are presented in 'o_Fin Stats', ‘o_Dashboard’ and ‘o_DCF’.
KEY FEATURES
- The model contains a flexible timeline that allows for a mix of actual and forecast periods across a 5-year period. This allows projections to be easily rolled forward as forecast periods become actual period;
- Timeline is split on a monthly basis and summarised on an annual basis;
- The model is not password protected and can be modified as required following download;
- The model allows the user to model up to 15 product categories each with their own unique combination of retail and wholesale prices, sales demand, manufacturing and other landed costs, ordering cycles, production lead times, and minimum stock quantities;
- The model allows for the following number of underlying categories for each line item (these can be easily expanded if required):
o Product categories – 15 categories;
o Staff costs – 8 categories;
o R&D Costs – 5 categories;
o Marketing costs – 5 categories;
o Other expenses – 15 categories;
o Fixed assets – 5 categories;
o Borrowings – 3 facilities
- Apart from projecting revenue and costs the model includes the possibility to model fixed assets, borrowings (amortising), dividends and corporate tax;
- Business name, currency, starting projection period are fully customisable;
- Revenue, cost and fixed asset descriptions are fully customisable;
- The model included an integrated discounted cash flow valuation using the projected cash flow outputs;
- The model includes instructions, line-item explanations, checks and input validations to help ensure input fields are populated accurately;
- The model includes a checks dashboard which summarises all the checks included in the various tabs making it easier to identify any errors.
SUPPORT / MODIFICATIONS
We are keen to ensure our customers are satisfied and find the models useful for their financial projection needs. Our models are developed with the user in mind and include instructions, line-item explanations, checks and input validations to ensure they are as user-friendly and easy to use as possible without requiring extensive knowledge of Microsoft Excel, finance or accounting. If any questions do arise, we are more than happy to assist. We are also happy to support with any be-spoke modifications you may require to the models to better suit your business needs. To get in touch, please send us a message through this website.
We are also always keen to receive feedback so please do let us know what you think of our models by sending us a message or submitting a review.
ABOUT PROJECTIFY
We are financial modelling professionals with experience working in big 4 business modelling teams and strong experience supporting businesses with their financial modelling and decision support needs. Our aim is to provide robust and easy-to-use tools that follow good practice financial modelling guidelines and assist individuals and businesses with their financial projection and analysis requirements.
MODEL OVERVIEW
Contract manufacturing is a business arrangement where a company hires a third-party manufacturer to produce its products based on the company's specifications, design, and branding. The hiring company retains ownership of the product concept and often handles marketing and sales, while the contract manufacturer handles the actual production process. This approach allows businesses to reduce costs, speed up production, and focus on core functions like design, marketing, and sales.
Our highly versatile and user-friendly Excel model allows for the preparation of an 5-year rolling 3 statement (Income Statement, Balance Sheet and Cash flow Statement) financial projection with a monthly timeline for a startup or existing business outsourcing manufacturing.
The model allows the user to model up to 15 product categories across 3 sales channels (retail in-store, retail online and/or B2B wholesale) with full manufacturing and other landed costs, detailed payment structure, production lead times, ordering cycles, inventory calculations and R&D costs. In addition model includes projections for staff costs, marketing costs, other operating costs, fixed assets, borrowings, sales tax, corporate tax and dividend distributions.
The model follows good practice financial modelling principles and includes instructions, line-item explanations, checks and input validations and incorporates a discounted cash flow valuation calculation using the projected cash flows.
KEY OUTPUTS
- Projected full financial statements (Income Statement, Balance Sheet and Cash flow Statement) presented on a monthly basis across 5 years and summarised on an annual basis.
- Dashboard with:
o Summarised projected Income Statement and Balance Sheet;
o Compounded Annual Growth Rate (CAGR) for each summarised income statement and balance sheet line item;
o Key ratios including inventory turnover, stock to sales ratio, sales per employee, average revenue growth, average profit margins, average return on assets and equity and average debt to equity ratio;
o Tables and Bar charts summarising revenue and gross profit by product category
o Charts and graphs showing: cash balance by month, free cash flow generation, cash flow statement breakdown, profit margins, income statement breakdown, net cash vs net income, working capital, valuation and capital structure.
- Discounted cash flow valuation using the projected cash flow output.
- Breakeven analysis
KEY INPUTS
Setup Inputs:
- Name of business;
- Currency;
- First projection year and month;
- Naming for product categories, staff costs, R&D costs, marketing costs, admin costs, fixed assets and borrowings;
Actuals Inputs:
- Opening balance sheet (for existing businesses);
- Income Statement actuals (for trend analysis);
Projection Inputs:
- Product details including manufacturing costs, other landed costs, cost inflation, wholesale mark-up percentage, retail mark-up percentage, minimum stock level, production lead times, ordering frequency per annum and payment structure to manufacturer;
- Revenue inputs including sales volumes, price inflation, split by sales channel, credit terms offered for B2B sales;
- R&D Costs including capitalizable and non-capitalisable portions and useful life for capitalizable portion;
- Other costs inputs including admin staff costs, marketing costs and admin costs;
- Sales and corporate tax inputs including rate and payment periods;
- Dividend inputs including amount (percentage of retained earnings) and frequency;
- Fixed Assets including addition amounts and useful life;
- Borrowings including addition amounts and interest rate;
- Share Capital additions;
- Discount rate inputs (for valuation calculation).
MODEL STRUCTURE
The model comprises of 9 tabs split into input ('i_'), calculation ('c_'), output ('o_’) and system tabs. The tabs to be populated by the user are the input tabs ('i_Setup', ‘i_Actuals’ and 'i_Assumptions'). The calculation tab uses the user-defined inputs to calculate and produce the projection outputs which are presented in 'o_Fin Stats', ‘o_Dashboard’ and ‘o_DCF’.
KEY FEATURES
- The model contains a flexible timeline that allows for a mix of actual and forecast periods across a 5-year period. This allows projections to be easily rolled forward as forecast periods become actual period;
- Timeline is split on a monthly basis and summarised on an annual basis;
- The model is not password protected and can be modified as required following download;
- The model allows the user to model up to 15 product categories each with their own unique combination of retail and wholesale prices, sales demand, manufacturing and other landed costs, ordering cycles, production lead times, and minimum stock quantities;
- The model allows for the following number of underlying categories for each line item (these can be easily expanded if required):
o Product categories – 15 categories;
o Staff costs – 8 categories;
o R&D Costs – 5 categories;
o Marketing costs – 5 categories;
o Other expenses – 15 categories;
o Fixed assets – 5 categories;
o Borrowings – 3 facilities
- Apart from projecting revenue and costs the model includes the possibility to model fixed assets, borrowings (amortising), dividends and corporate tax;
- Business name, currency, starting projection period are fully customisable;
- Revenue, cost and fixed asset descriptions are fully customisable;
- The model included an integrated discounted cash flow valuation using the projected cash flow outputs;
- The model includes instructions, line-item explanations, checks and input validations to help ensure input fields are populated accurately;
- The model includes a checks dashboard which summarises all the checks included in the various tabs making it easier to identify any errors.
SUPPORT / MODIFICATIONS
We are keen to ensure our customers are satisfied and find the models useful for their financial projection needs. Our models are developed with the user in mind and include instructions, line-item explanations, checks and input validations to ensure they are as user-friendly and easy to use as possible without requiring extensive knowledge of Microsoft Excel, finance or accounting. If any questions do arise, we are more than happy to assist. We are also happy to support with any be-spoke modifications you may require to the models to better suit your business needs. To get in touch, please send us a message through this website.
We are also always keen to receive feedback so please do let us know what you think of our models by sending us a message or submitting a review.
ABOUT PROJECTIFY
We are financial modelling professionals with experience working in big 4 business modelling teams and strong experience supporting businesses with their financial modelling and decision support needs. Our aim is to provide robust and easy-to-use tools that follow good practice financial modelling guidelines and assist individuals and businesses with their financial projection and analysis requirements.
This Best Practice includes
1 Populated Excel Model and 1 Unpopulated Excel Model
Further information
Preparation of a 5-year financial projection on a monthly basis for a new or existing business outsourcing its manufacturing with retail, online and/or B2B revenue streams.
Startup or existing business / investors engaged in the operation of a business outsourcing manufacturing
