
Originally published: 19/10/2024 13:17
Publication number: ELQ-57083-1
View all versions & Certificate
Publication number: ELQ-57083-1
View all versions & Certificate

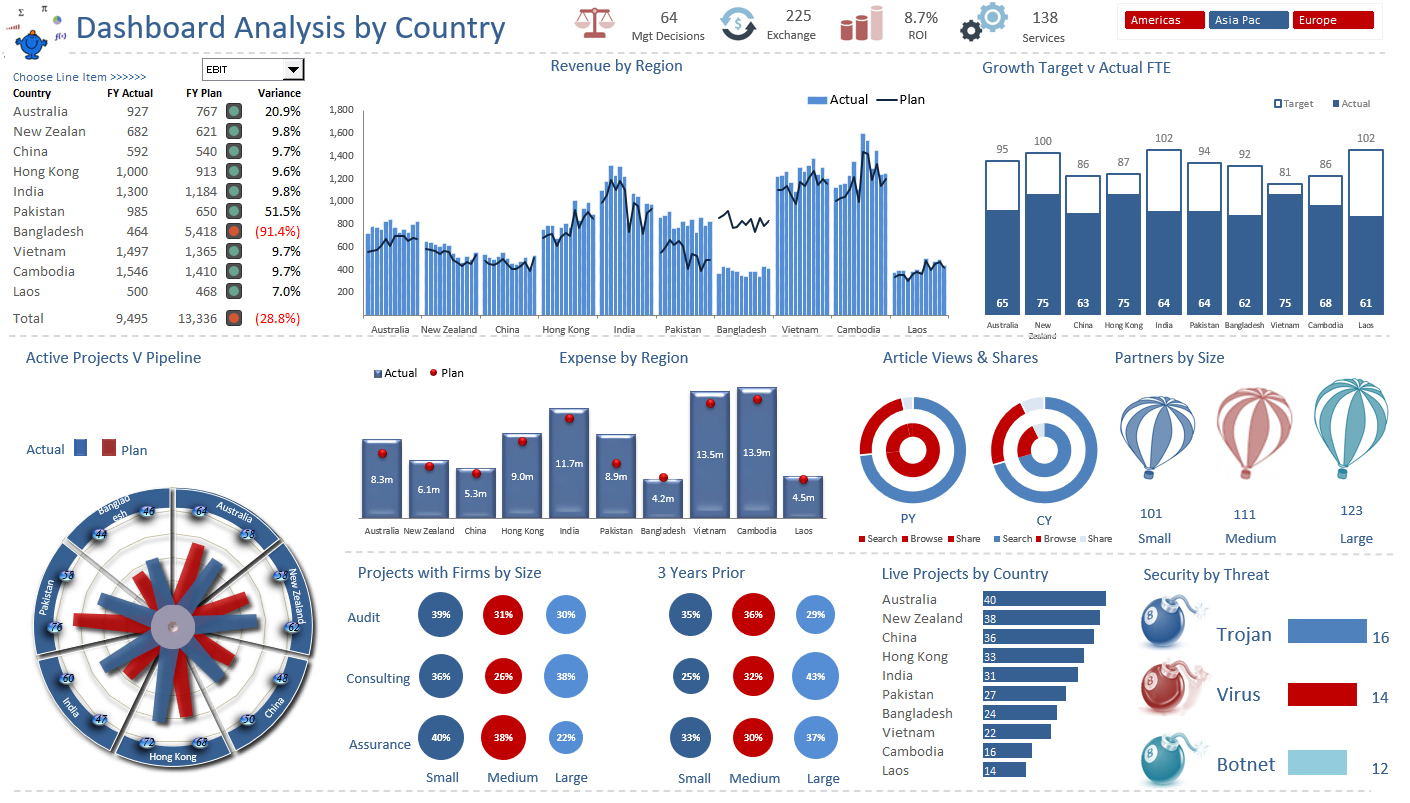
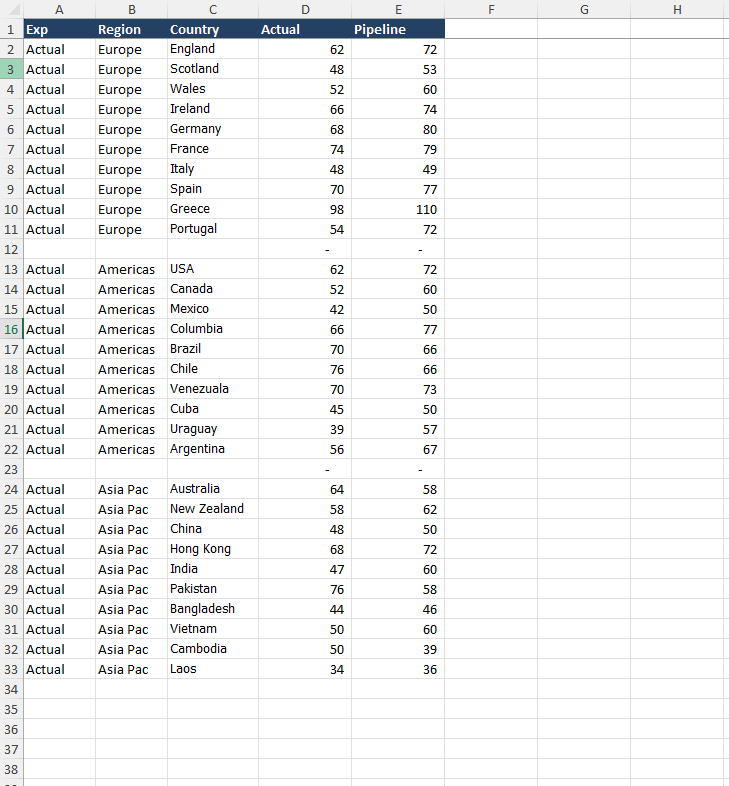
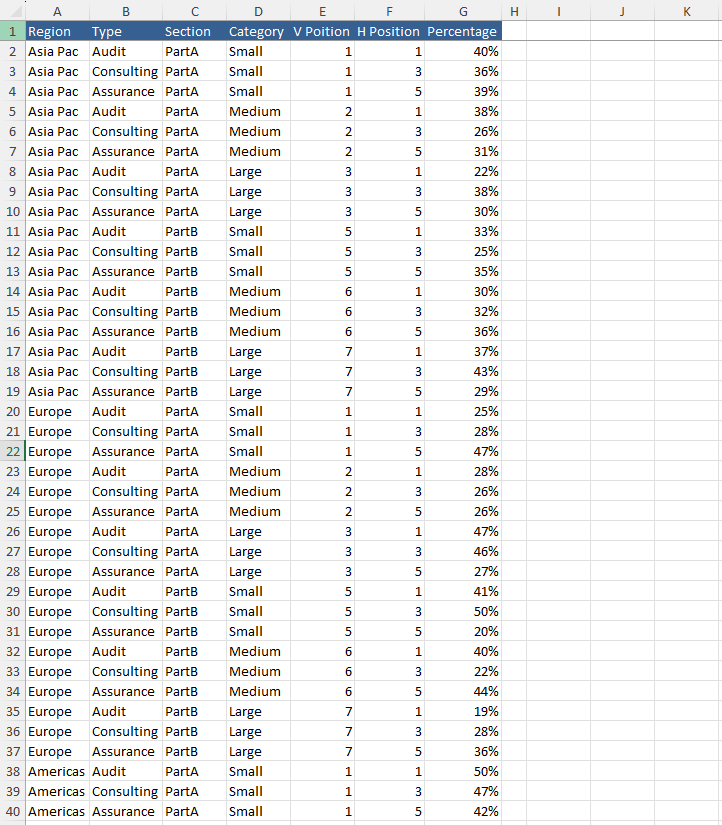
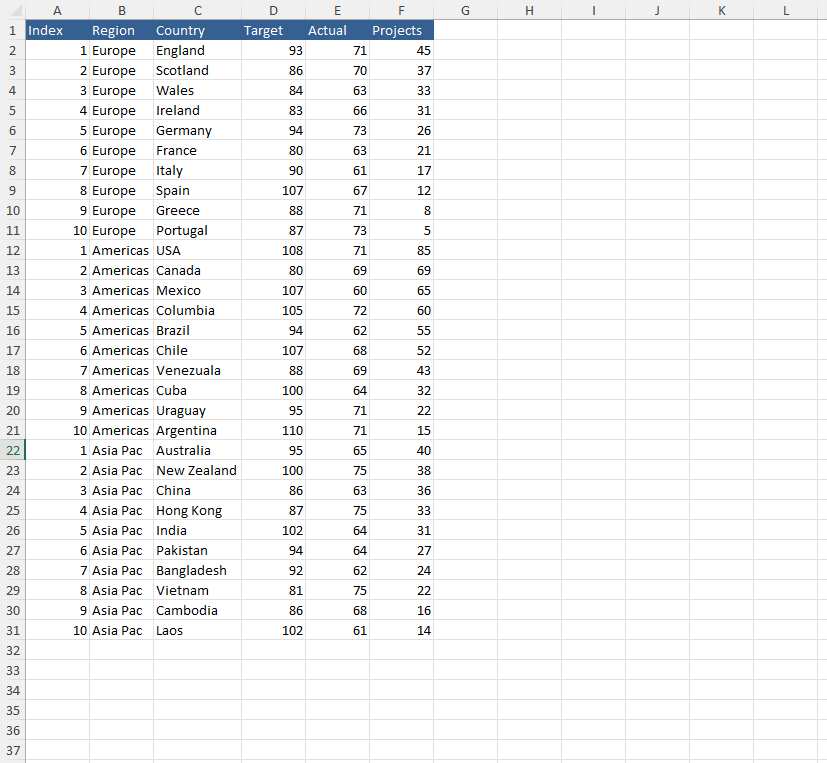
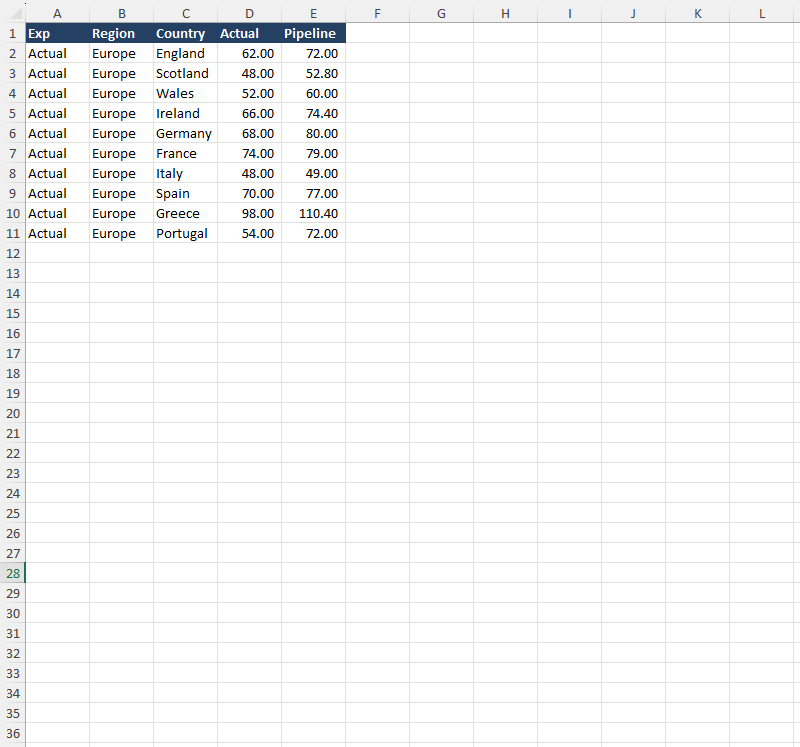
Key Organisational Metrics Report
Key Organisational Metrics Report
Further information
Share the ability to create beautiful dashboards with well laid out data and calculations.
Where revenue, expense or any other metrics are needed to be displayed in a succinct summary.
Where users do not use Excel regularly
