


Originally published: 27/06/2023 12:28
Publication number: ELQ-34332-1
View all versions & Certificate
Publication number: ELQ-34332-1
View all versions & Certificate

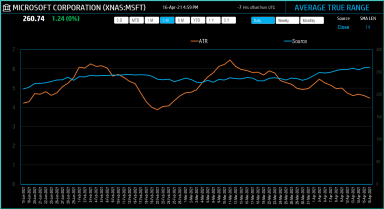
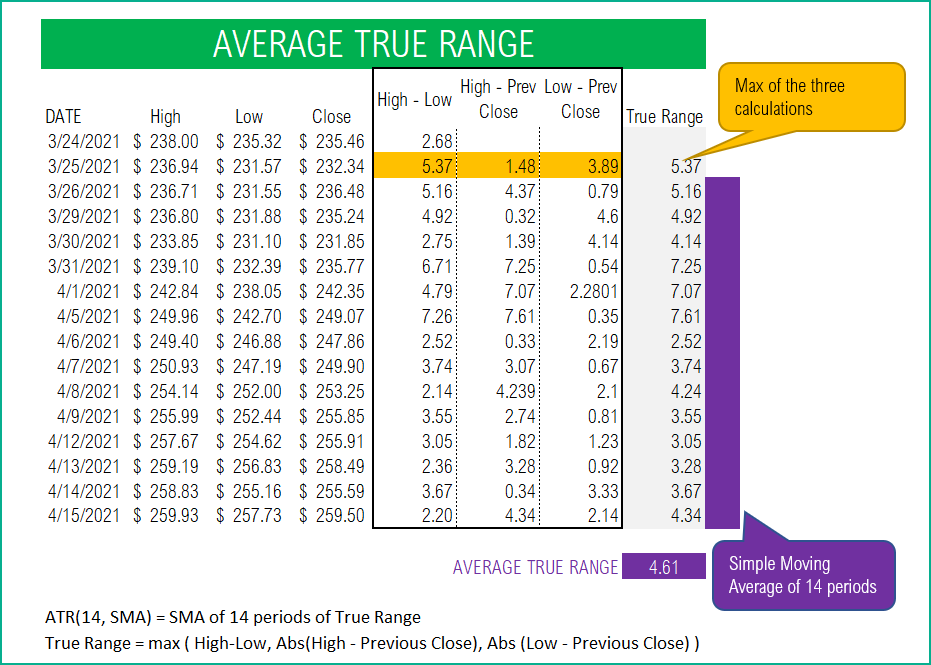
Average True Range (ATR) Indicator – Technical Analysis - Excel Template
Use this free excel template to get ATR (Average True Range) technical indicator to analyze stock performance.
