
Originally published: 28/12/2020 21:49
Publication number: ELQ-35526-1
View all versions & Certificate
Publication number: ELQ-35526-1
View all versions & Certificate

Transcription Services Excel Financial Model
Transcription Services Financial Model is a very sophisticated planning tool with all relevant fields and tables.
Description
A Transcription Sevices Excel Financial Model prepared by Oak Business Consultants includes a complete financial framework to make solid financial plans and projections. This financial Model consists of all relevant financial statements and performance metrics, which enable the user to make sound decisions by considering all operational risk factors.
Oak Business Consultant has developed this template for transcription services agencies with a 5-year details forecast. It will help you to manage and organize your business efficiently. Using this model, you cannot be distracted by complicated calculations and utilize more time in marketing activities and managing your customers’ tasks.
The Transcription Services Excel Financial Model is highly adaptable and dynamic for forming a 5-years monthly and yearly 3 statement (Income Statement, Balance Sheet, and Cashflow Statement) financial projection for a startup or existing agency. This model also consolidates a discounted cash flow valuation calculation by using the projected Free Cash Flows. The Content Marketing Excel Financial Model also calculates the main relevant financial performance ratios and KPIs required by banks and investors to estimate business profitability and liquidity.
Key Inputs
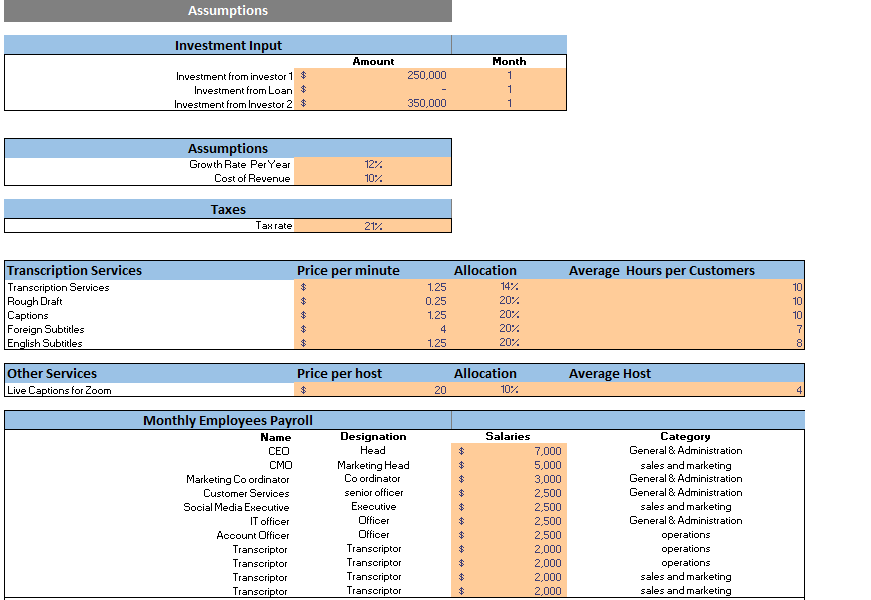
-The growth rate of Customers, at what percentage of your customers are purchasing your services.
- Percentage of Converted Repeat Customers – At what percentage of new total customers come to
your website repeatedly.
- Average Payable and Receivable days your business is following.
- Cost of Revenue related to total sale.
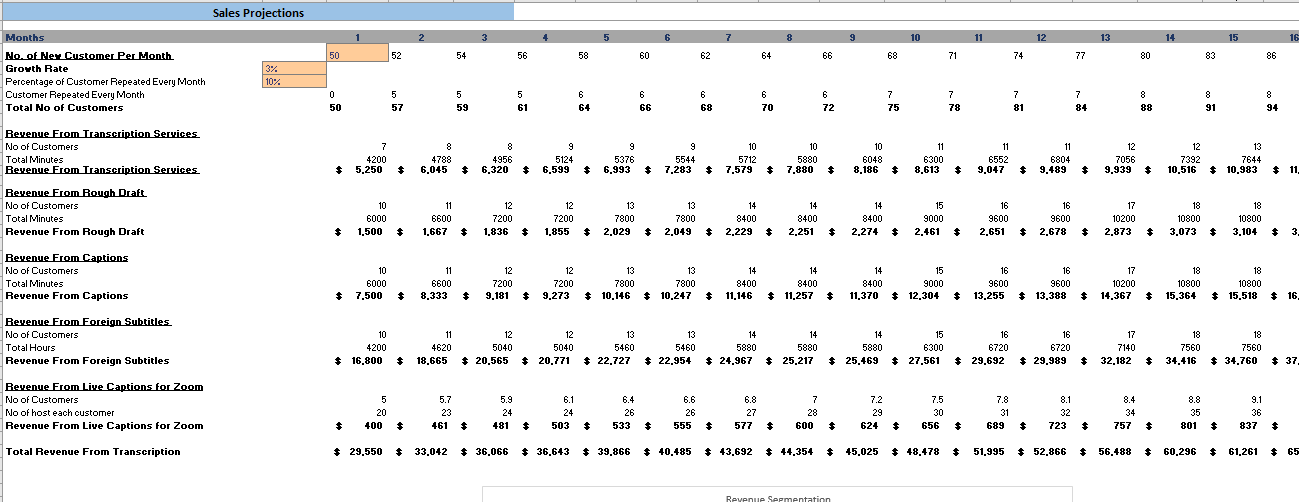
- Average Price of different categories of services as per minute
- Percentage of each product category purchase by customers related to the total customers.
- Zoom conference transcripted price per host with average host per customer.
- Tax Rate
- Marketing Cost- Includes all social media platforms advertising costs.
Key Features of Transcription Services Excel Financial Model
- Input Sheet – This sheet linked with all related financial statements; make a change to this
the sheet will impact the result of all financial automatically
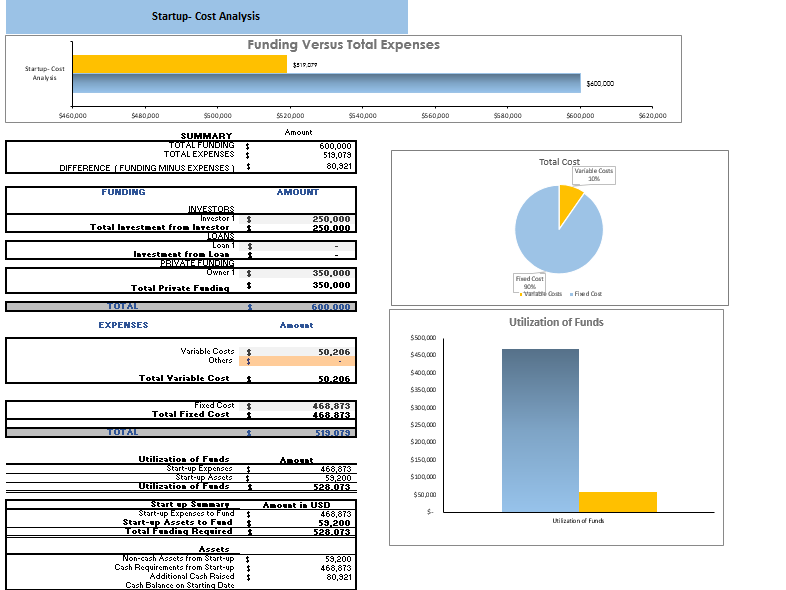
- Startup Summary Plan
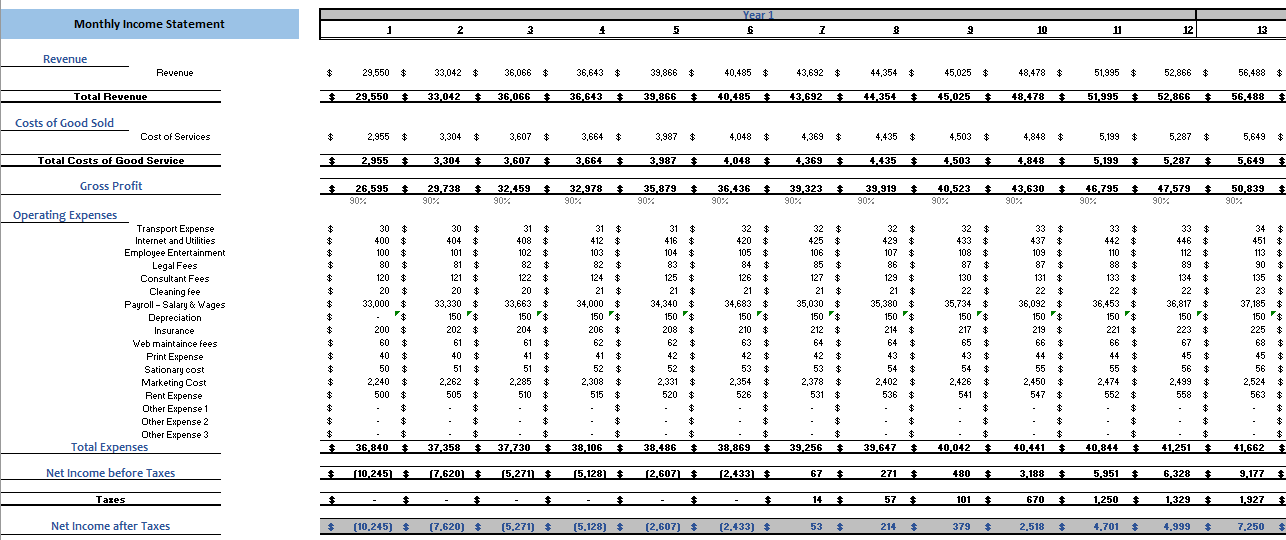
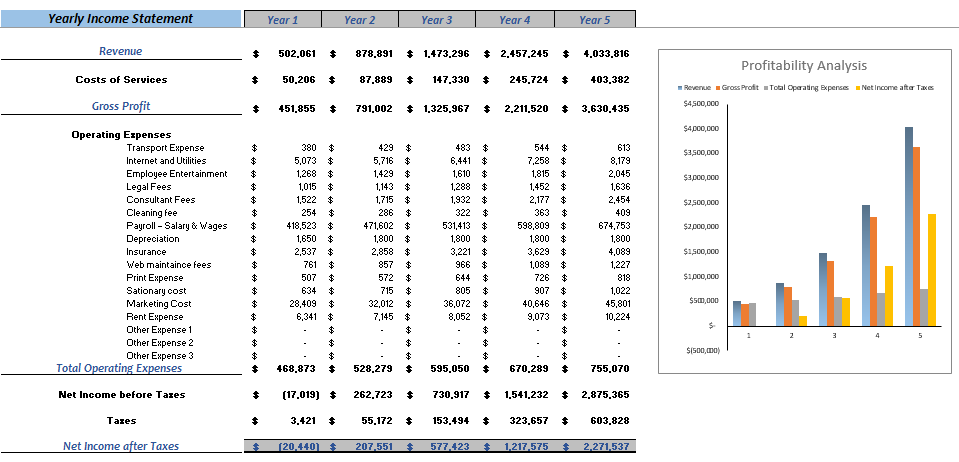
- 5 years detailed Monthly and Yearly Income Statement
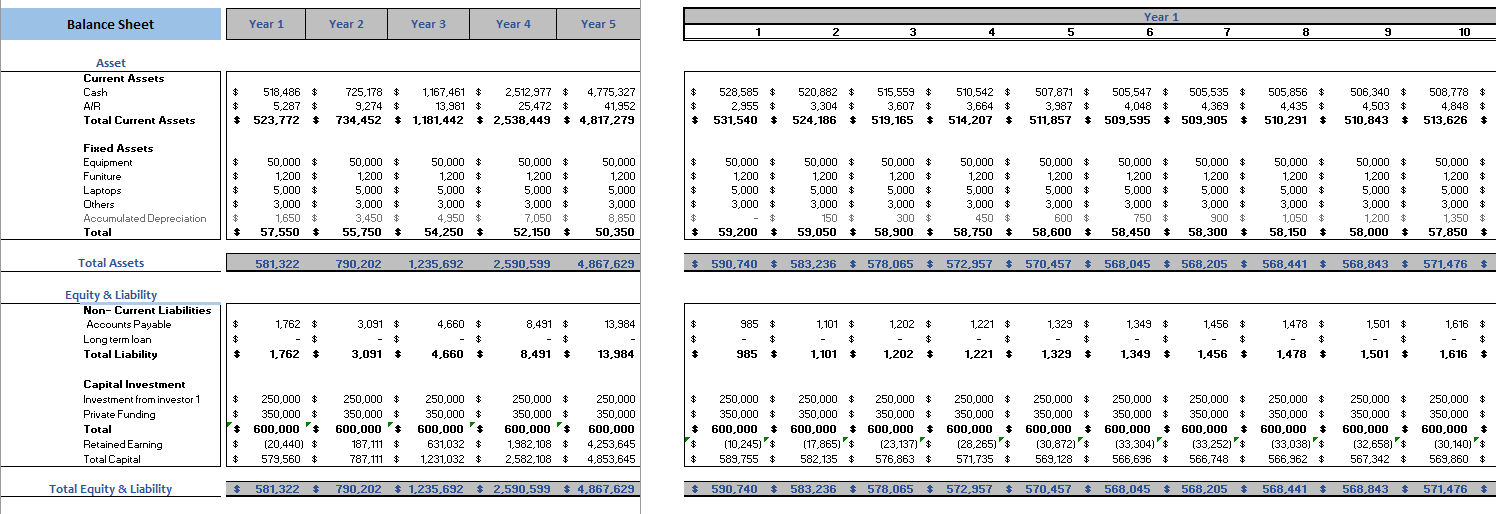
- 5 years detailed Balance Sheet Statement
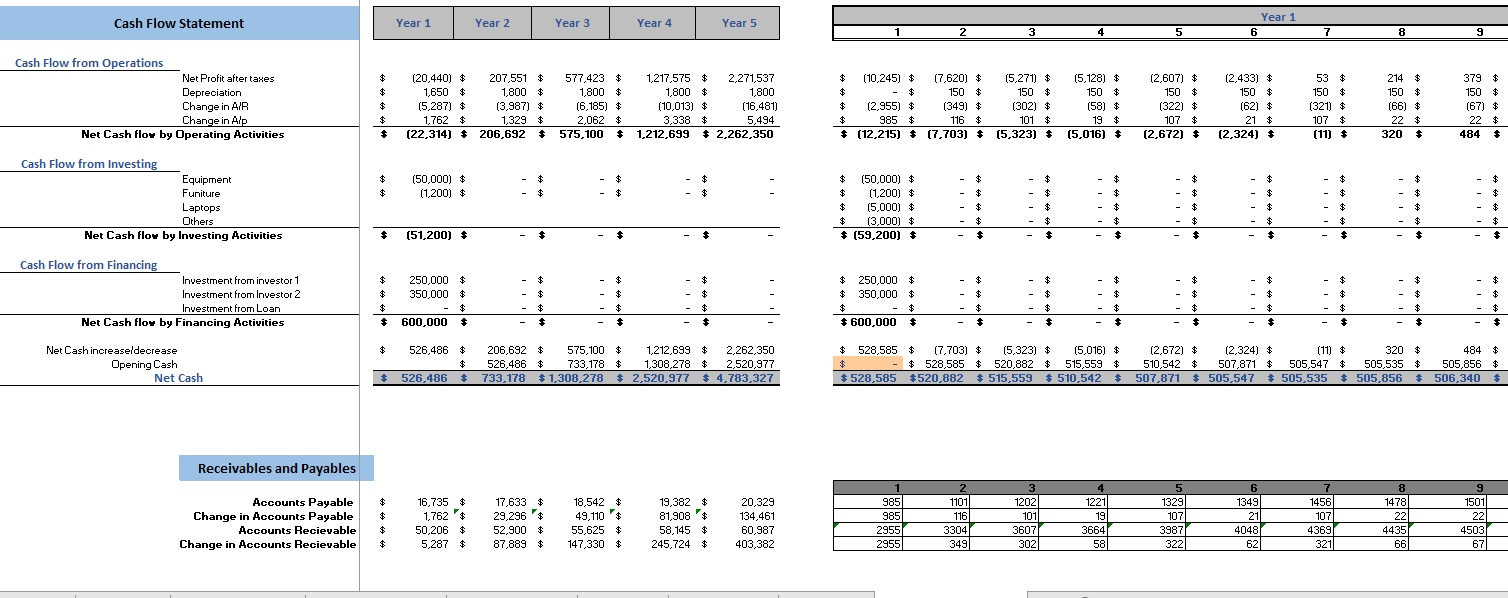
- 5 years details Cash Flow Analysis
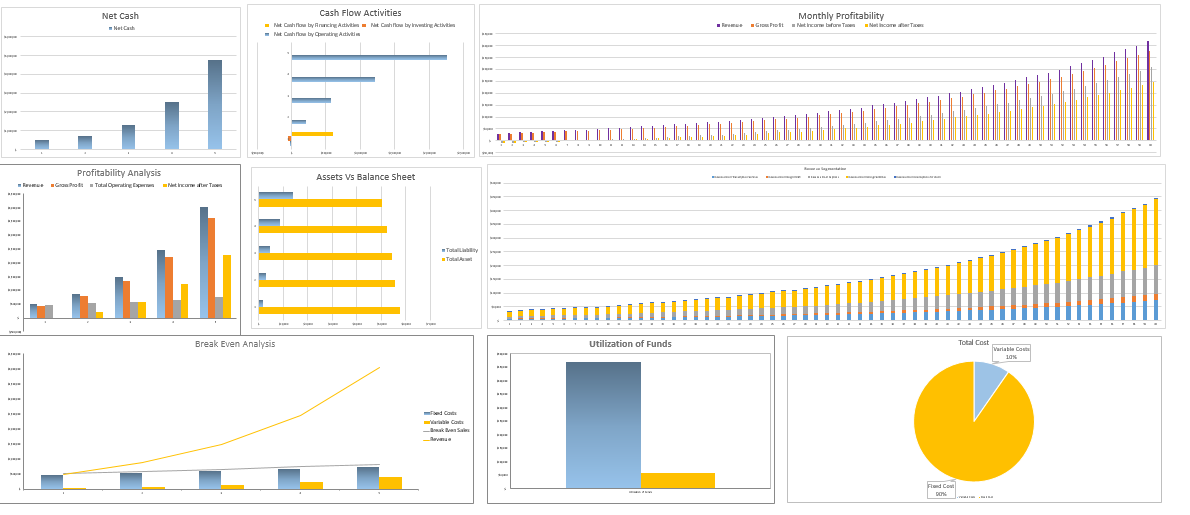
- Detailed KPIs – Full KPIs with dashboards.
- Dashboards – The Transcription Services Excel financial model contains dashboards and
visuals that enable users to understand the complete financial positions of the company quickly.
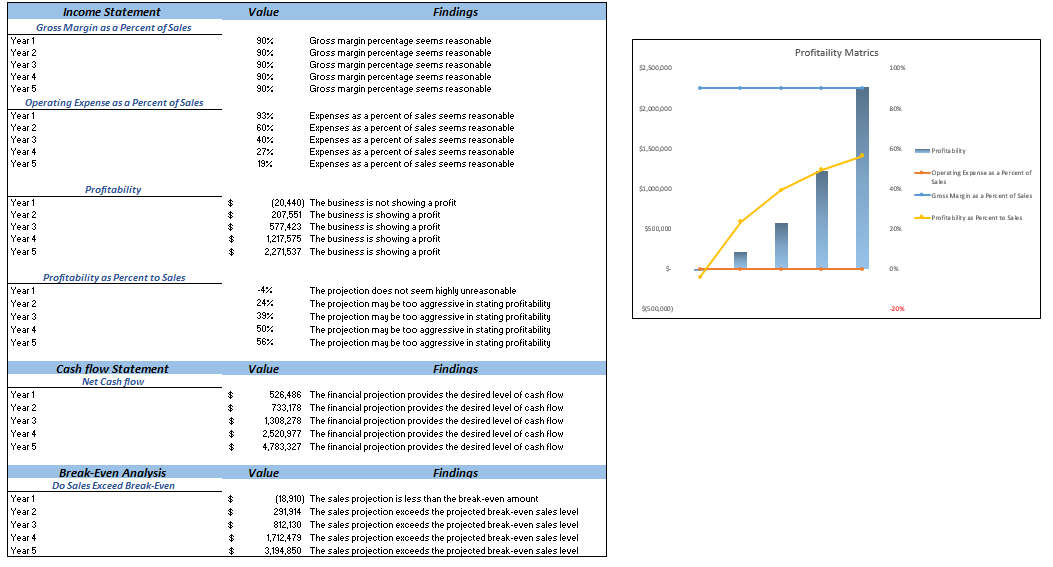
- Diagnostic Tools – This Diagnostic sheet automatically calculates the data such as the
Profitability ratio, Net operating expense ratio to expense, etc.,
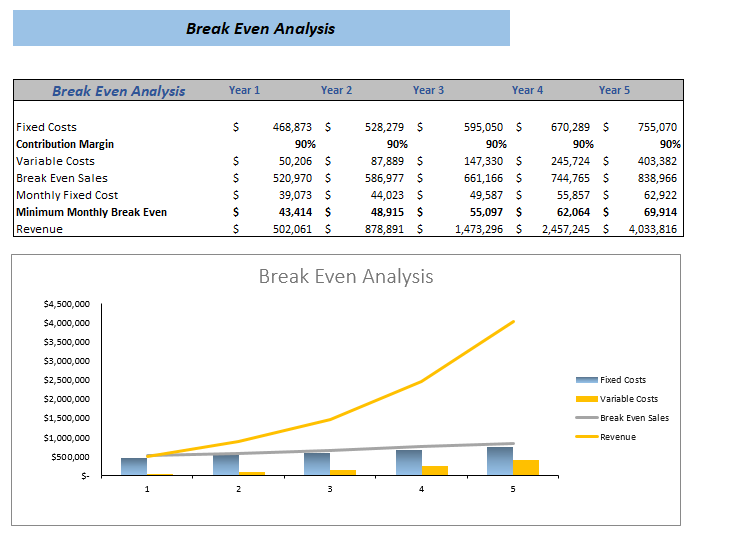
- Break-Even Analysis Summary
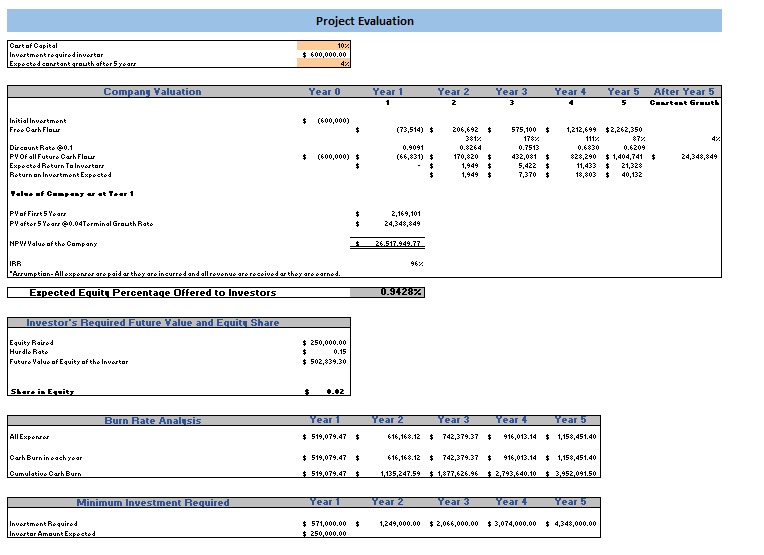
- Project Evaluation Sheet – Calculates the company's valuation and IRR
Why is Transcription Services Excel Financial Model Beneficial for you?
Overview of Business Profitability: The transcription services enable the user to determine whether the business is operating profitable or not under a consistent revenue model. This model also helps the business maintain and keep the business expenditure in line with the revenue model.
Identify Operation Trend: The financial model allows the user to compare financial statements and ratios over various periods of time to identify the perpetual trend in business. This model also helps the business know what products are selling well, what segments are growing well, and which segment of business needs further review and re-investment or complete exit at once. Therefore, Identifying trends is a necessity for the business to sustain growth and achieve higher profits.
Investor’s Friendly: All related investor metrics are included; therefore, investors will appreciate the full transparency on a Transcription Services financial model while considering investing in your business.
Clear Integration: Integrated and connected everything from assumptions to all financial statements and Performance KPIs in a well-structured and deal-proven way.
Data Visualization Tool: It provides data visualization graphs that clearly depict your company’s financial health, so you can easily track your company’s performance.
A Transcription Sevices Excel Financial Model prepared by Oak Business Consultants includes a complete financial framework to make solid financial plans and projections. This financial Model consists of all relevant financial statements and performance metrics, which enable the user to make sound decisions by considering all operational risk factors.
Oak Business Consultant has developed this template for transcription services agencies with a 5-year details forecast. It will help you to manage and organize your business efficiently. Using this model, you cannot be distracted by complicated calculations and utilize more time in marketing activities and managing your customers’ tasks.
The Transcription Services Excel Financial Model is highly adaptable and dynamic for forming a 5-years monthly and yearly 3 statement (Income Statement, Balance Sheet, and Cashflow Statement) financial projection for a startup or existing agency. This model also consolidates a discounted cash flow valuation calculation by using the projected Free Cash Flows. The Content Marketing Excel Financial Model also calculates the main relevant financial performance ratios and KPIs required by banks and investors to estimate business profitability and liquidity.
Key Inputs
-The growth rate of Customers, at what percentage of your customers are purchasing your services.
- Percentage of Converted Repeat Customers – At what percentage of new total customers come to
your website repeatedly.
- Average Payable and Receivable days your business is following.
- Cost of Revenue related to total sale.
- Average Price of different categories of services as per minute
- Percentage of each product category purchase by customers related to the total customers.
- Zoom conference transcripted price per host with average host per customer.
- Tax Rate
- Marketing Cost- Includes all social media platforms advertising costs.
Key Features of Transcription Services Excel Financial Model
- Input Sheet – This sheet linked with all related financial statements; make a change to this
the sheet will impact the result of all financial automatically
- Startup Summary Plan
- 5 years detailed Monthly and Yearly Income Statement
- 5 years detailed Balance Sheet Statement
- 5 years details Cash Flow Analysis
- Detailed KPIs – Full KPIs with dashboards.
- Dashboards – The Transcription Services Excel financial model contains dashboards and
visuals that enable users to understand the complete financial positions of the company quickly.
- Diagnostic Tools – This Diagnostic sheet automatically calculates the data such as the
Profitability ratio, Net operating expense ratio to expense, etc.,
- Break-Even Analysis Summary
- Project Evaluation Sheet – Calculates the company's valuation and IRR
Why is Transcription Services Excel Financial Model Beneficial for you?
Overview of Business Profitability: The transcription services enable the user to determine whether the business is operating profitable or not under a consistent revenue model. This model also helps the business maintain and keep the business expenditure in line with the revenue model.
Identify Operation Trend: The financial model allows the user to compare financial statements and ratios over various periods of time to identify the perpetual trend in business. This model also helps the business know what products are selling well, what segments are growing well, and which segment of business needs further review and re-investment or complete exit at once. Therefore, Identifying trends is a necessity for the business to sustain growth and achieve higher profits.
Investor’s Friendly: All related investor metrics are included; therefore, investors will appreciate the full transparency on a Transcription Services financial model while considering investing in your business.
Clear Integration: Integrated and connected everything from assumptions to all financial statements and Performance KPIs in a well-structured and deal-proven way.
Data Visualization Tool: It provides data visualization graphs that clearly depict your company’s financial health, so you can easily track your company’s performance.
This Best Practice includes
1 Excel File
