Price-Volume-Mix Analysis
Originally published: 25/06/2020 06:41
Last version published: 16/07/2025 14:21
Publication number: ELQ-25560-8
View all versions & Certificate
certified

Price-Volume-Mix Analysis

A comprehensive full-scope model to analyse revenue and profit changes

Description

Price-volume-mix analysis is vital for understanding changes in sales and profits between two periods, between budget and actual, or across model scenarios.

This comprehensive, full-scope model lets you:

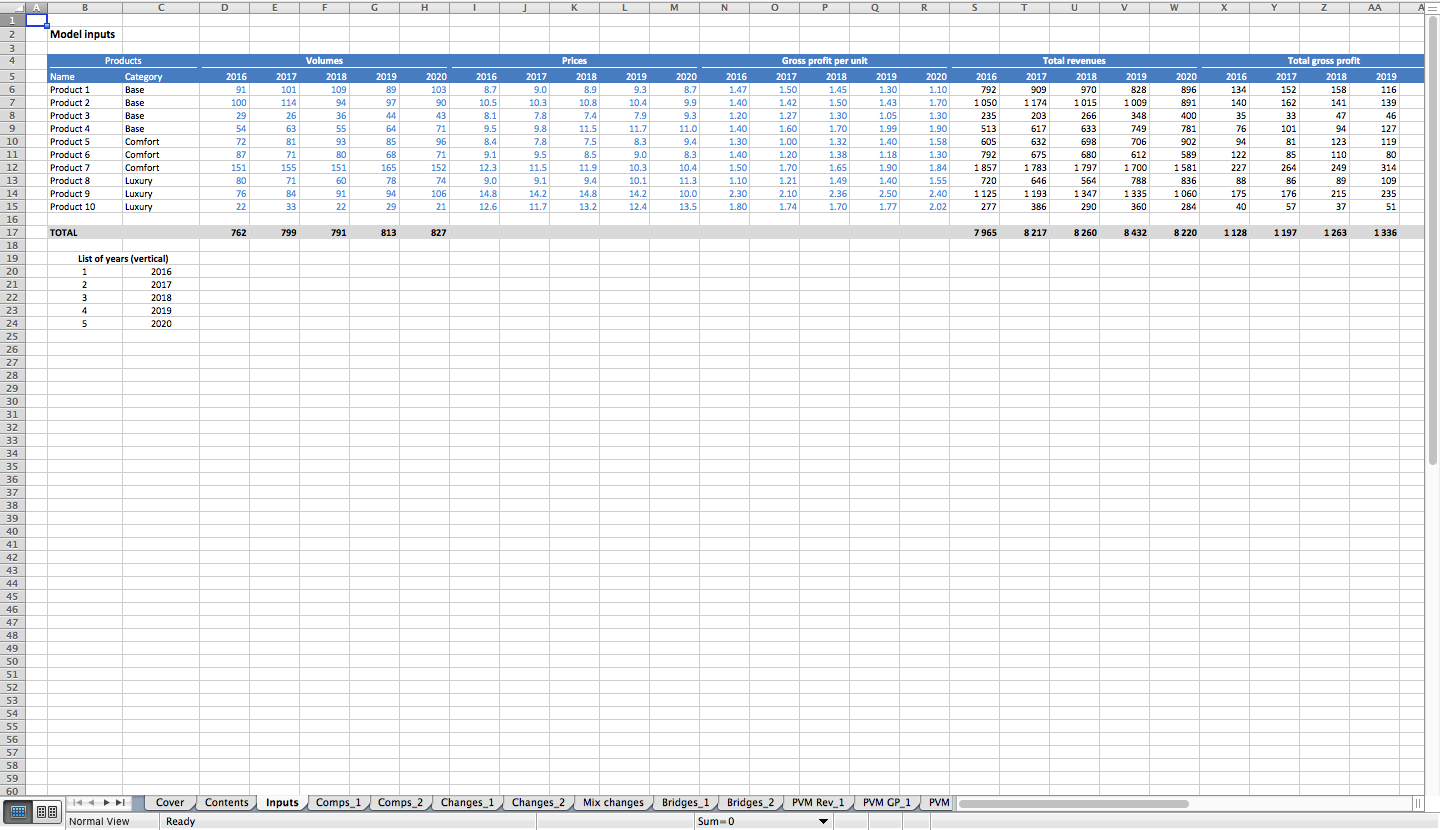
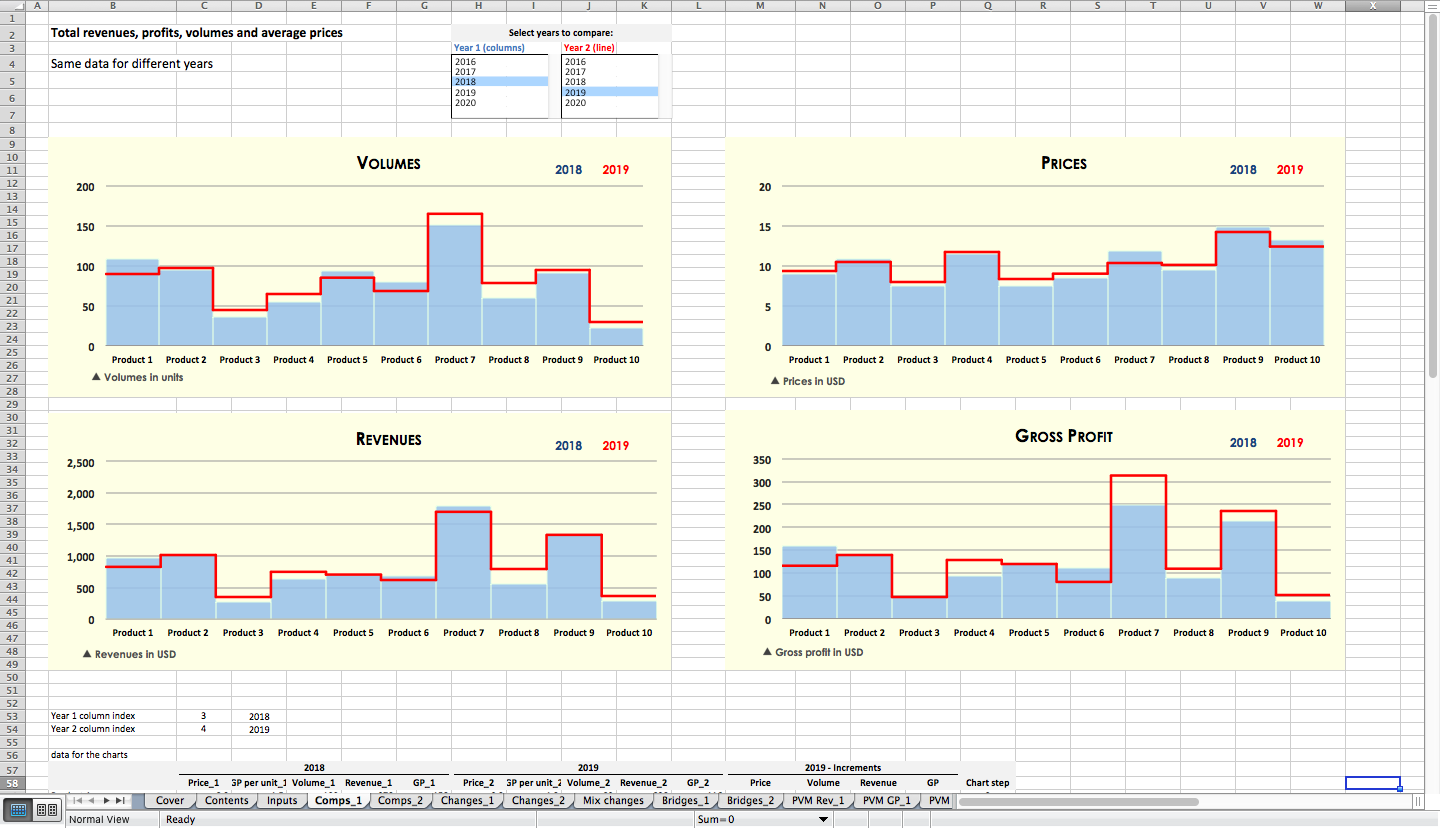
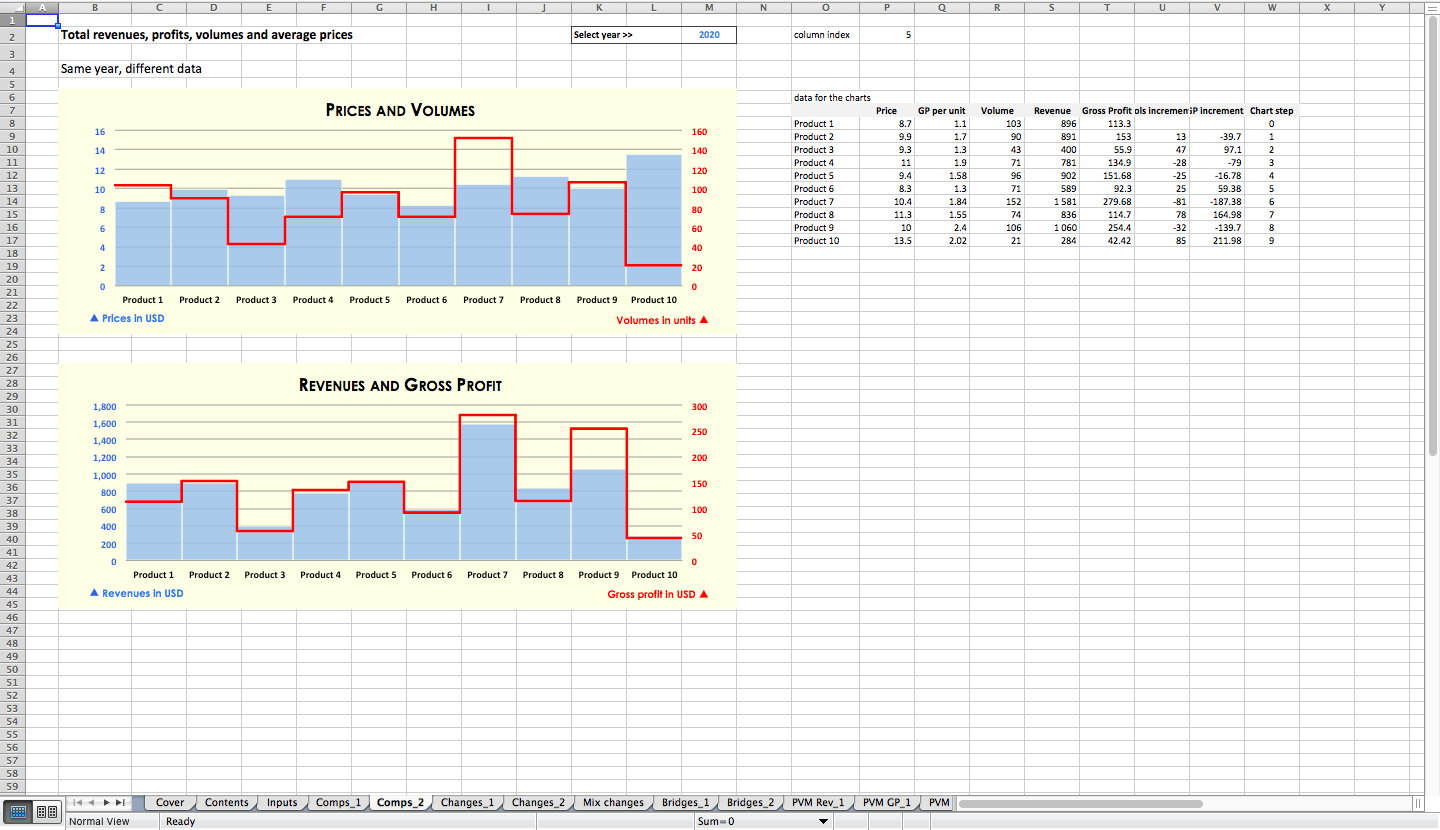
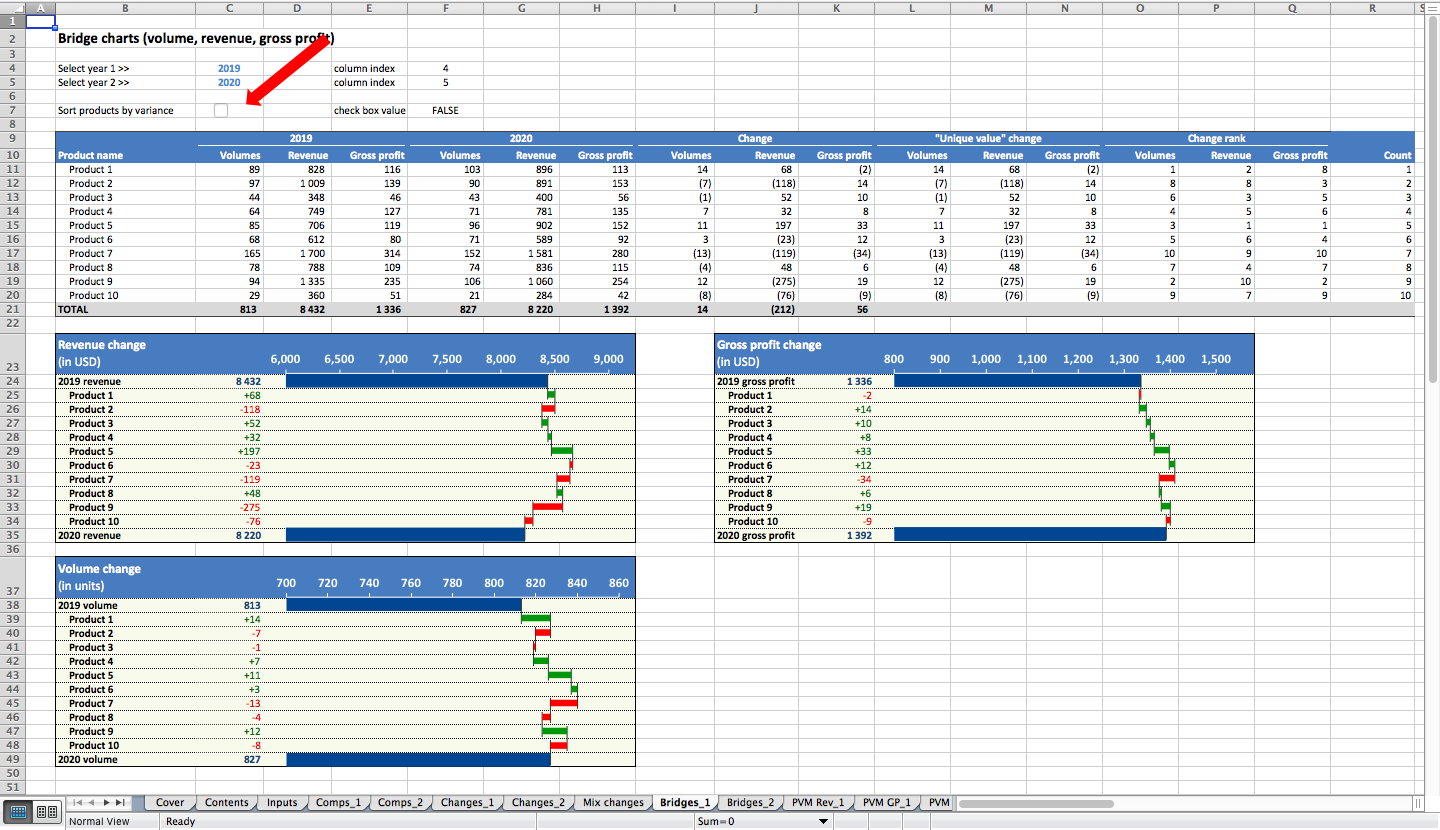
  1. Compare total prices, volumes, revenues, and gross profit by product between any two periods.

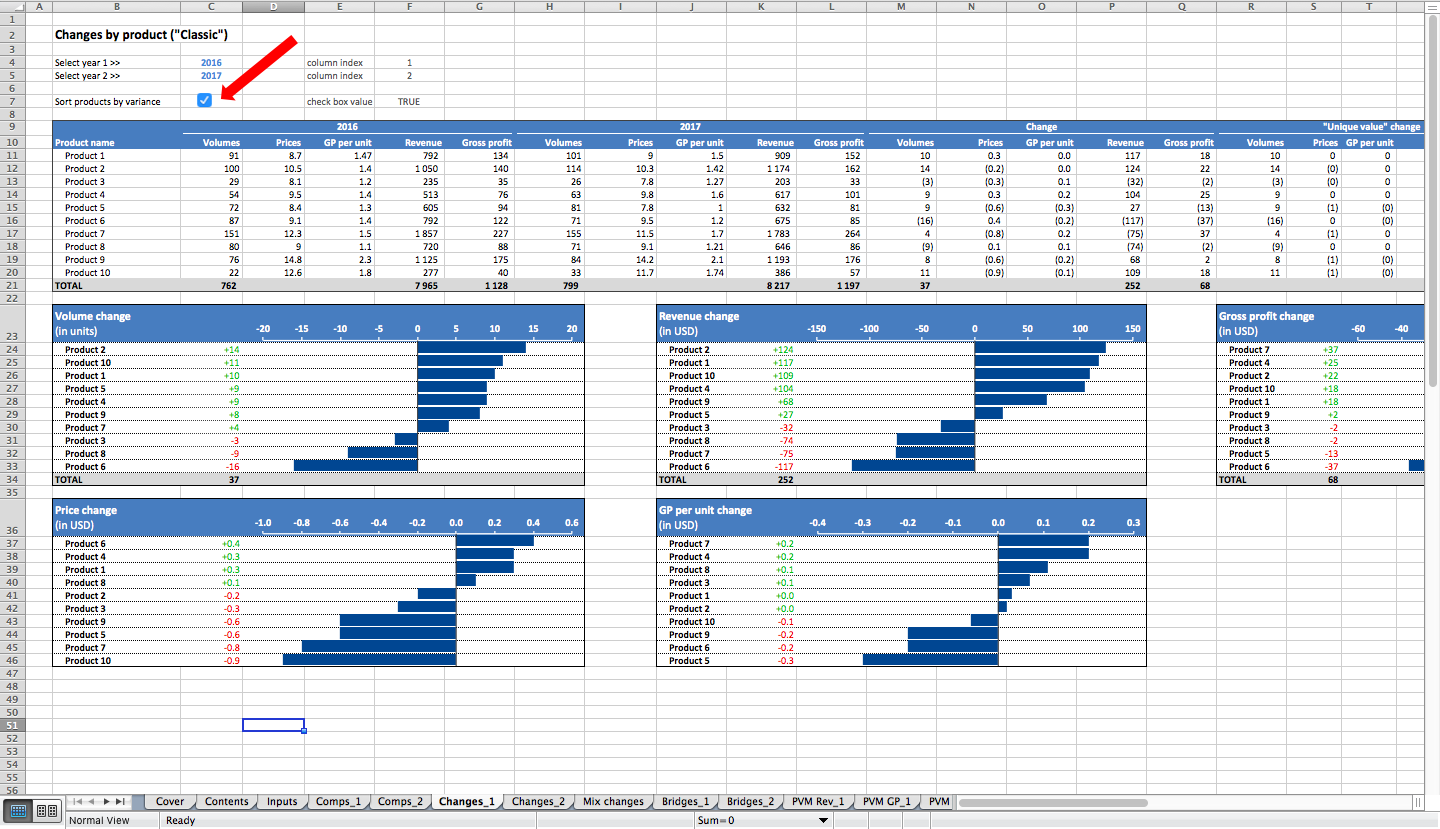
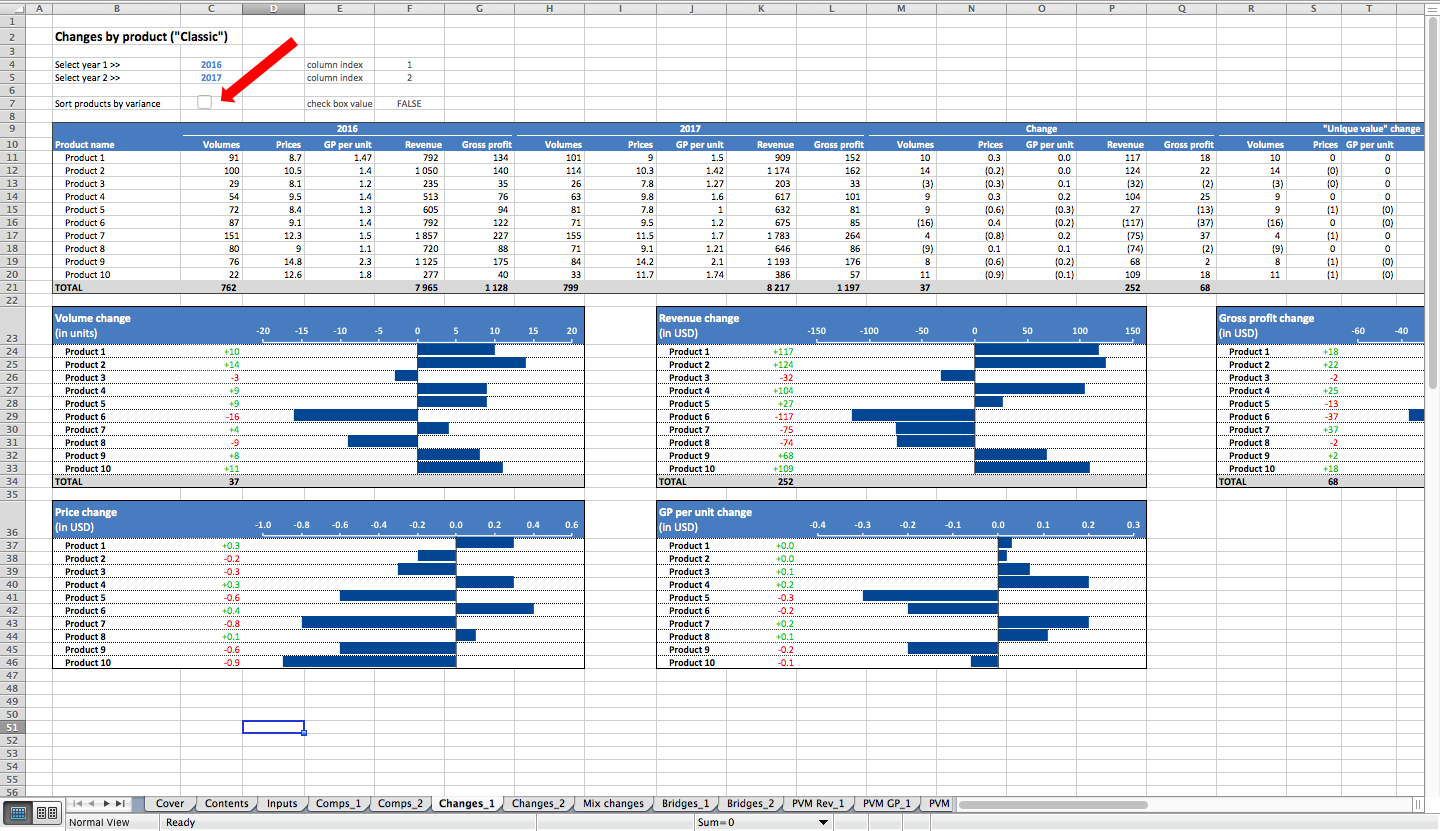
  2. Identify which products saw the largest price, volume, revenue, and profit changes—positive or negative.

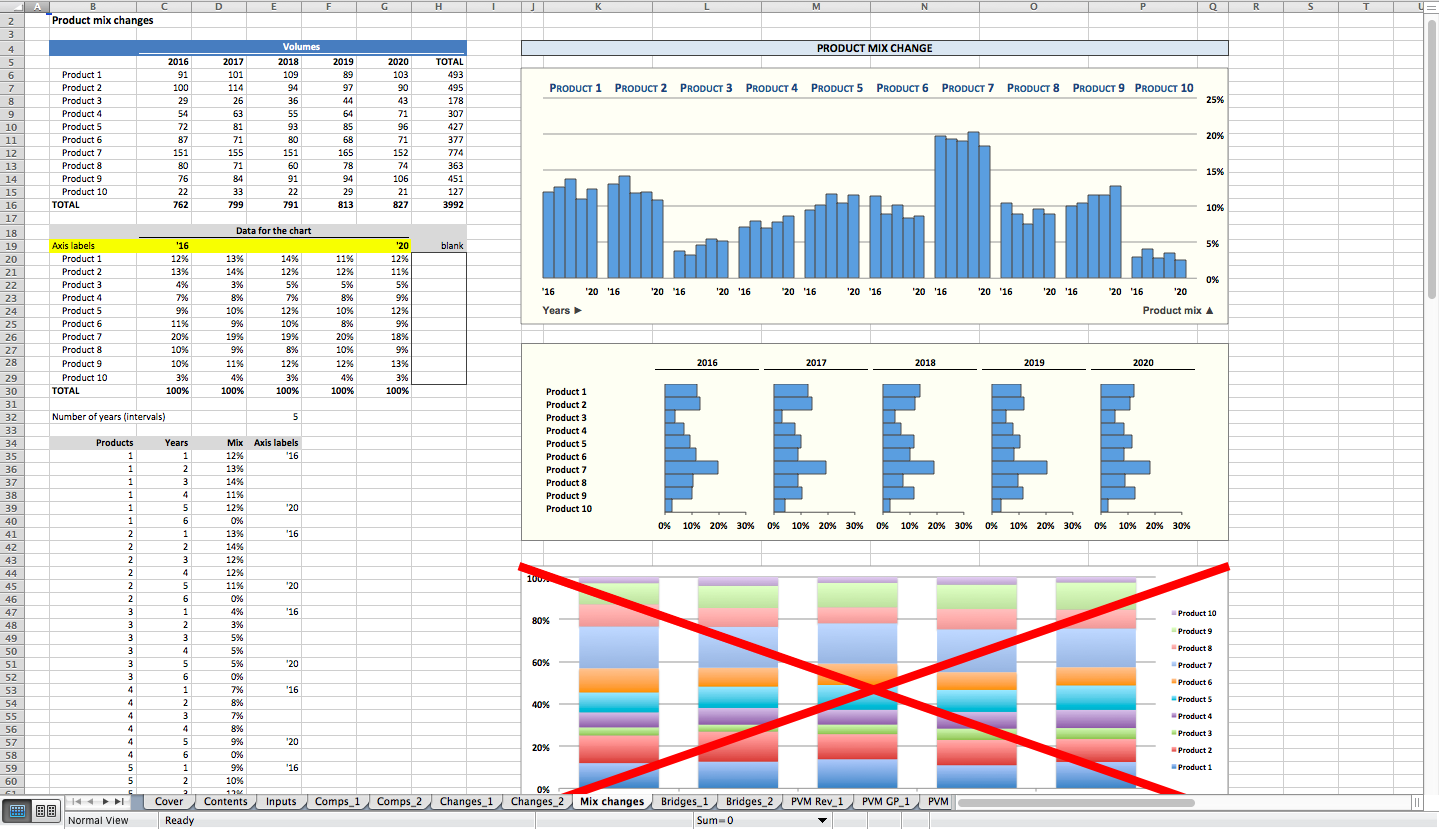
  3. Visualize mix changes by product and by period.

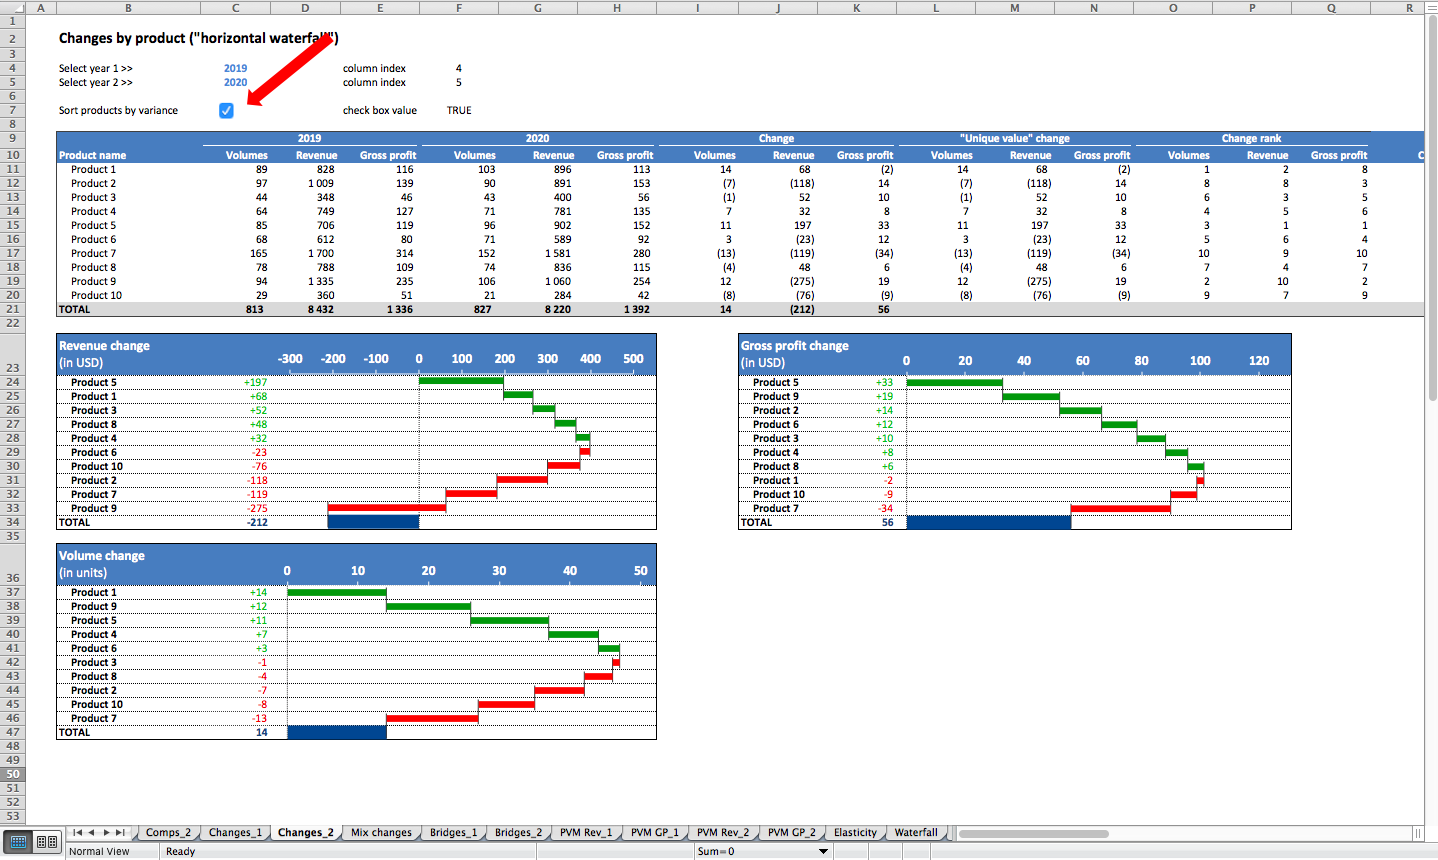
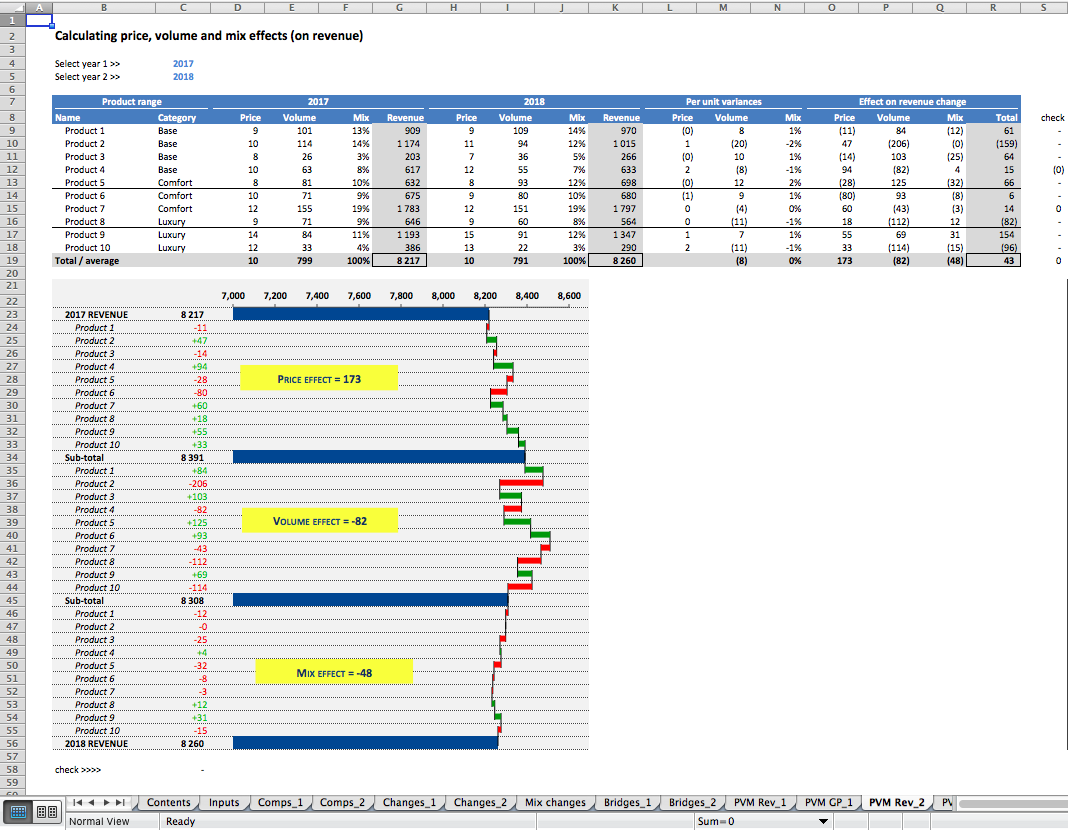
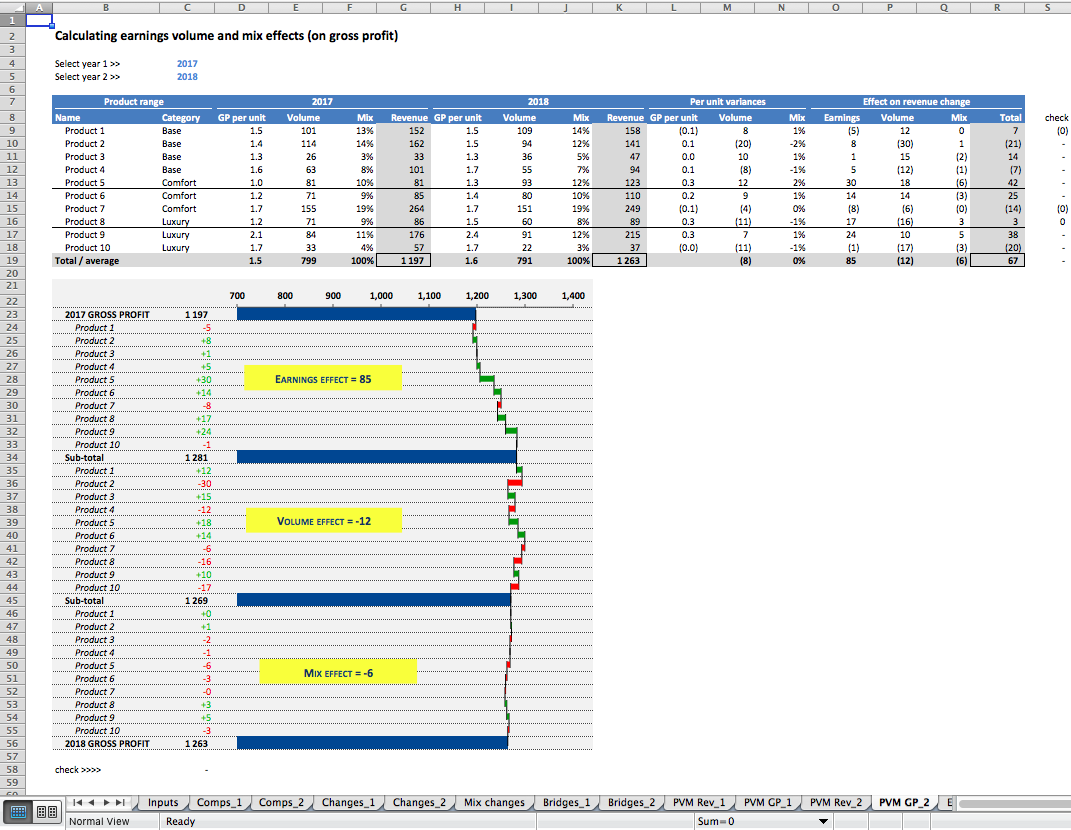
  4. See which products drove the change in revenue and/or profit, and by how much.

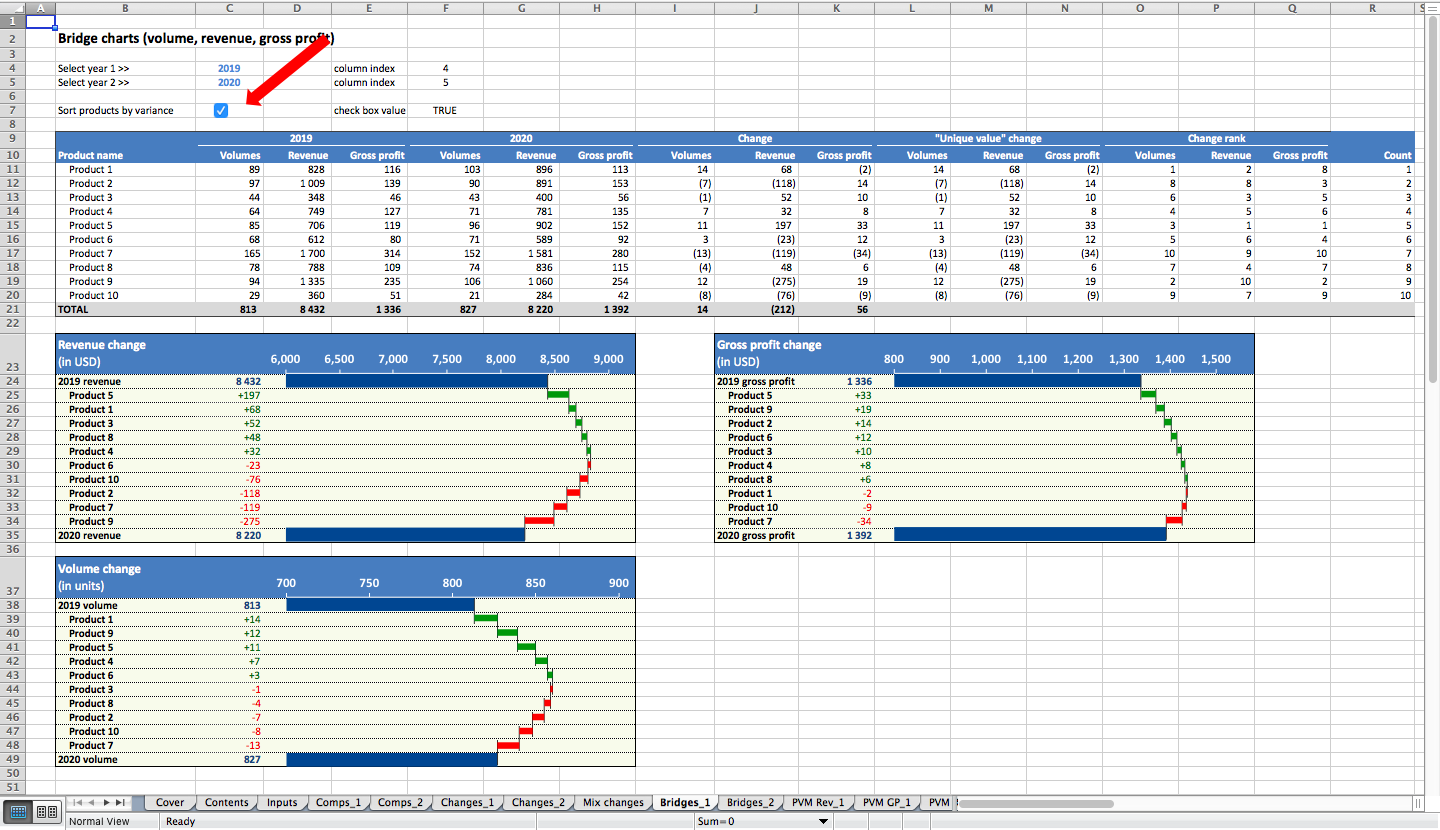
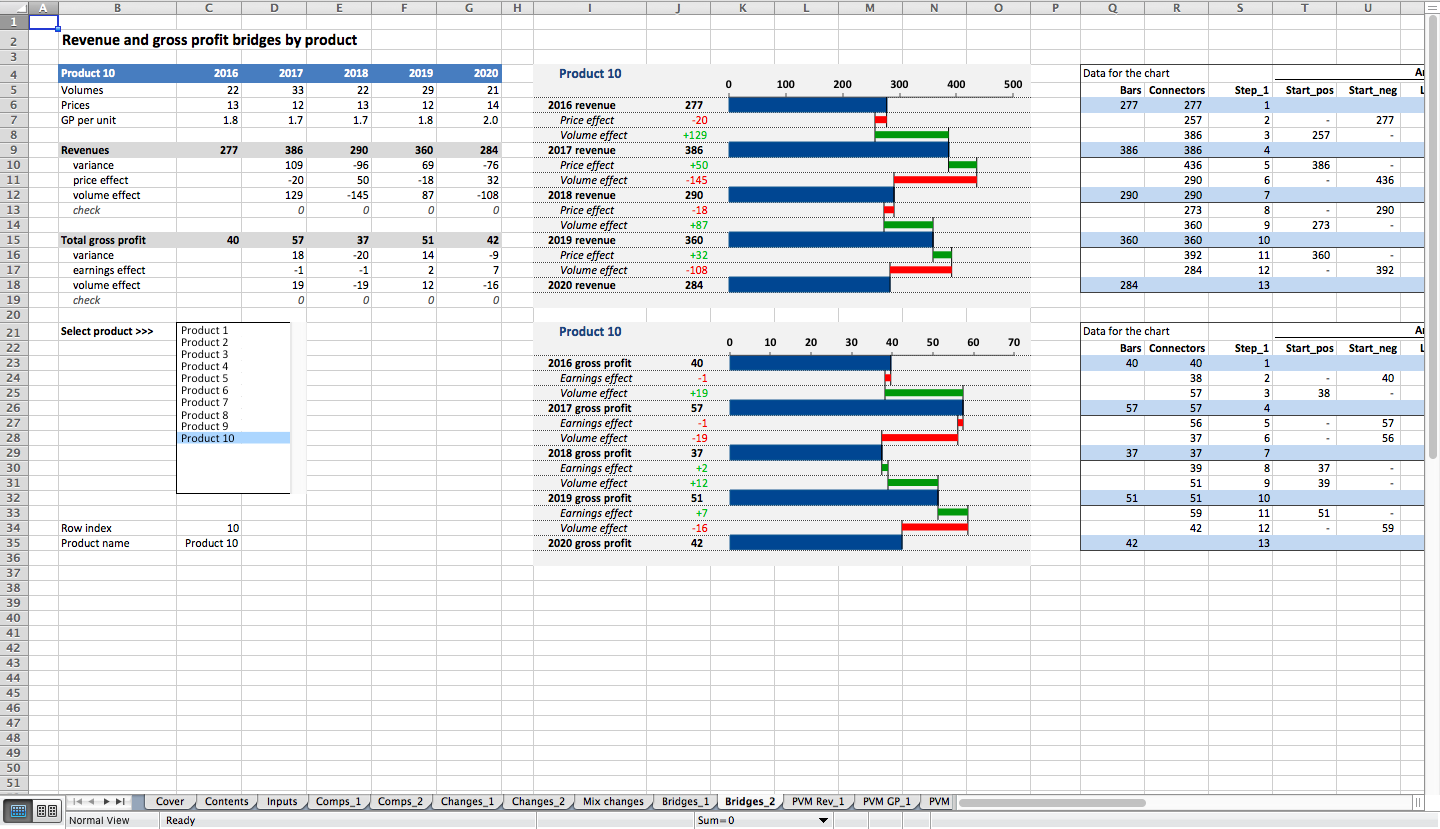
  5. Build revenue and gross-profit bridges for any product.

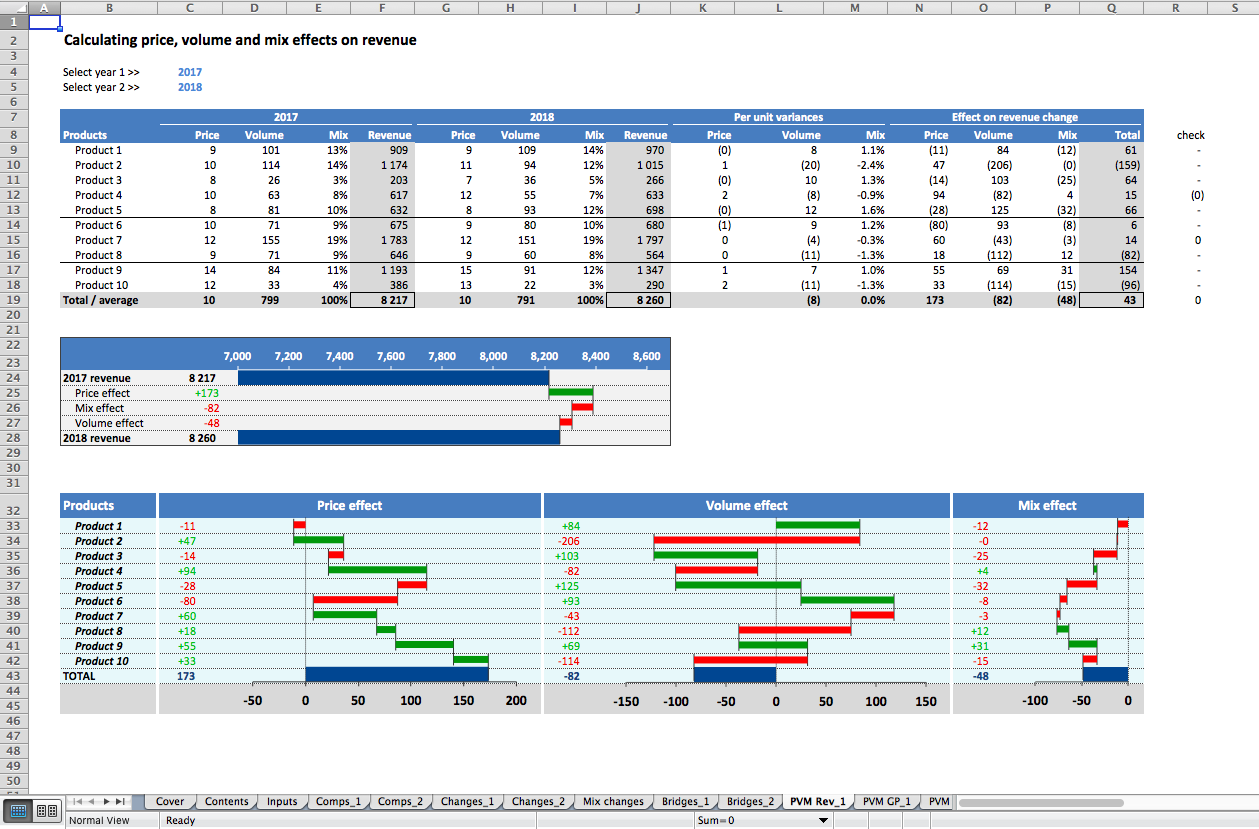
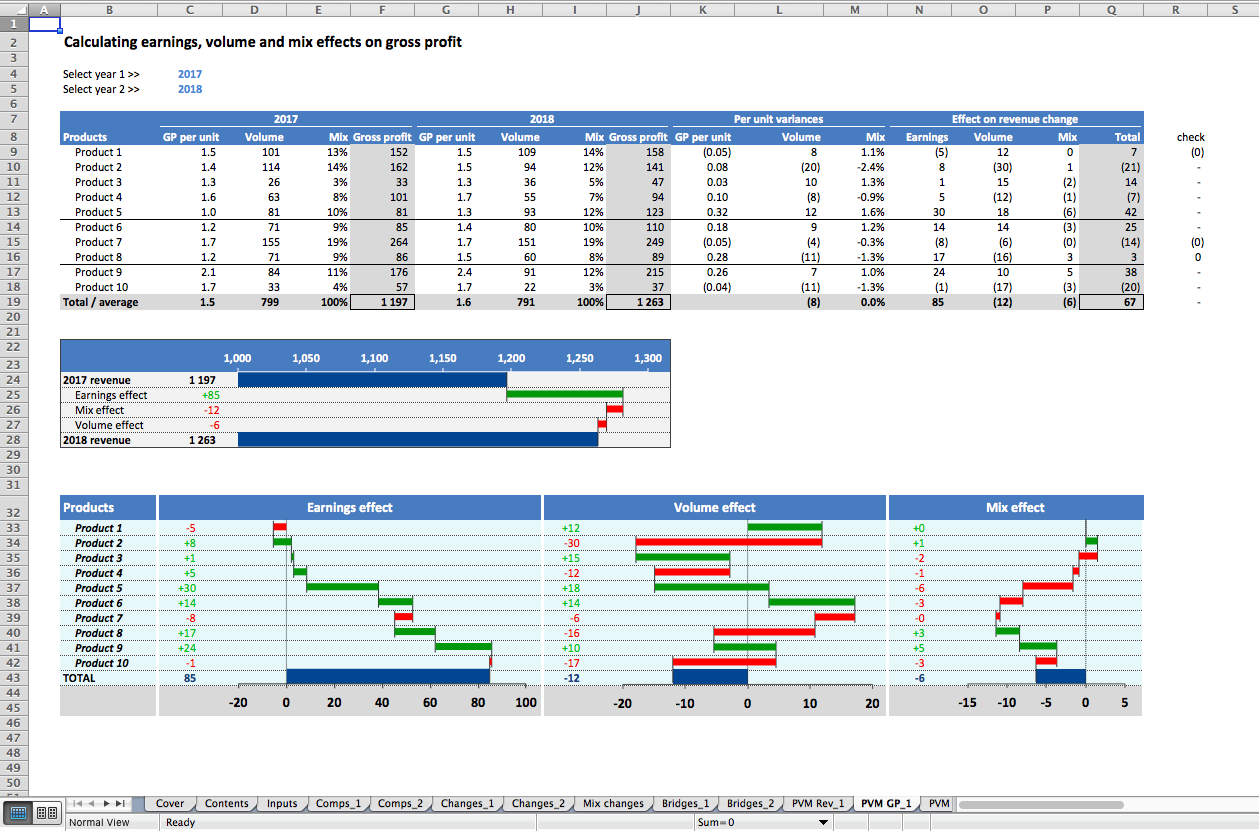
  6. Decompose revenue and gross-profit changes into price, mix, and volume effects.

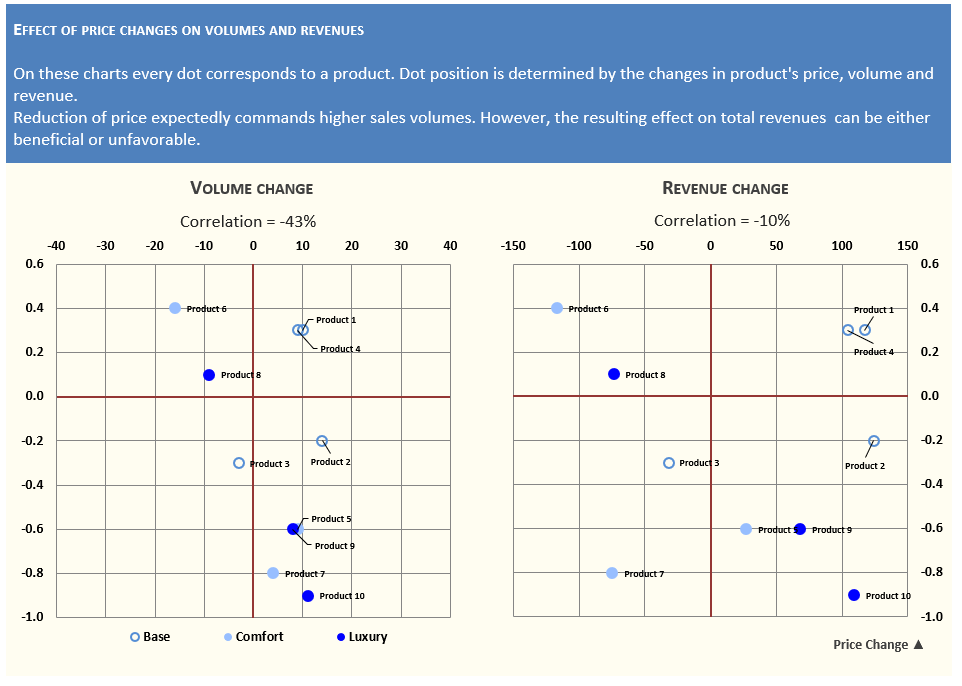
  7. Calculate price-volume correlations.

Flexible structure. The model handles ten products and five annual periods (easily extended). Each worksheet lets you pick the comparison periods independently. While most users compare consecutive periods, you can select any two you like.

Professional visuals. You get magazine-quality charts and mini-dashboards. Several are custom-built:

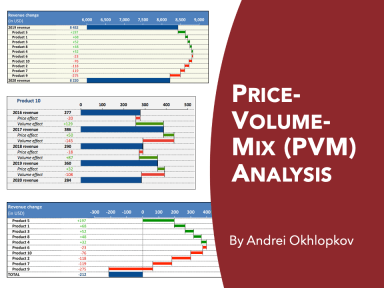
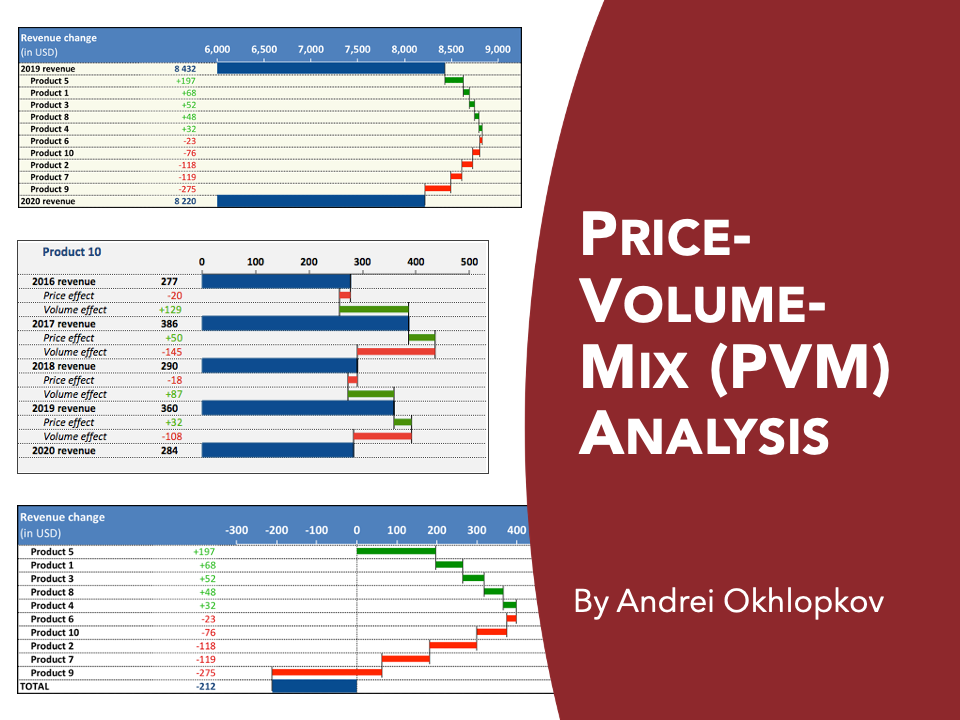
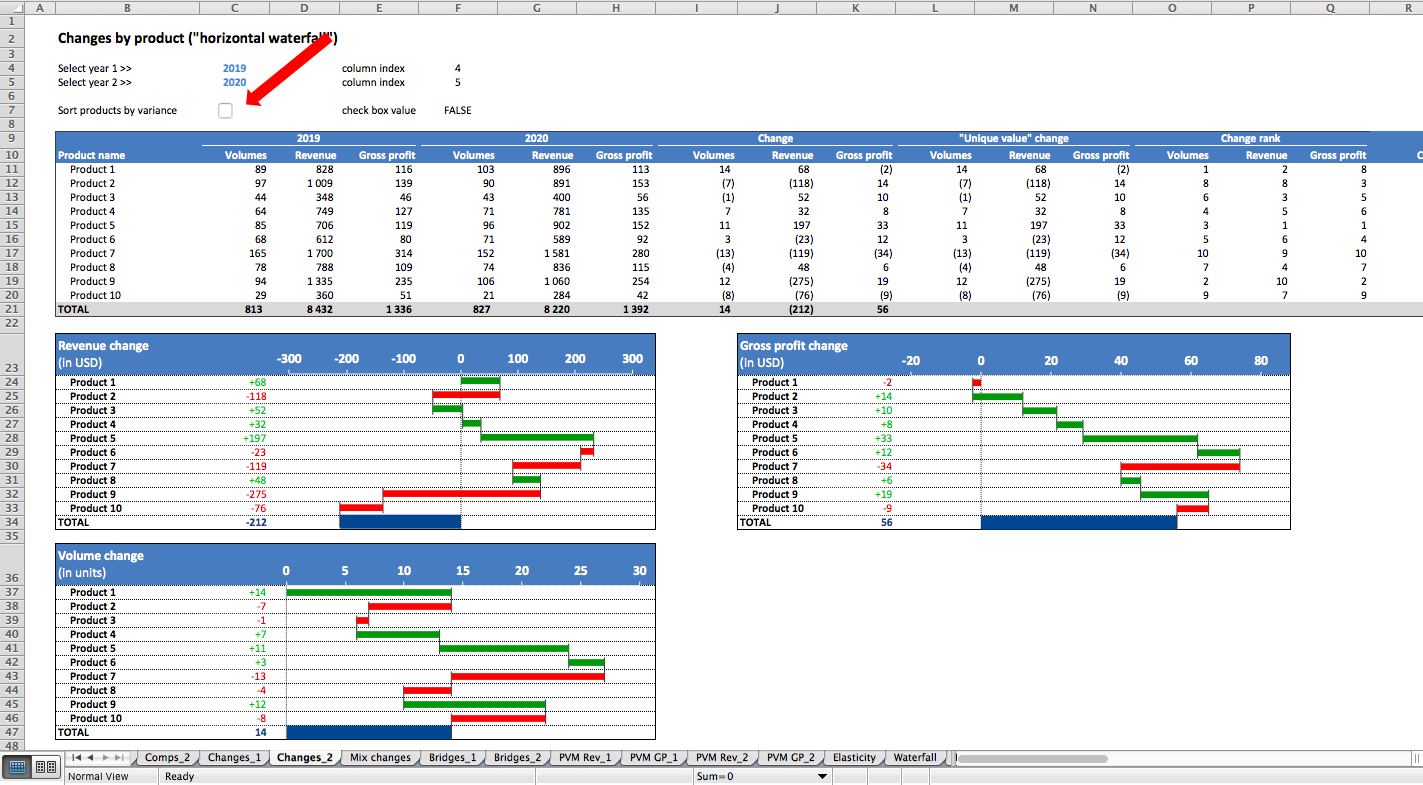
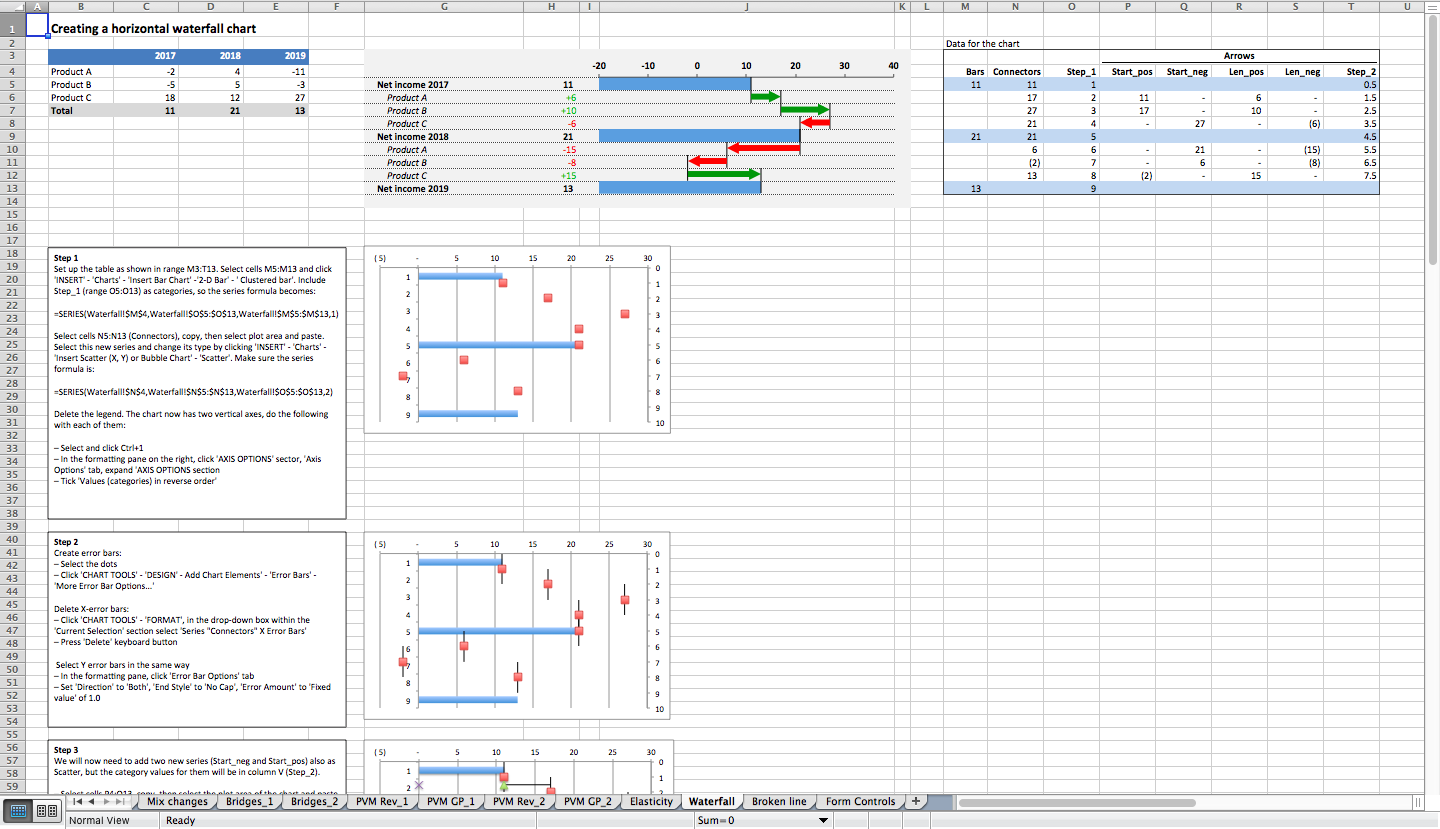
  • Horizontal waterfall charts show each product’s contribution to year-over-year revenue change. These are more compact than Excel’s standard vertical waterfall and are compatible with all Excel versions.

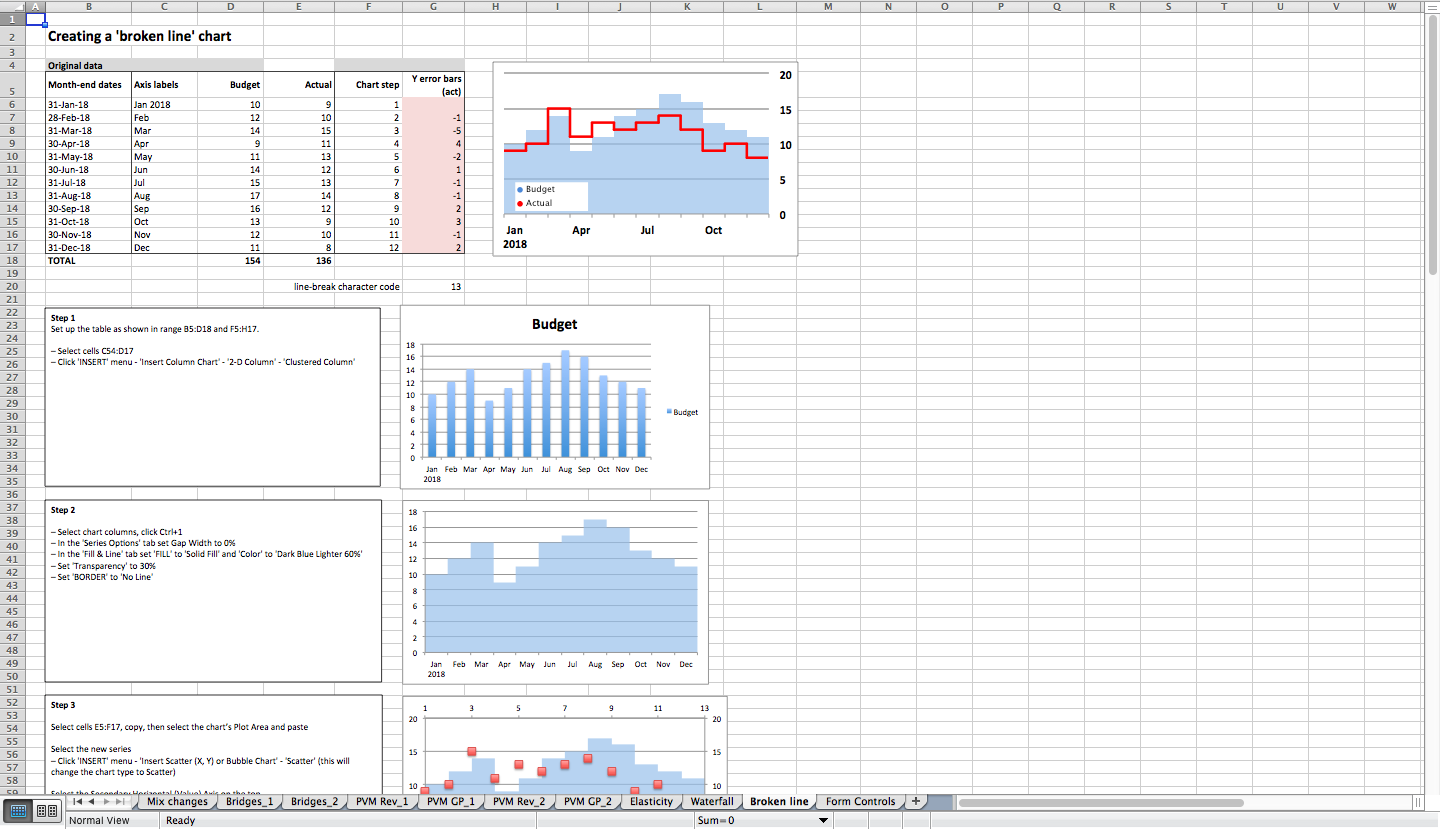
  • “Broken line” (stepped line) charts provide a clearer step-change view than standard line charts.

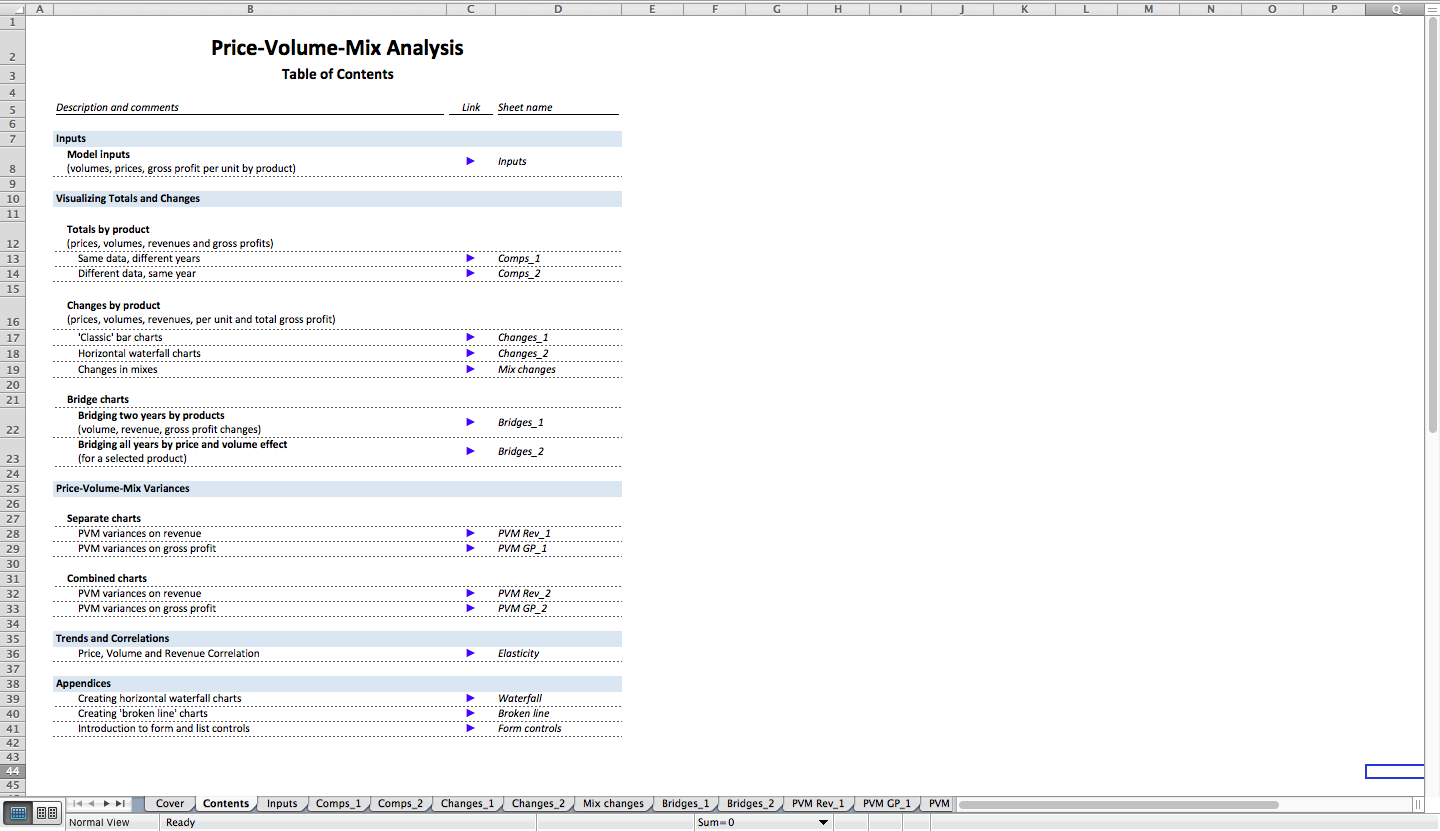
How-to guidance included. Detailed appendices walk you through updating or creating these charts so you can reuse them in your own models, decks, and client presentations.

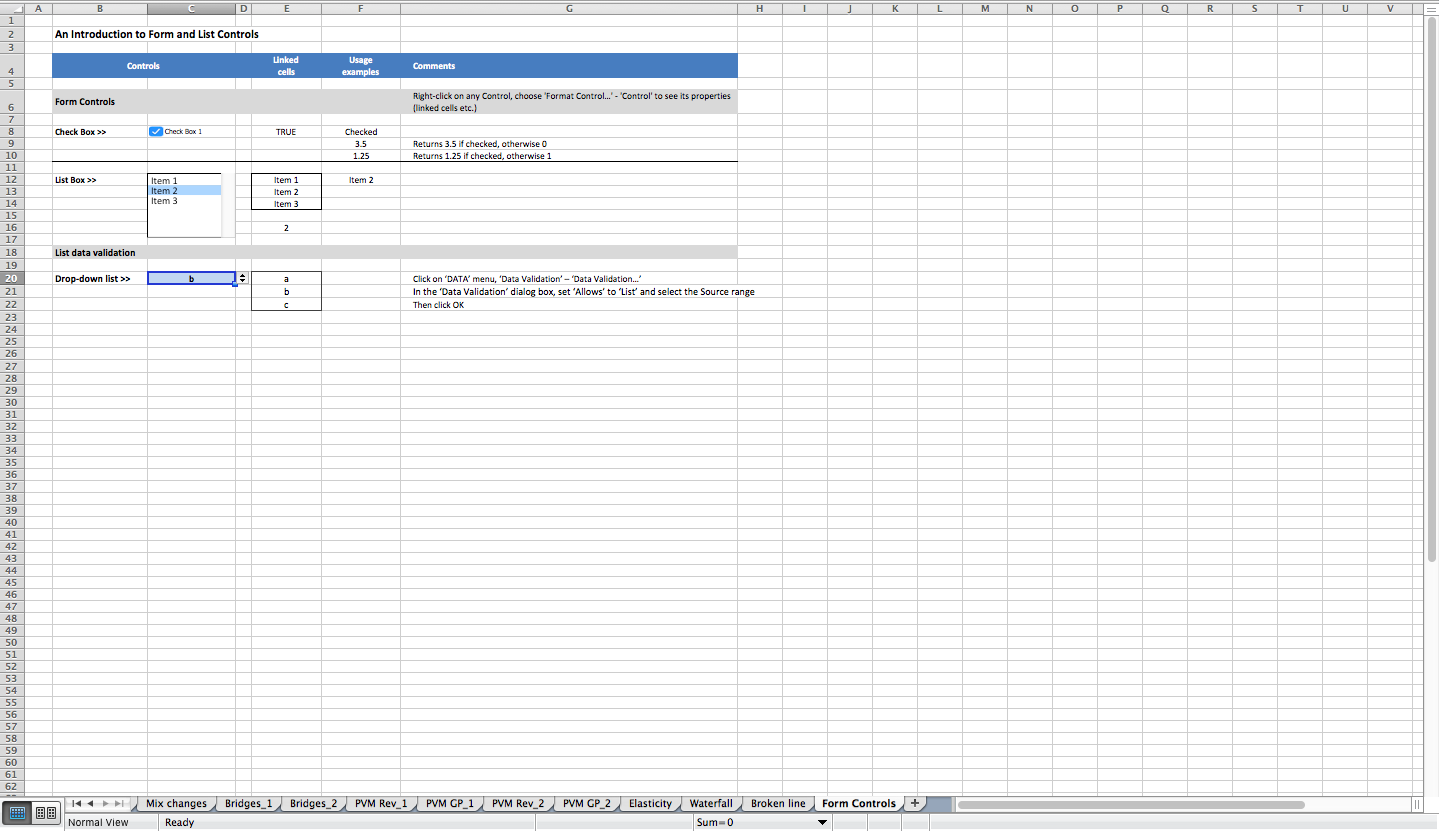
Interactive controls. Check boxes, list boxes, and drop-downs make it fast to select periods and products—adding polish and usability. An appendix explains how to set these up.

The workbook includes 18 worksheets, uses no macros, and comes with a detailed text guide.

This Best Practice includes
1 Excel file, 1 PDF file

Acquire business license for $49.00

Add to cart

Add to bookmarks

Discuss

Further information

Calculate price, volume and mix effect; analyse total revenue and gross profit changes by product

Any business selling more than one product

n/a


4.5 / 5 (2 votes)

please wait...