Financial Modeling Follow 310

- views 101k
- downloads 6.1k
- reviews 663
- Downloadable Best Practices 85


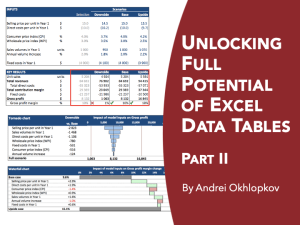
Unlocking Full Potential of Excel Data Tables (Part 2)
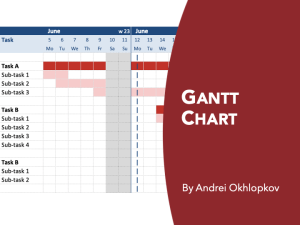
This is a sequel to my 'Unlocking Full Potential of Excel Data Tables (Part 1)' publication explaining advanced methods of using Excel data tables.2,458Discussadd_shopping_cart$15.00Gantt Chart
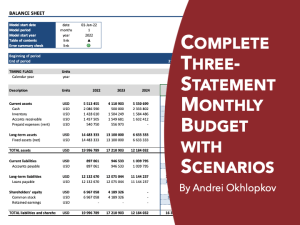
A chart to create a project schedule and to monitor its completion status789Discussadd_shopping_cartfreeComplete Three-Statement Monthly Budget with Scenarios
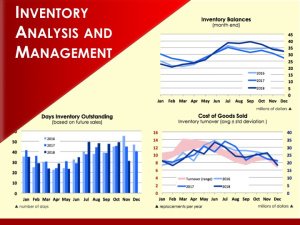
A fundamental and professional budget / business plan1,5072add_shopping_cart$99.00Inventory Analysis and Management
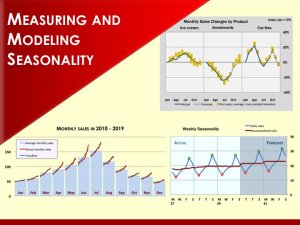
Inventory balance movements, days inventory outstanding (DIO), turnover, seasonality, aging analysis, planning orders2,0513add_shopping_cart$25.00Measuring and Modeling Seasonality
A set of very practical tools to analyse seasonal fluctuations990Discussadd_shopping_cart$25.00Horizontal Waterfall Chart
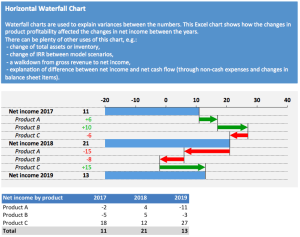
A smart and efficient chart with detailed step-by-step instructions1,113Discussadd_shopping_cart$7.00VBA Interface Collection (full version)
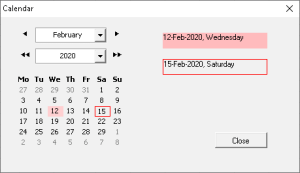
A set of Excel VBA macros aimed at enhancing user interface9251add_shopping_cart$25.00Interim Budgeting (Reforecasting)
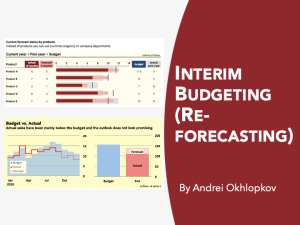
Tools to depict the mid-year status, estimate if the outlook looks reasonable and assess the accuracy of past forecasts1,030Discussadd_shopping_cart$20.00Real Estate Acquisition Financial Model
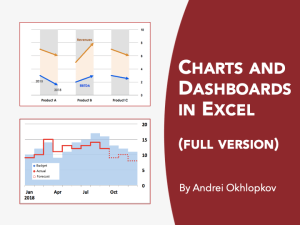
A professional model for real estate acquisition (buy – hold – sell)481Discussadd_shopping_cart$59.00Charts and Dashboards in Excel (full version)
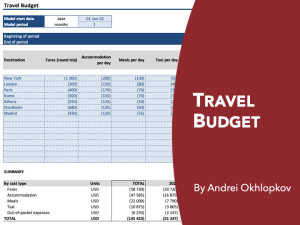
Explains the basics of designing professional charts in Excel with practical examples (full version)964Discussadd_shopping_cart$20.00Travel Budget
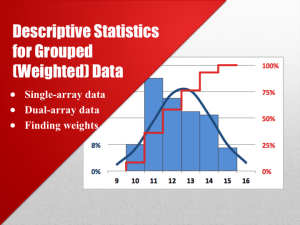
A professional template to budget travel expenses445Discussadd_shopping_cart$15.00Descriptive statistics for grouped (weighted) data
Calculating key statistics measures (average, median, standard deviation, skewness etc.) for grouped or weighted data2,038Discussadd_shopping_cartfreeArray Formulas in Excel
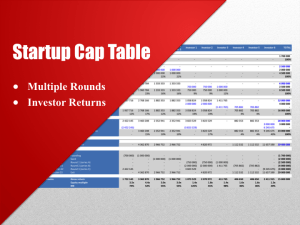
Explains array formulas and shows how they can be used in financial analysis4,621Discussadd_shopping_cartfreeStartup Cap Table
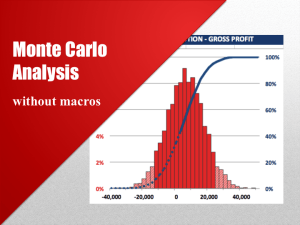
Multiple round cap table with investor returns1,832Discussadd_shopping_cartfreeMonte Carlo Analysis (without macros) Excel Model
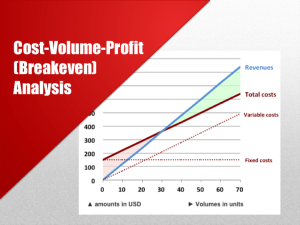
This post explains how to run full Monte Carlo analysis in Excel without macros6,1226add_shopping_cartfreeCost-Volume-Profit (Breakeven) Analysis
A template to perform cost-volume-profit (CVP, or breakeven) analysis1,657Discussadd_shopping_cartfree