DCF Valuation Model Template - 3 Scenarios, WACC Build & Dual Terminal Value
Originally published: 07/08/2026 12:57
Publication number: ELQ-54243-1
View all versions & Certificate
certified

DCF Valuation Model Template - 3 Scenarios, WACC Build & Dual Terminal Value

10-year unlevered DCF in Excel: Base/Bull/Bear switch, CAPM WACC build, perpetuity and exit-multiple terminal value, two 2-way sensitivity grids.

Description
What this model does
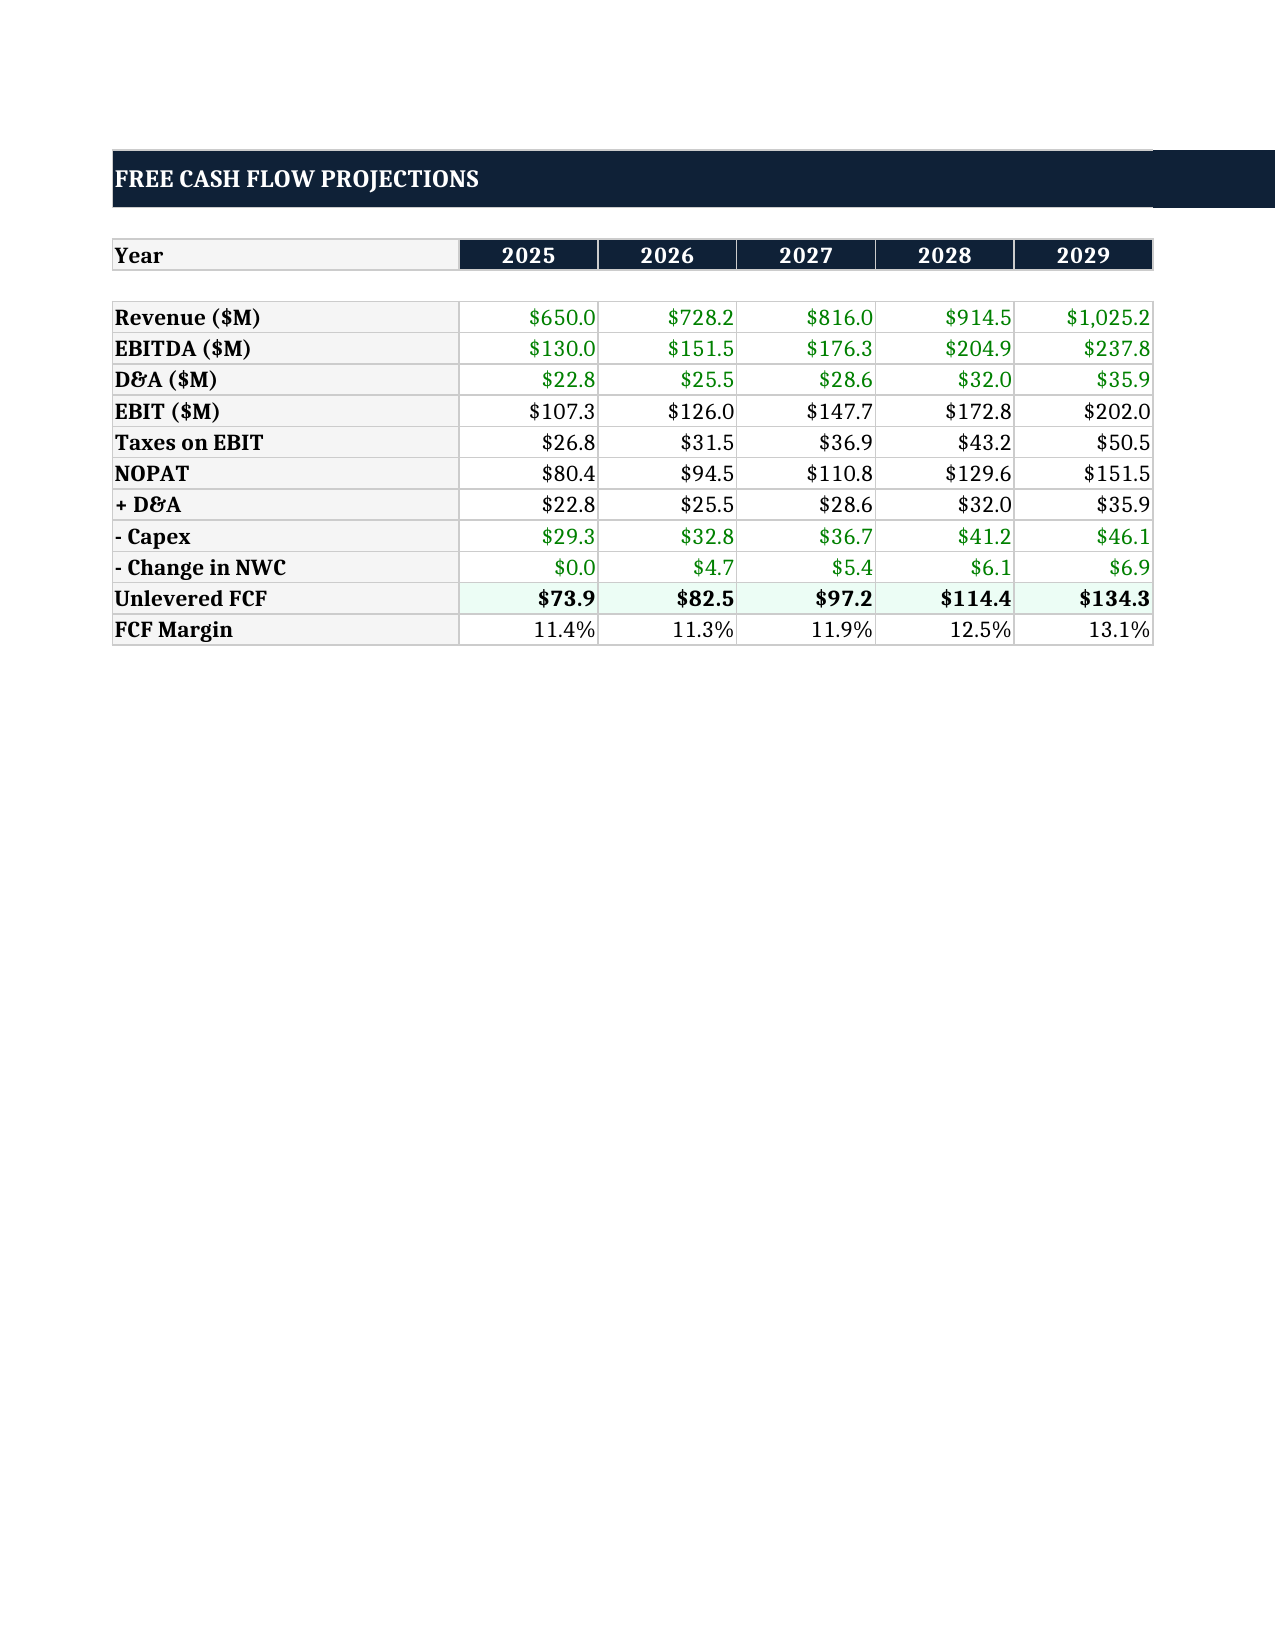
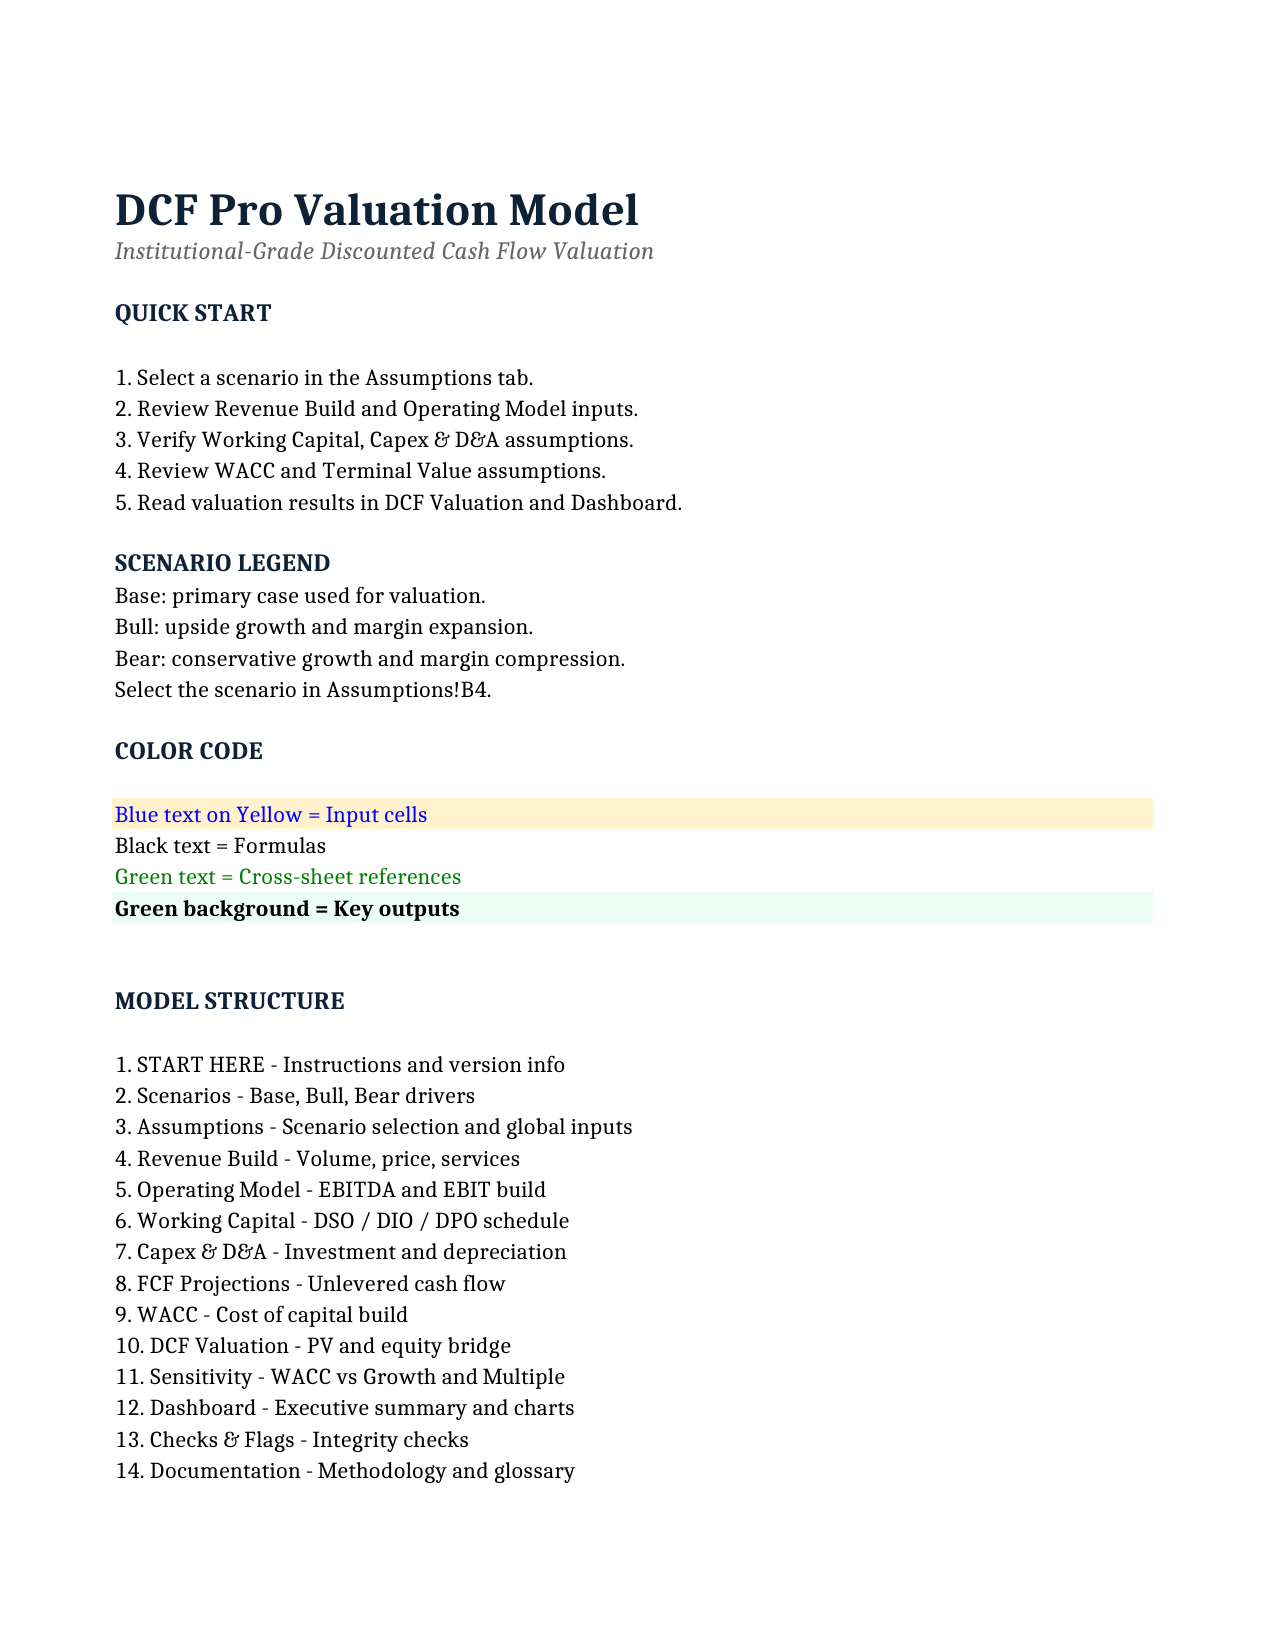
FinModelAI DCF Pro is a 14-tab unlevered discounted cash flow model in Excel, built around 800 live formulas. You set the operating and capital-cost drivers once, pick a scenario, and the workbook carries them through revenue build, EBITDA, working capital, capex and D&A to unlevered free cash flow, an enterprise value, a full equity bridge and an implied share price. No macros, no VBA, no add-ins, no iterative calculation.

Three-scenario engine driven by one cell
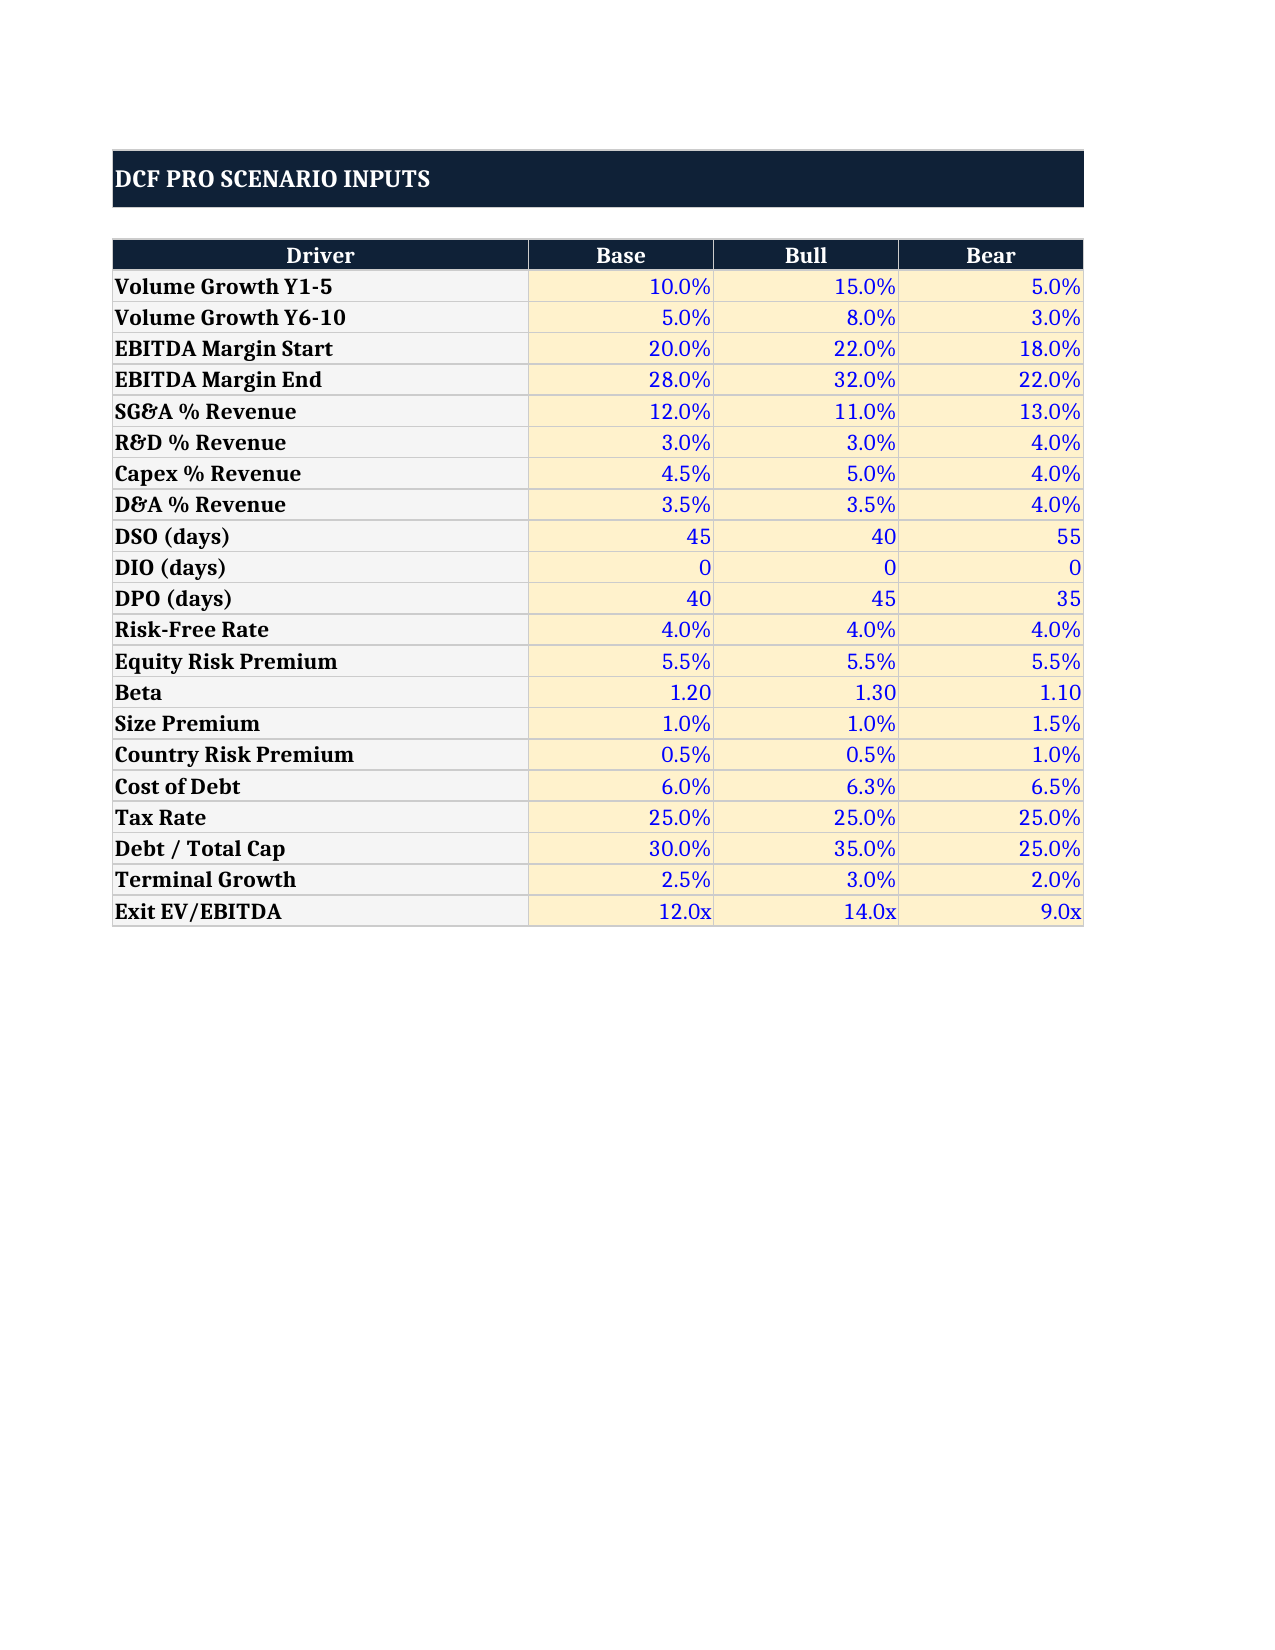
The Scenarios tab holds 21 drivers side by side under Base, Bull and Bear: volume growth for years 1-5 and 6-10, EBITDA margin start and end, SG&A and R&D as a percentage of revenue, capex and D&A intensity, DSO / DIO / DPO, the complete WACC input set, terminal growth and exit multiple. Assumptions!B4 is the single switch. Change that one cell and every downstream tab repoints to the selected column through INDEX/MATCH lookups. No duplicate files, no overwriting inputs by hand to test a case.

A cost of capital you can defend
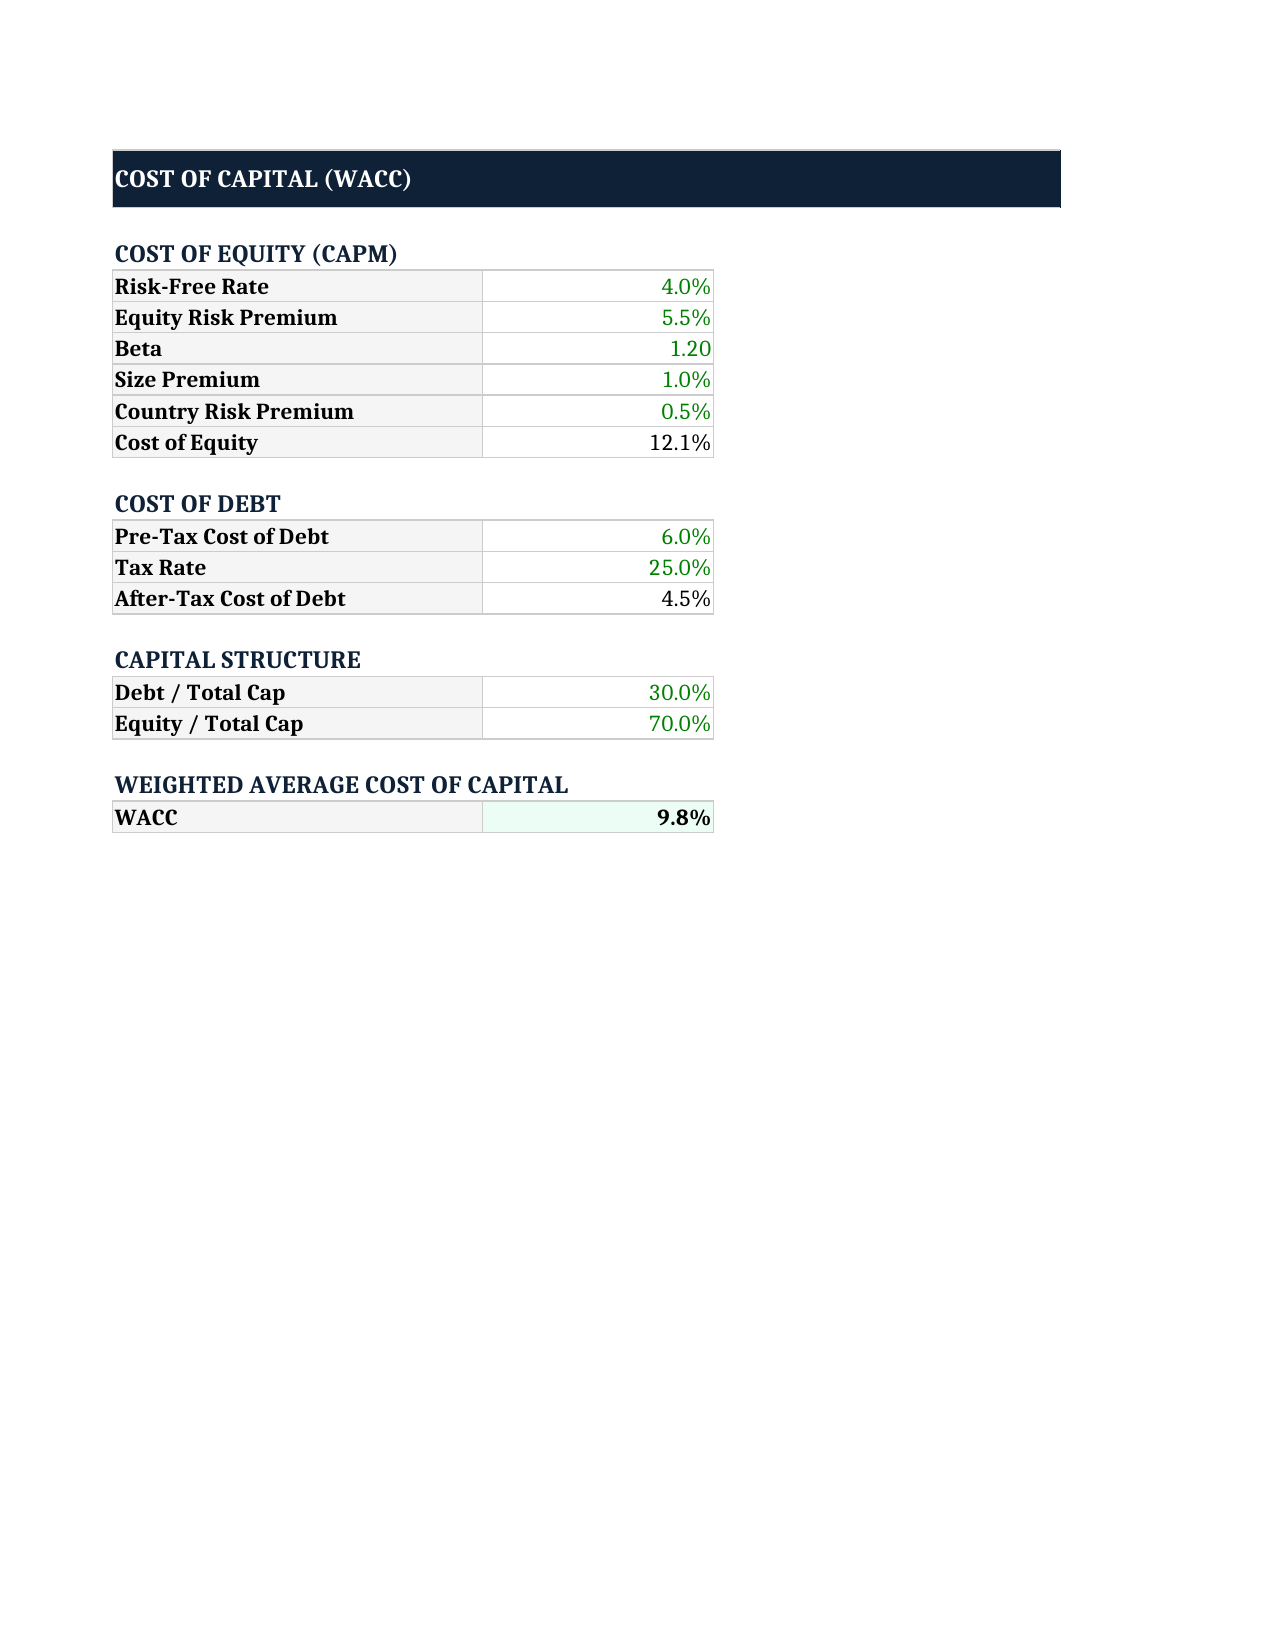
The WACC tab builds cost of equity from CAPM explicitly: risk-free rate, equity risk premium, beta, size premium and country risk premium are separate visible lines, not a single blended number. After-tax cost of debt and the debt / equity weights sit next to them, and the final WACC is a formula you can trace back to its inputs.

Two terminal values, computed side by side
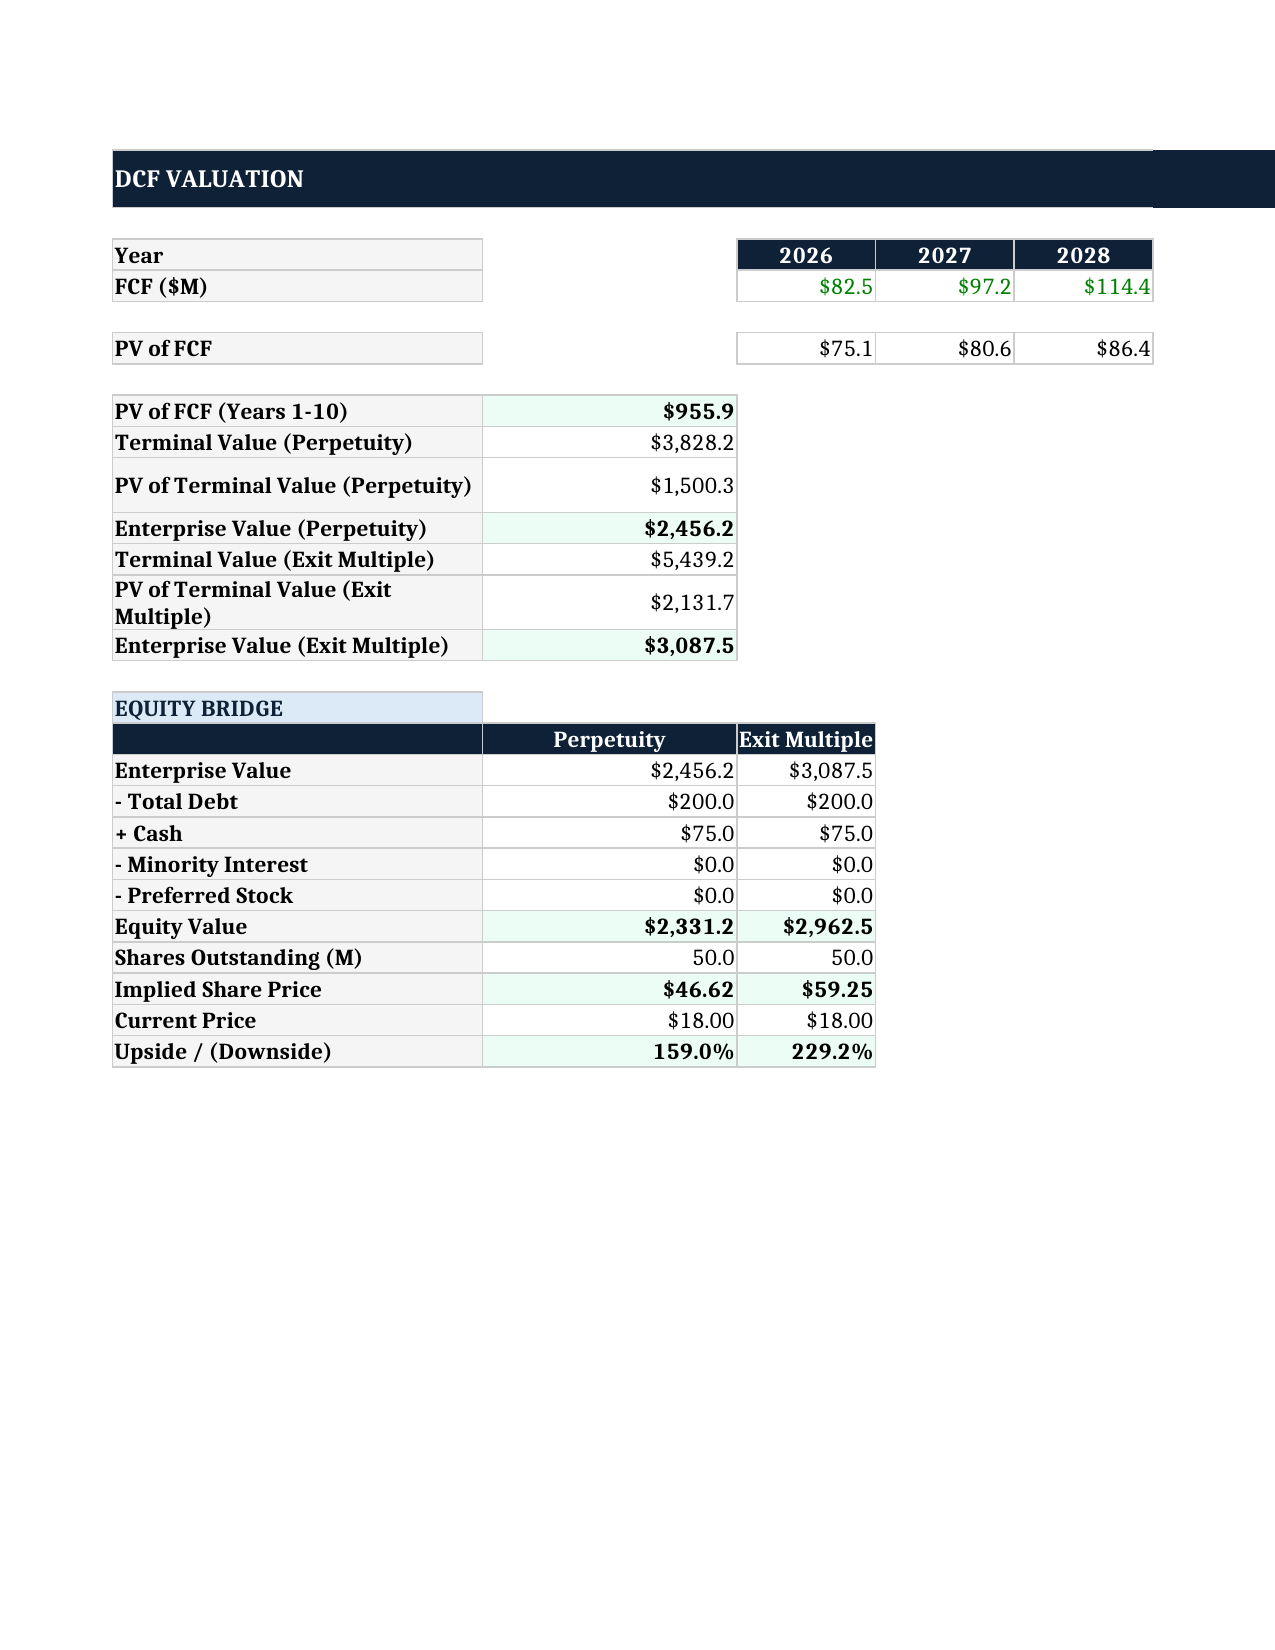
The DCF Valuation tab computes terminal value twice - Gordon growth perpetuity and exit EV/EBITDA multiple - and runs both through the same equity bridge: less total debt, plus cash, less minority interest, less preferred stock, divided by shares outstanding. You read two implied share prices and two upside / downside figures in the same view instead of flipping a method switch and losing the comparison.

Two 2-way sensitivity grids, not one
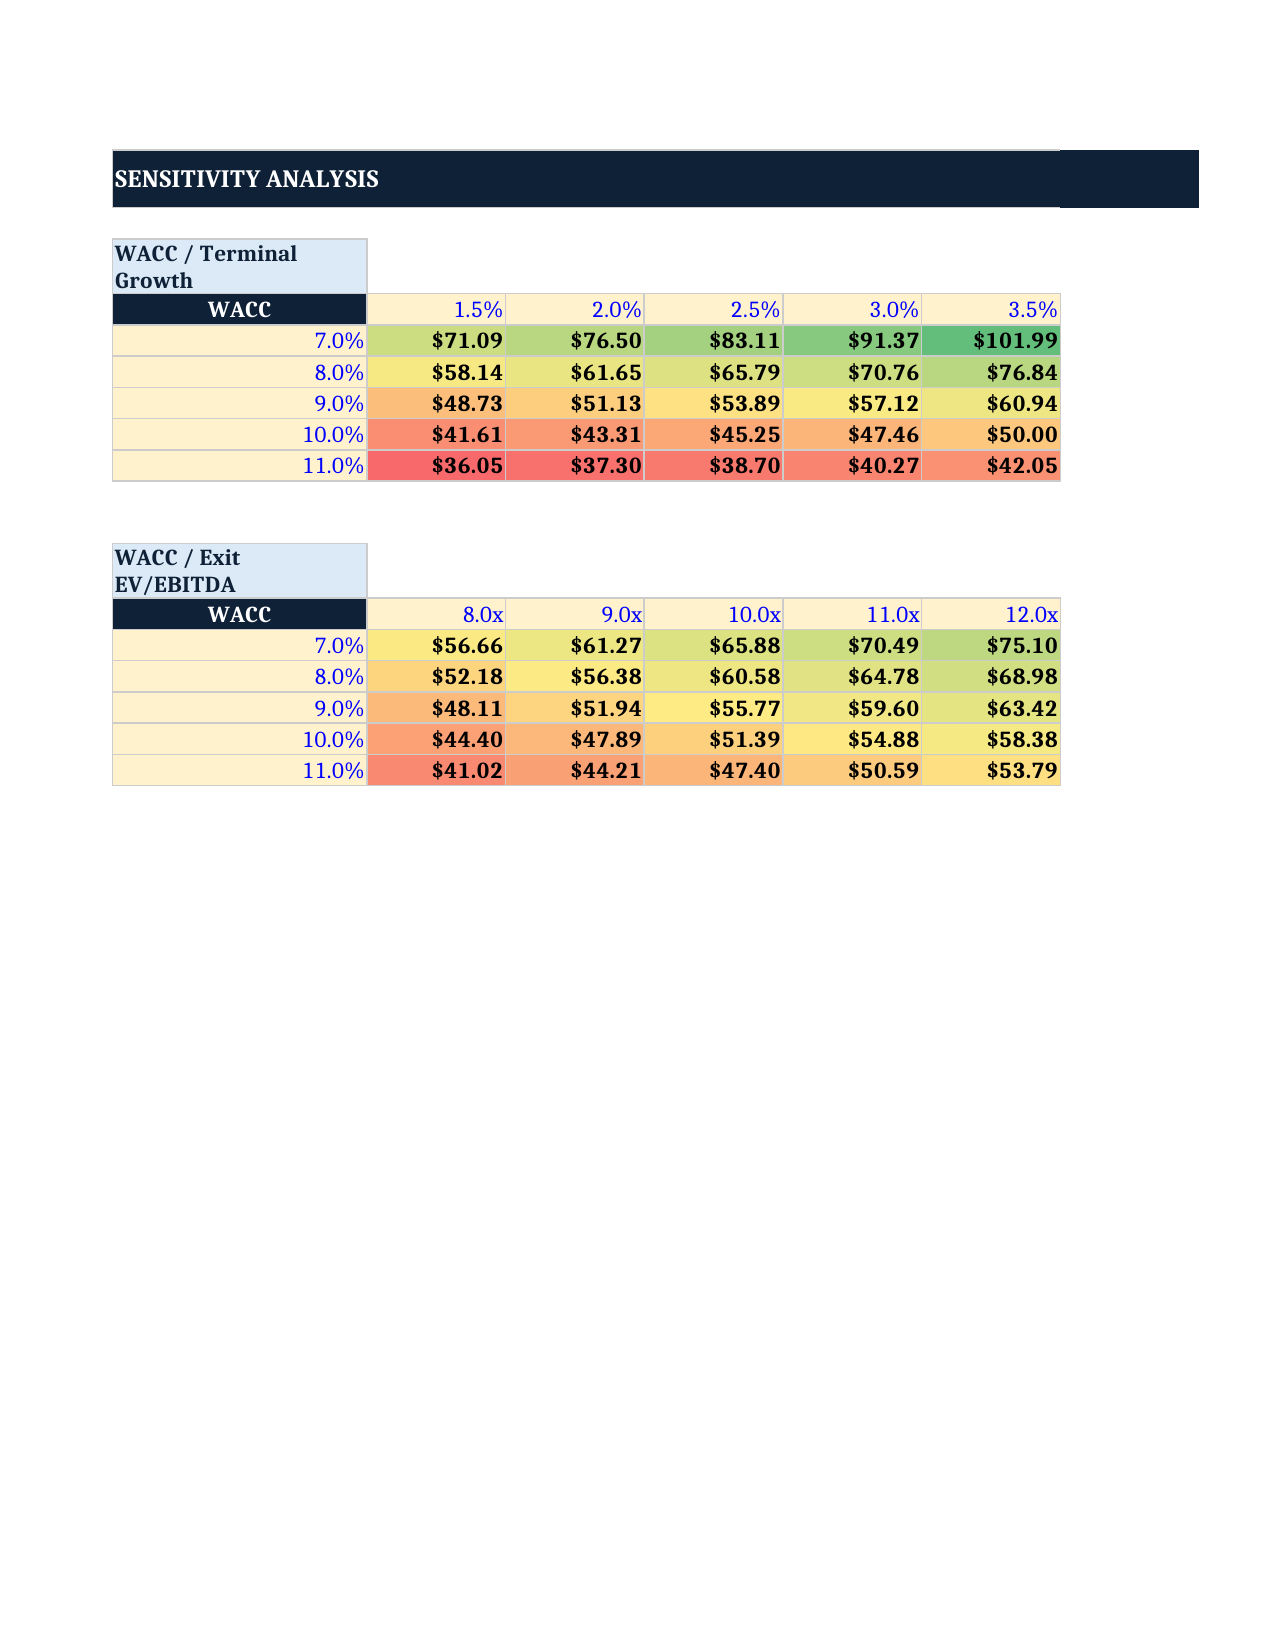
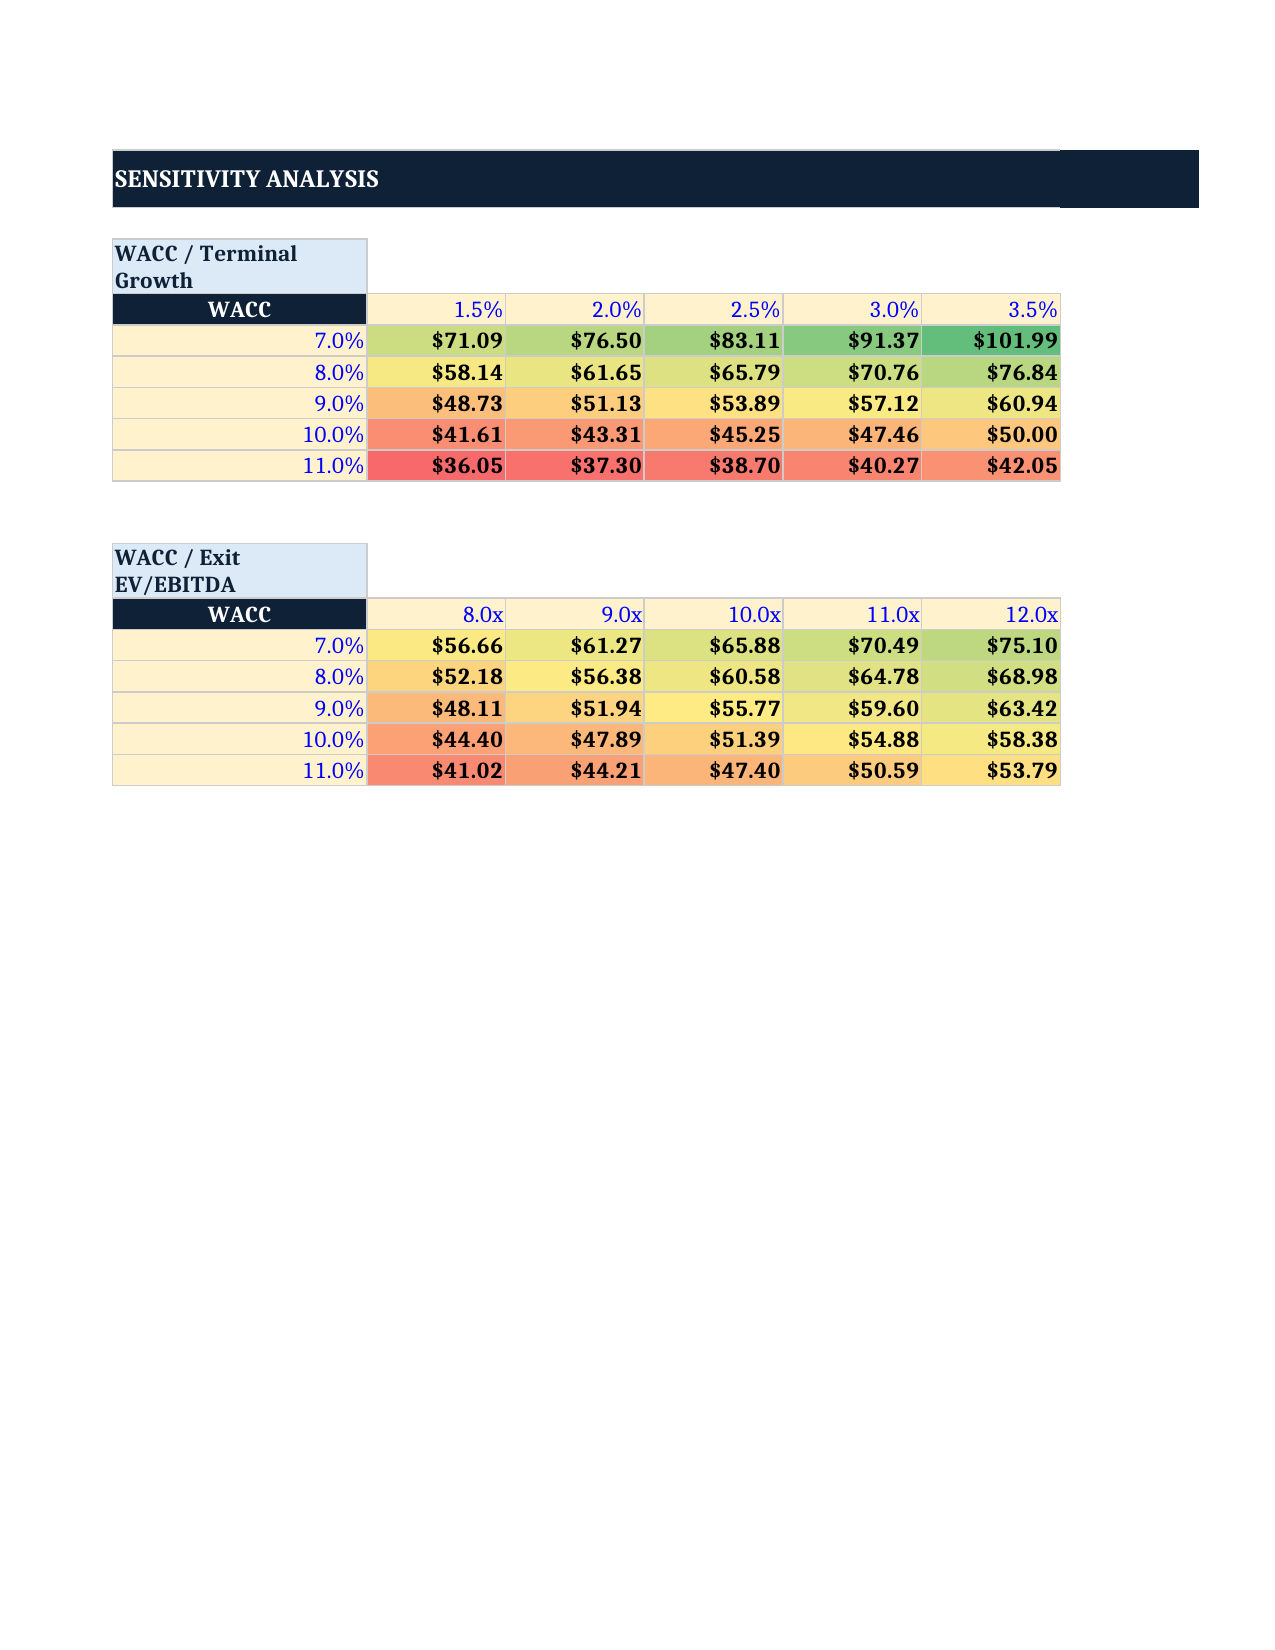
WACC (7% to 11%) crossed with terminal growth (1.5% to 3.5%), and WACC (7% to 11%) crossed with exit EV/EBITDA (8.0x to 12.0x). Every cell is a full recomputation of implied share price from the projected cash flow stream, so both terminal-value methods can be read across the same discount-rate range.

Checks & Flags tab
Fourteen automated integrity tests run on every recalculation: WACC greater than terminal growth, terminal growth within 0% to 5%, exit multiple within 4x to 20x, both growth rates and the ending EBITDA margin within sane bounds, capex intensity within 0% to 15%, DSO / DIO / DPO within range, shares outstanding positive, implied share price positive, and derived COGS between 0% and 100% of revenue. A COUNTIF returns the flag total and a single cell reports OK or REVIEW. This is the tab that catches a mistyped assumption before it becomes a valuation number.

The 14 tabs
START HERE · Scenarios · Assumptions · Revenue Build · Operating Model · Working Capital · Capex & D&A · FCF Projections · WACC · DCF Valuation · Sensitivity · Dashboard · Checks & Flags · Documentation

Conventions and what you see on opening
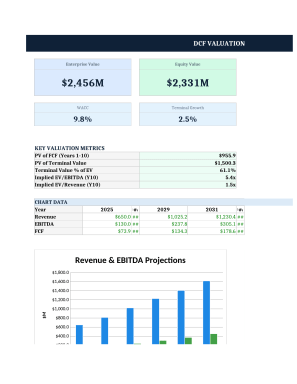
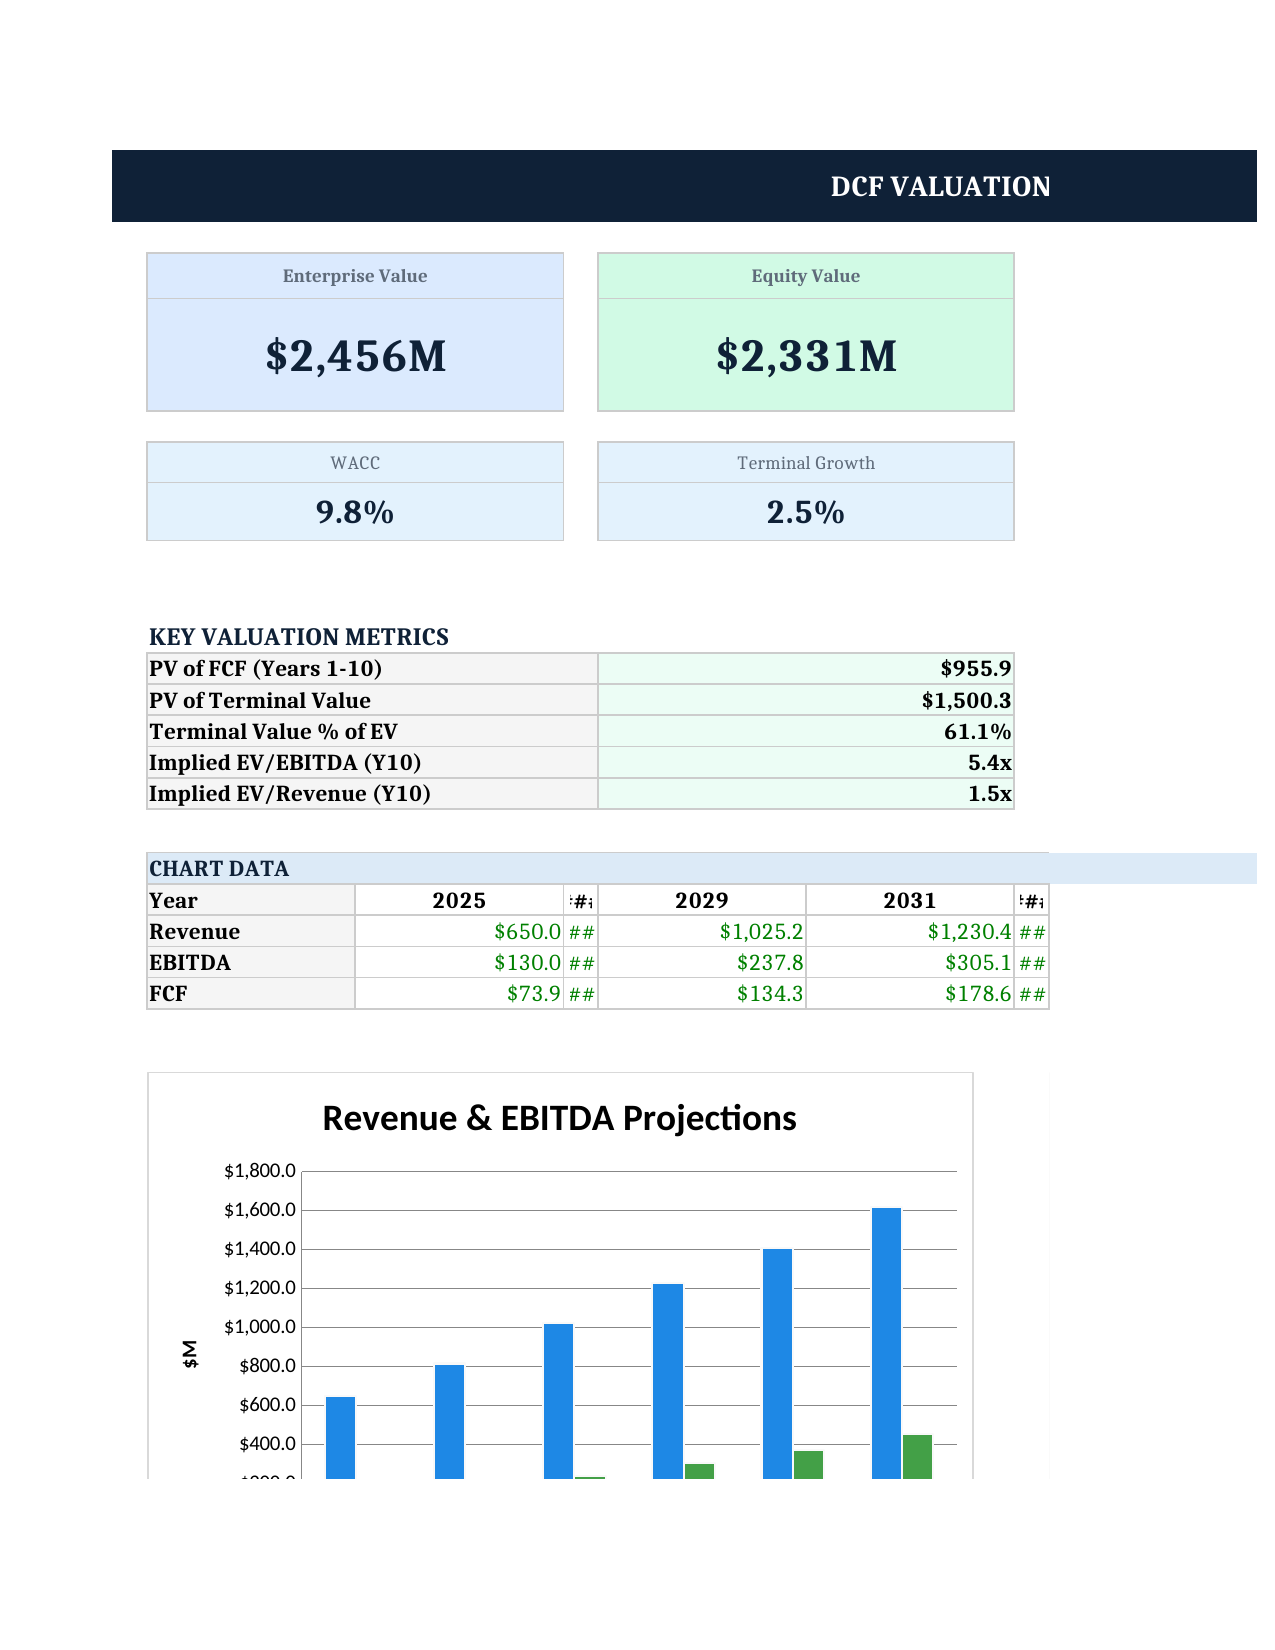
Consistent colour coding throughout: blue text on yellow fill marks the input cells you edit, black marks formulas, green marks cross-sheet links, green fill marks key outputs. The forecast is a 10-year explicit projection. Sample data is pre-filled so every tab is populated the moment you open the file. The Dashboard reports enterprise value, equity value, implied share price and upside / downside, plus terminal value as a percentage of EV, implied EV/EBITDA and EV/Revenue, revenue CAGR, and two charts of revenue, EBITDA and free cash flow.

What is deliberately not in this model
Stated plainly on the START HERE tab so you know before you buy: the model is EBITDA-driven, so COGS is derived rather than input directly. It does not cover SaaS cohort metrics, stock-based compensation detail, NOL carryforwards, mid-year discounting convention, or unlevered / relevered beta calculations.

Delivery
Instant download of the Excel workbook plus a README covering quick start, a tab-by-tab guide, the colour code and compatibility notes. Designed and tested for Microsoft Excel on Windows and Mac.

This Best Practice includes
1 Excel workbook (.xlsx, 14 tabs, 800 live formulas) + 1 README guide (tab-by-tab walkthrough, quick start, colour code, compatibility notes).

Acquire business license for $69.00

Add to cart

Add to bookmarks

Discuss

Further information

Value a company with a defensible, fully traceable unlevered DCF. You set the operating and capital-cost drivers once; the workbook carries them through revenue, EBITDA, working capital, capex and free cash flow to an enterprise value, an equity bridge and an implied share price, under three scenarios and two terminal-value methods, with 14 automated integrity checks running on every recalculation.

You need a 10-year unlevered DCF you can hand to an investment committee, a lender or a client and defend line by line. You want Base / Bull / Bear cases driven from one switch rather than three copies of a file. You want the cost of capital built from its CAPM components instead of a hardcoded rate. You want perpetuity growth and exit multiple side by side rather than a toggle. You work in Excel and cannot use macros or add-ins.

You need SaaS-specific mechanics (cohorts, churn, billings, deferred revenue). You need stock-based compensation detail, NOL carryforwards, mid-year discounting convention, or unlevered/relevered beta calculations - none of these are modelled. You want gross margin as a direct input: this model is EBITDA-driven and derives COGS as (1 - EBITDA% - SG&A% - R&D%). You need a levered / equity-FCF DCF, a full three-statement build, or an LBO.


0.0 / 5 (0 votes)

please wait...