SaaS ARR Bridge & Net Revenue Retention Model with Quick Ratio and Rule of 40 (Excel)
Originally published: 23/09/2026 16:30
Publication number: ELQ-86924-1
View all versions & Certificate
certified

SaaS ARR Bridge & Net Revenue Retention Model with Quick Ratio and Rule of 40 (Excel)

An ARR walk that reconciles on every month and every quarter, retention measured three independent ways, and the efficiency metrics investors ask for.

Description
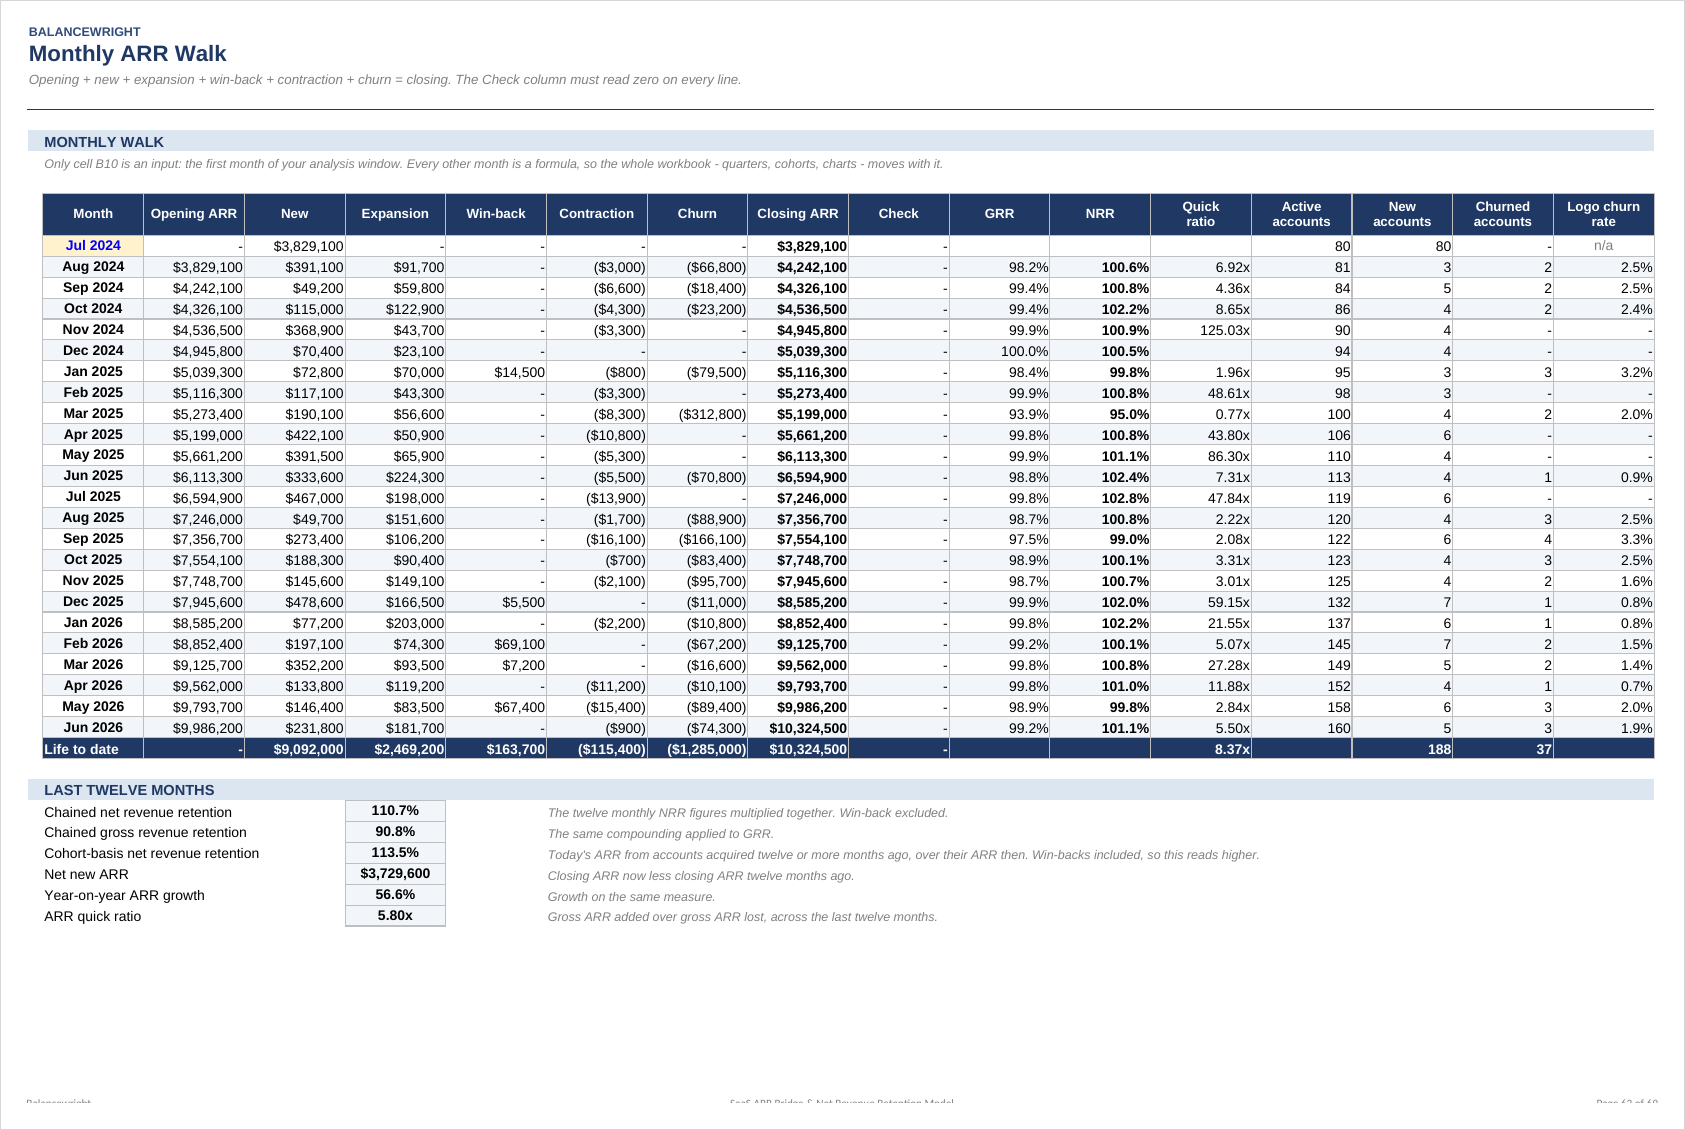
Give the workbook one row per account per month and it returns the ARR walk that a board pack, a diligence request or an investor update is built on: opening ARR, new business, expansion, win-back, contraction, churn, closing ARR - reconciling on every single month and, independently, on every single quarter.

WIN-BACK IS ITS OWN LINE, AND THAT MATTERS

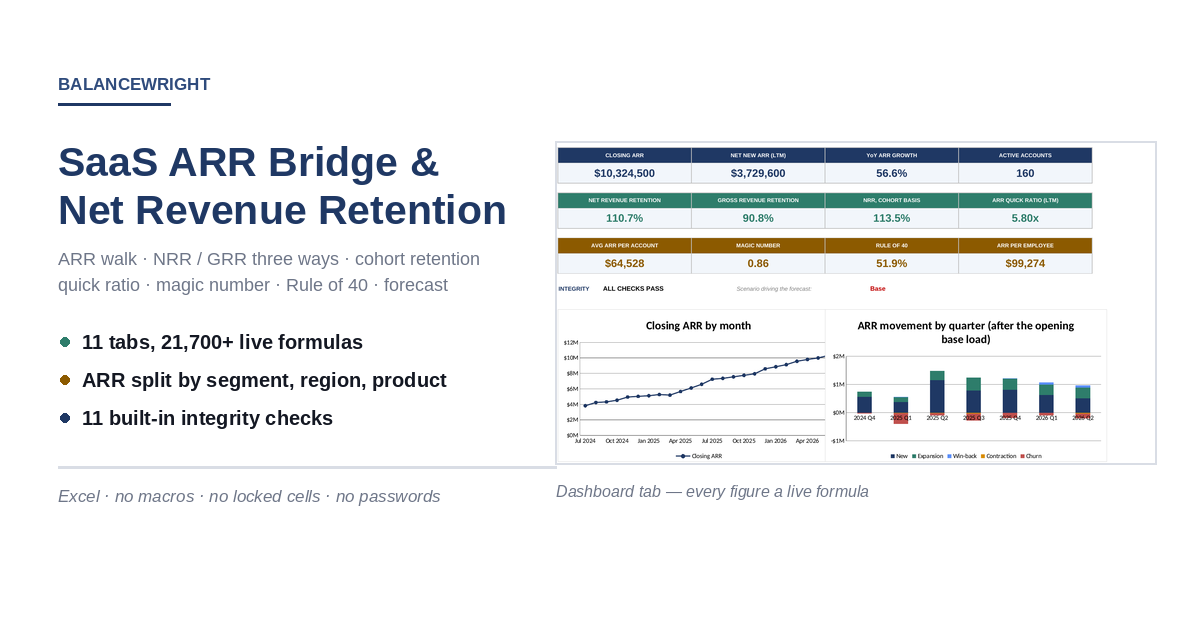
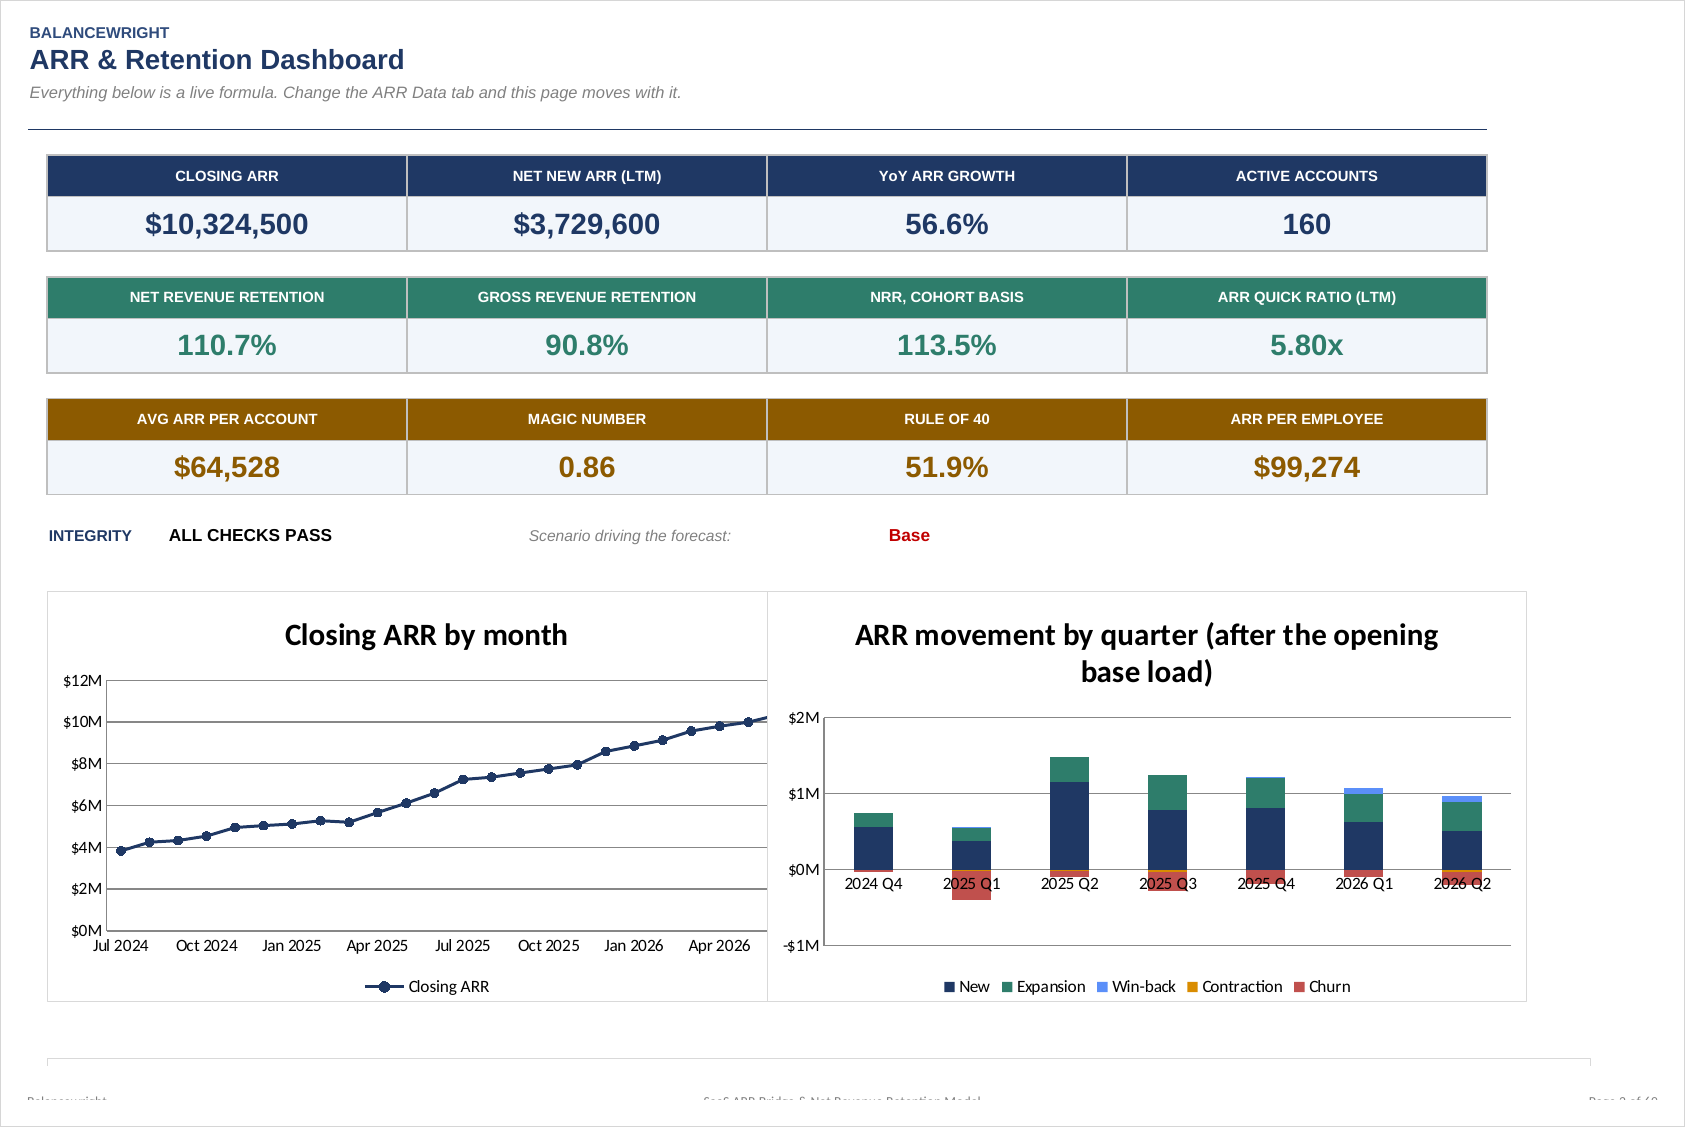
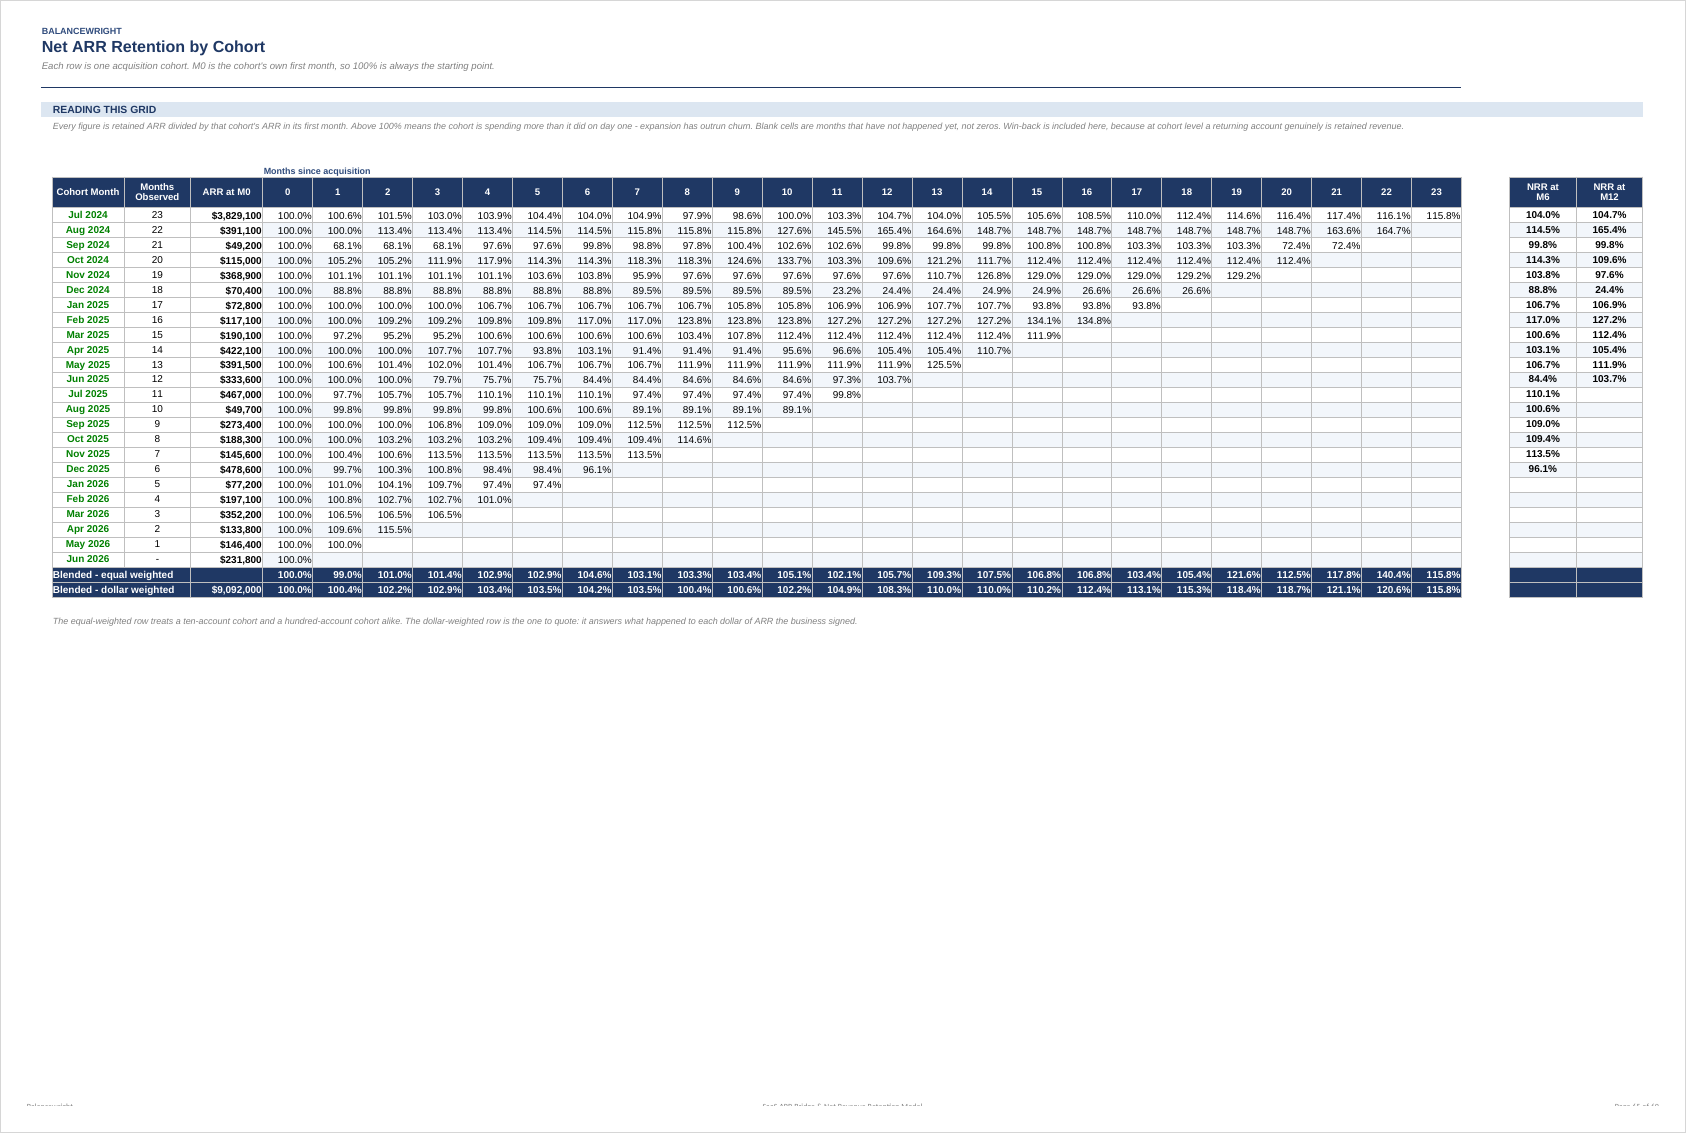
An account that had zero ARR last month and was acquired at some earlier point is not new business and it is not retention. Most models quietly put it in one or the other, which flatters whichever figure it lands in. Here it is a separate line in the walk, excluded from net revenue retention - the stricter and more defensible reading - and included in the cohort grid, because at cohort level a returning account genuinely is retained revenue. Both figures sit side by side on the Dashboard so you can see the difference rather than argue about it.

RETENTION, MEASURED THREE WAYS

Chained net revenue retention: the twelve monthly figures multiplied together, because averaging twelve monthly rates overstates a declining book. Chained gross revenue retention on the same basis. And cohort-basis net revenue retention: today's ARR from accounts acquired twelve or more months ago over their ARR then. They answer different questions and they do not agree, which is exactly why the file reports all three instead of picking one.

THE EFFICIENCY METRICS INVESTORS ACTUALLY ASK ABOUT

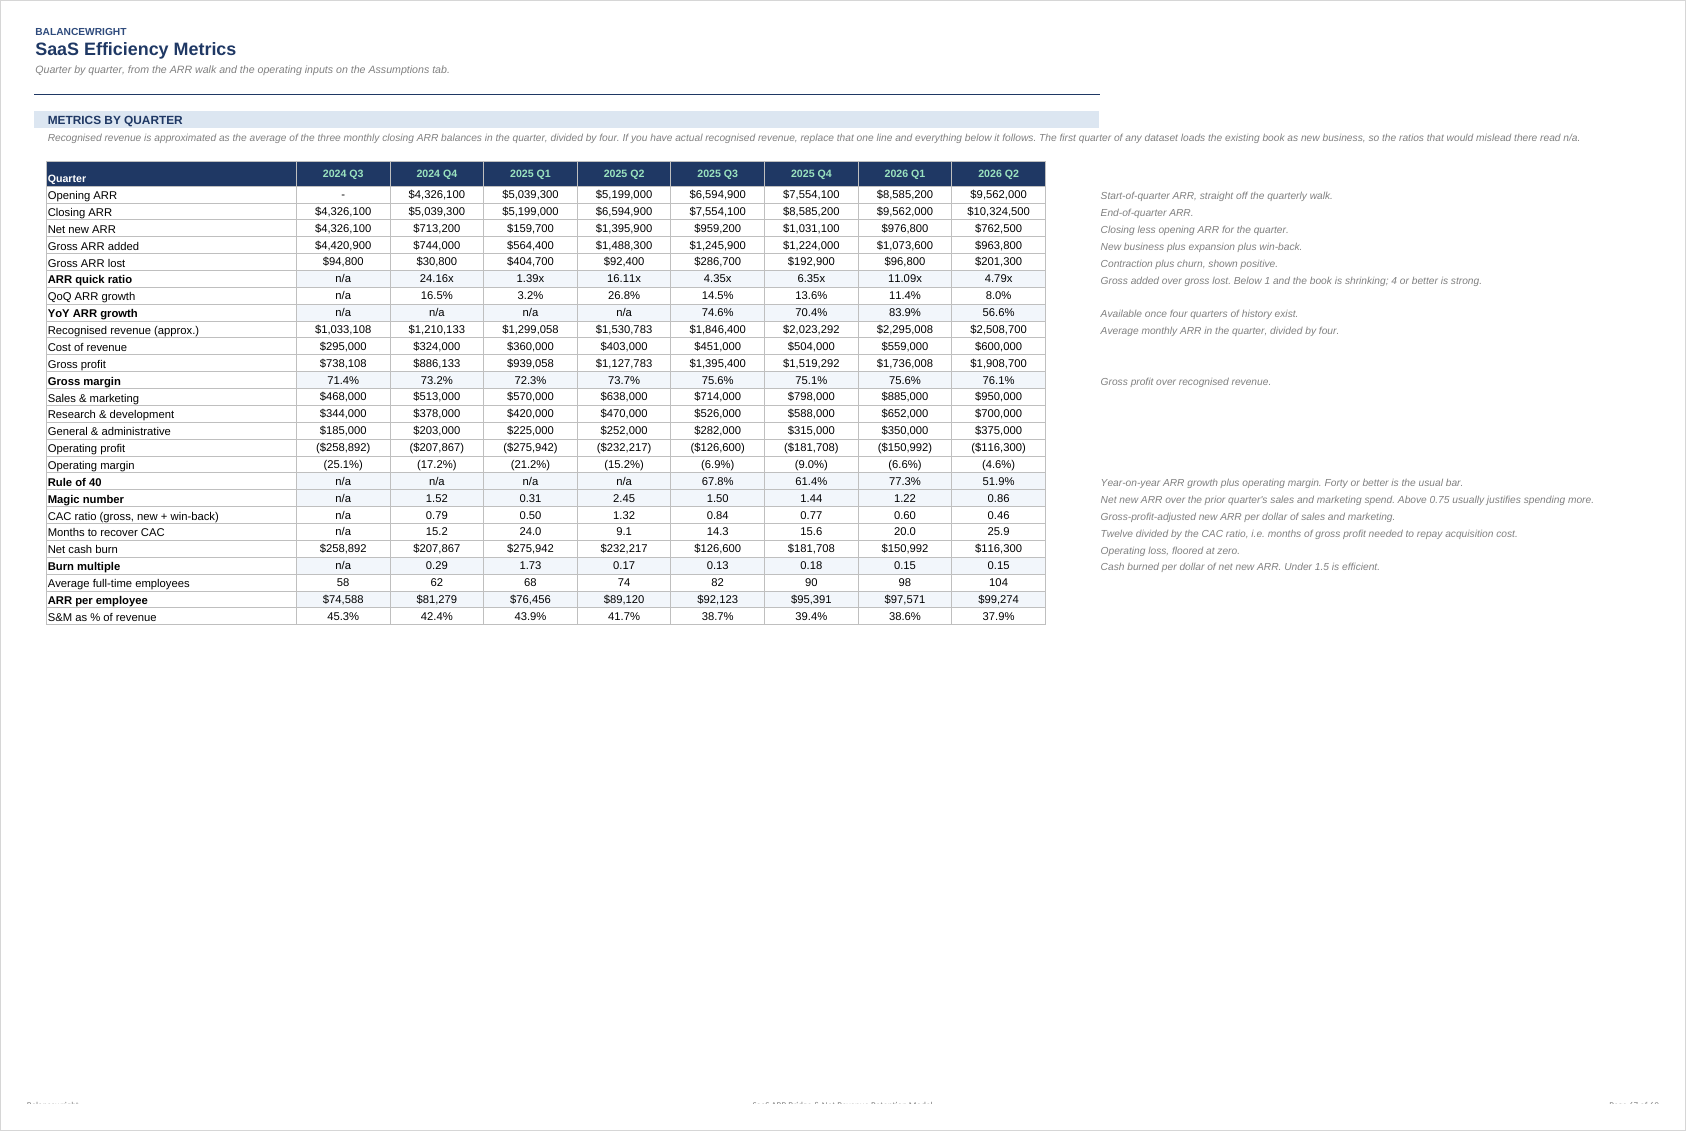
Twenty-six lines per quarter: ARR quick ratio, quarter-on-quarter and year-on-year growth, recognised revenue, gross margin, operating margin, Rule of 40, magic number, CAC ratio, months to recover CAC, net cash burn, burn multiple, ARR per employee and sales and marketing as a share of revenue. The first quarter of any dataset loads the existing book as new business, so the ratios that would mislead there read n/a rather than printing a number you would have to explain away.

THE CHURN ROW IS THE PART PEOPLE MISS

An account that cancels needs one final row, in the month it left, with ARR set to zero. Without it the model cannot tell the difference between an account that churned and an account whose data simply stops, and the churn line reads zero forever. The guide covers this in the first two pages.

THE WORKED EXAMPLE

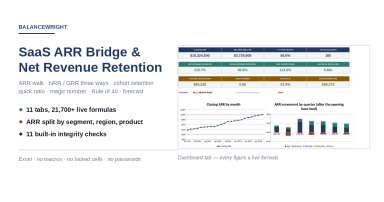
188 accounts across 24 monthly cohorts, 2,816 rows of history. Closing ARR of 10,324,500, net new ARR of 3,729,600 over the last twelve months, year-on-year growth of 56.6 per cent, 160 active accounts, net revenue retention of 110.7 per cent, gross revenue retention of 90.8 per cent, cohort-basis NRR of 113.5 per cent, an ARR quick ratio of 5.80 times, a magic number of 0.86, Rule of 40 at 51.9 per cent and ARR per employee of 99,274. Delete it and paste your own.

ELEVEN INTEGRITY CHECKS

The monthly walk ties on every month. The quarterly walk ties on every quarter, computed independently, and agrees with the monthly walk. The segment, region and product splits each reconcile to total ARR. Every account appears in exactly one cohort. No negative ARR. No month dated before its own cohort month. The live scenario resolves to five numbers. The projection never goes negative. All eleven must read PASS.

Eleven tabs, 21,718 live formulas. No macros, no add-ins, no external links, no locked cells and no passwords, and nothing that needs iterative calculation.

HONEST LIMITATIONS

The forward projection applies blended rates to the whole book, so it will not capture a change in customer mix. Recognised revenue on the efficiency tab is approximated from ARR: close enough for ratios, not your income statement. And the model reads what you give it - if the zero-ARR churn rows are missing, every retention figure will be wrong and no integrity check can tell you so.

This workbook models the arithmetic of your own data. It is not financial advice, and the worked example is invented.

This Best Practice includes
1 Excel workbook (11 tabs, 21,718 live formulas) and 1 five-page PDF guide.

Acquire business license for $69.00

Add to cart

Add to bookmarks

Discuss

Further information

Produce the ARR walk a board pack, a diligence request or an investor update is built on, and be able to prove it reconciles before anyone asks.

You report ARR to a board or an investor; you are preparing for diligence and need a walk that ties; you want retention measured on more than one basis because the definitions genuinely differ; you need quick ratio, magic number, Rule of 40 and burn multiple computed from your own numbers rather than estimated.

You need multi-currency consolidation, intercompany eliminations, a full three-statement model, or a dispatch-level view of usage-based revenue. This is one entity, one currency, monthly and quarterly periods.


0.0 / 5 (0 votes)

please wait...