
Originally published: 24/03/2022 10:14
Publication number: ELQ-35190-1
View all versions & Certificate
Publication number: ELQ-35190-1
View all versions & Certificate

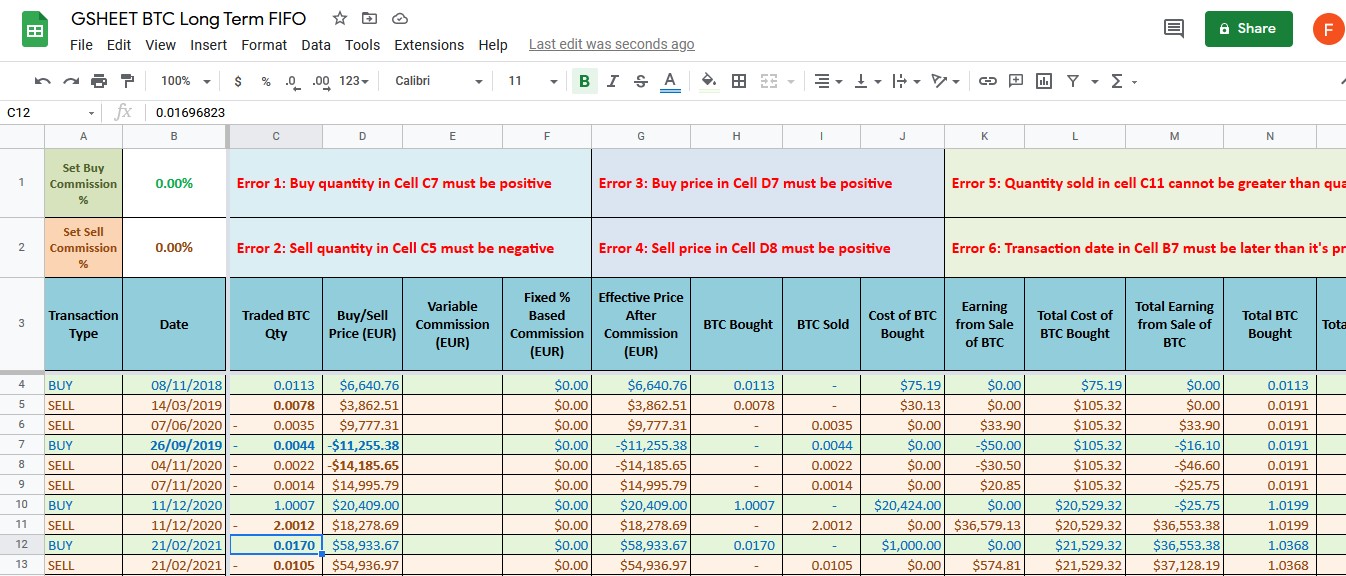
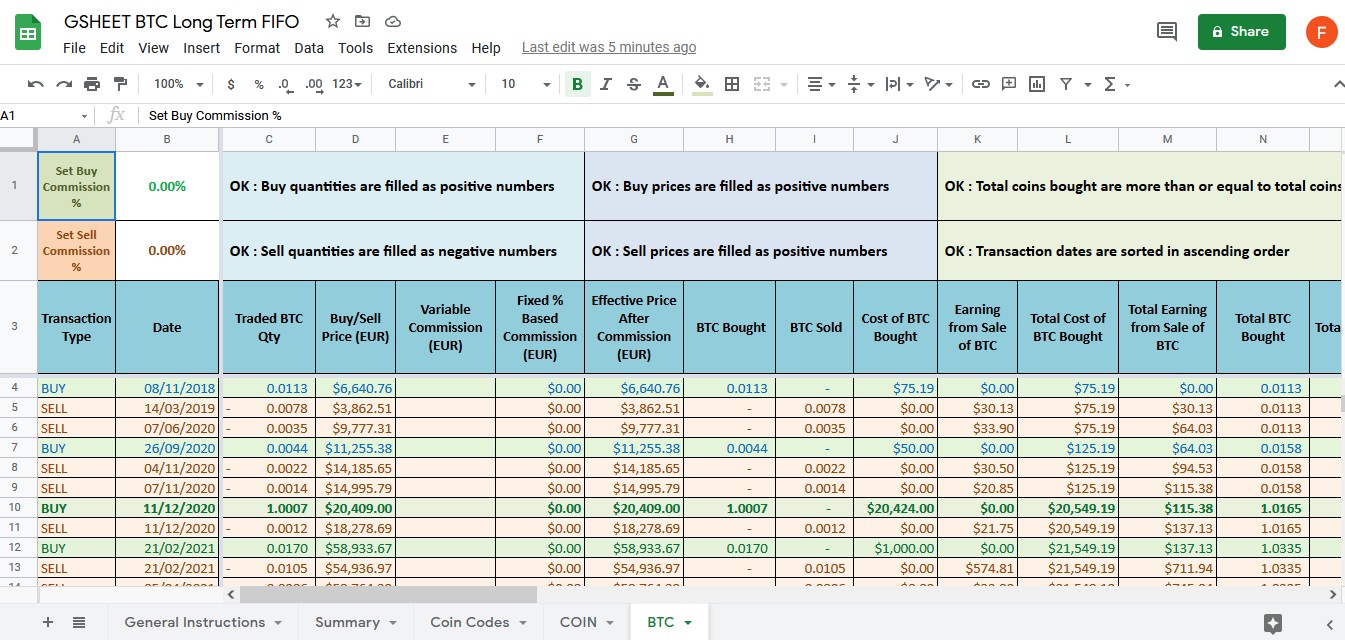
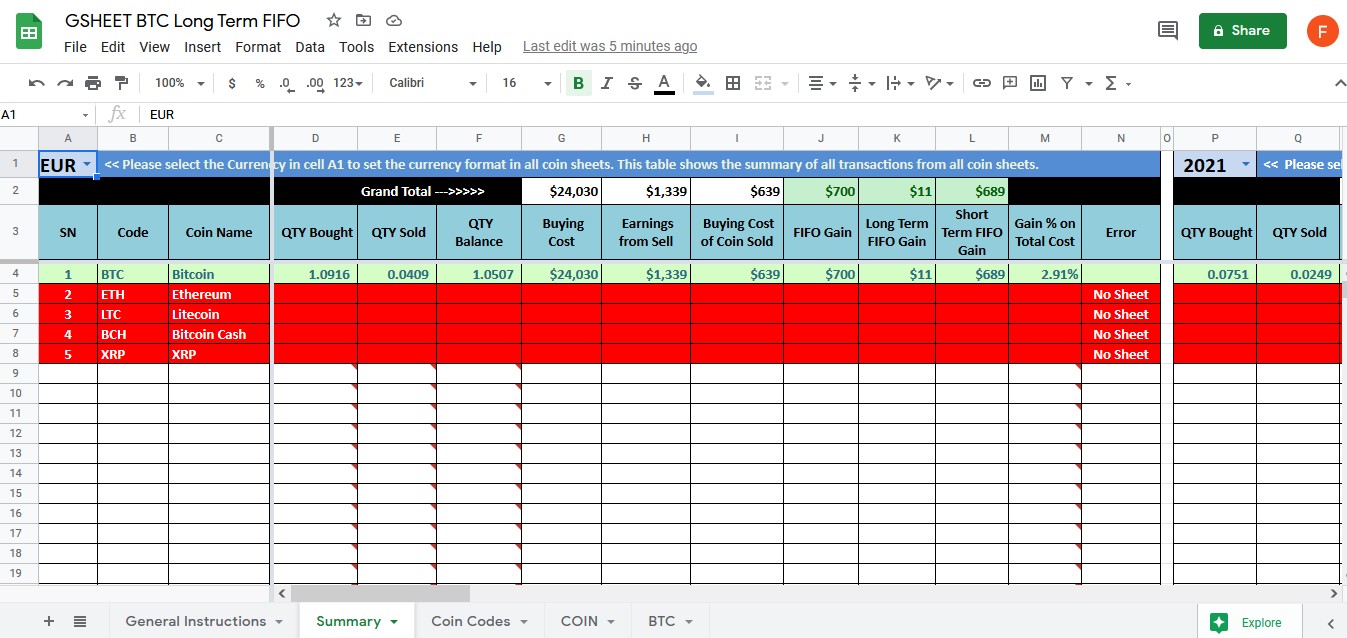
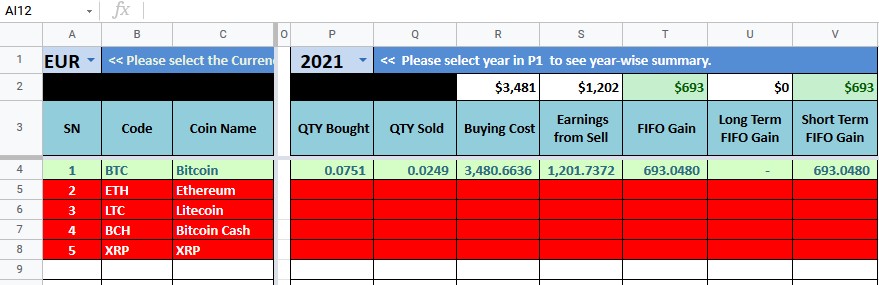
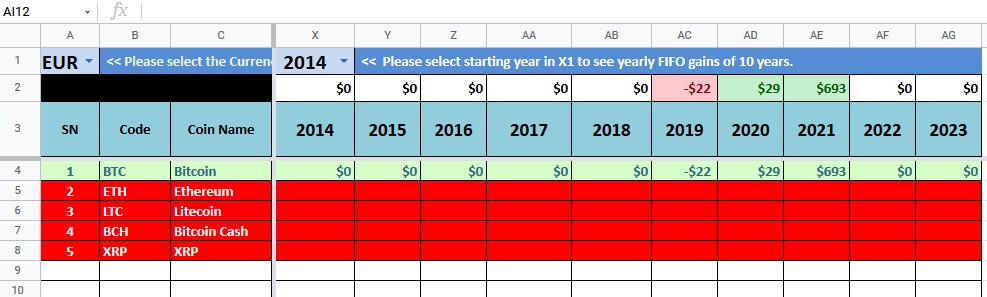
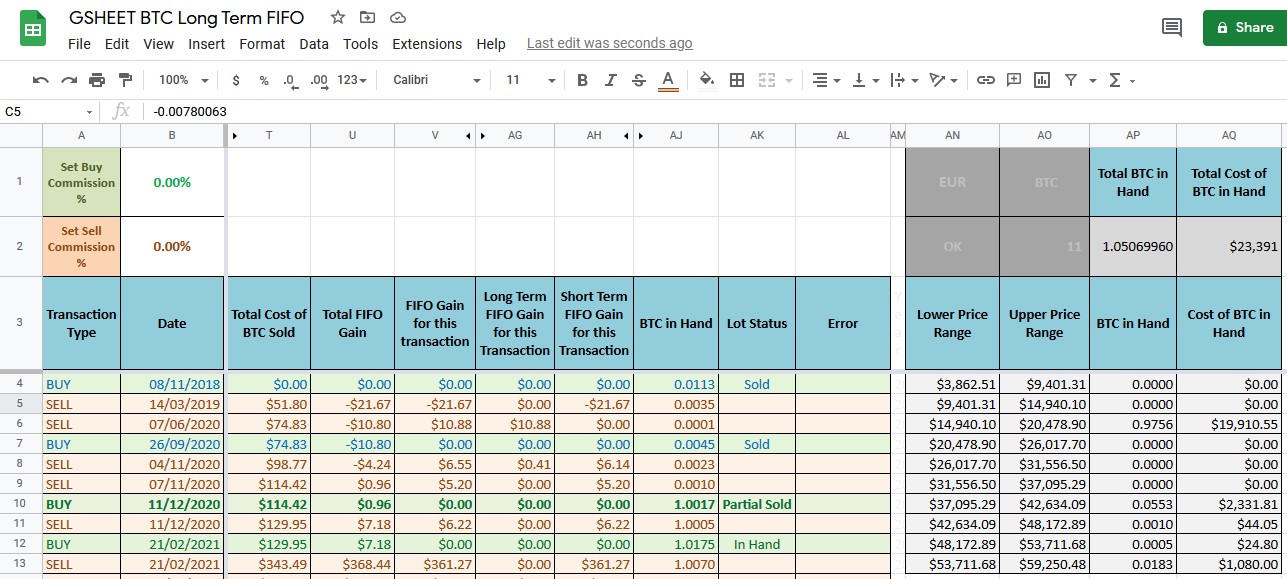
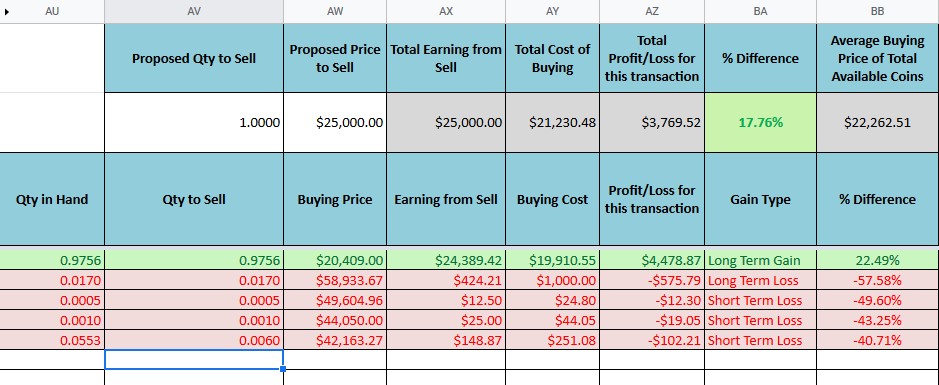
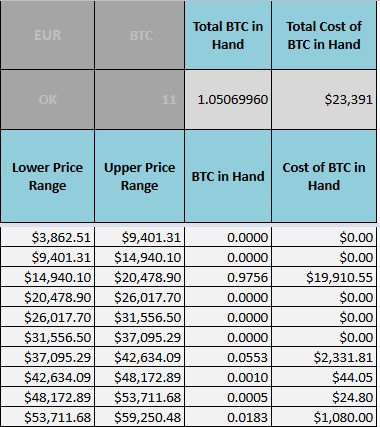
Bitcoin Long Term FIFO Gains Google Sheet Calculator with Yearly Summary
Easy-to-use Google Sheet Calculator with Yearly Summary for calculation of long term and short term profits in cryptocurrency trading using FIFO method
