
Originally published: 03/12/2021 13:40
Publication number: ELQ-51913-1
View all versions & Certificate
Publication number: ELQ-51913-1
View all versions & Certificate

Project Manager Excel Template
The Project Manager Excel Template will enable you to plan and manage a project quickly and successfully from beginning to end.
Description
The Project Manager Template is an all-inclusive method to plan and manage projects. It uses the scope of work as an input to generate a schedule and includes cost and resource management into a single solution.
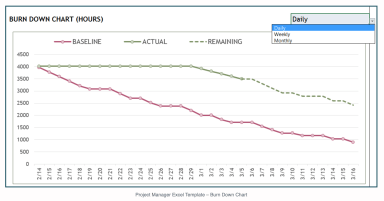
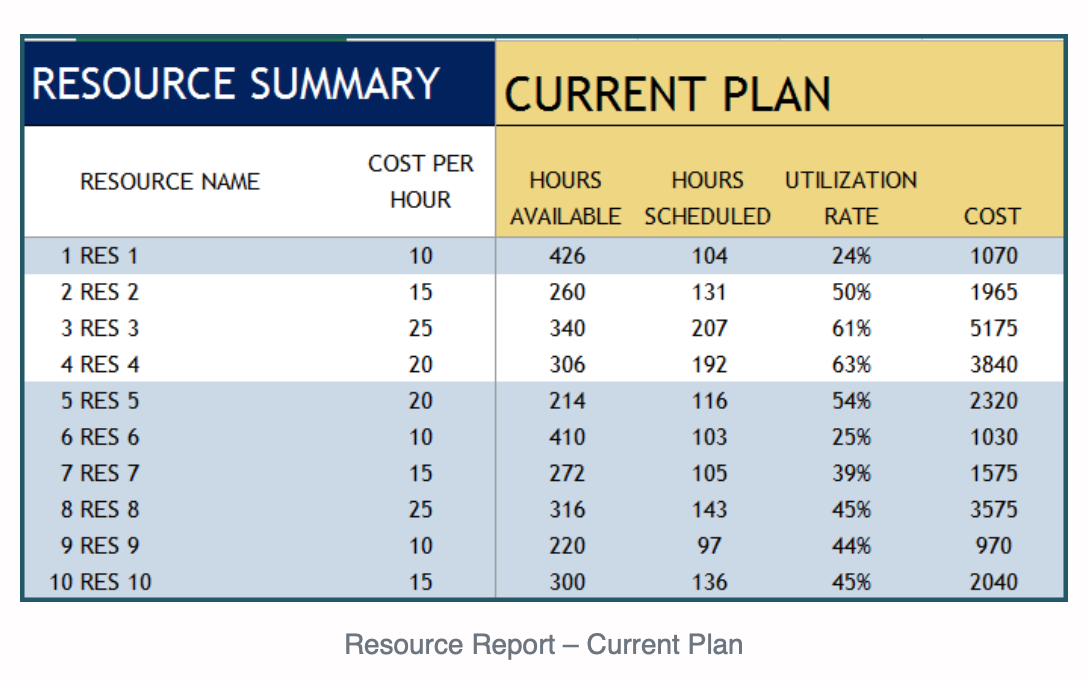
Once the project has commenced, and the actual work performed is being inputted, the current plan will be automatically updated. It is then possible to see whether the plan has diverted from the baseline. You can compare actual progress with baseline targets to assess the project’s progress against the initial objectives.
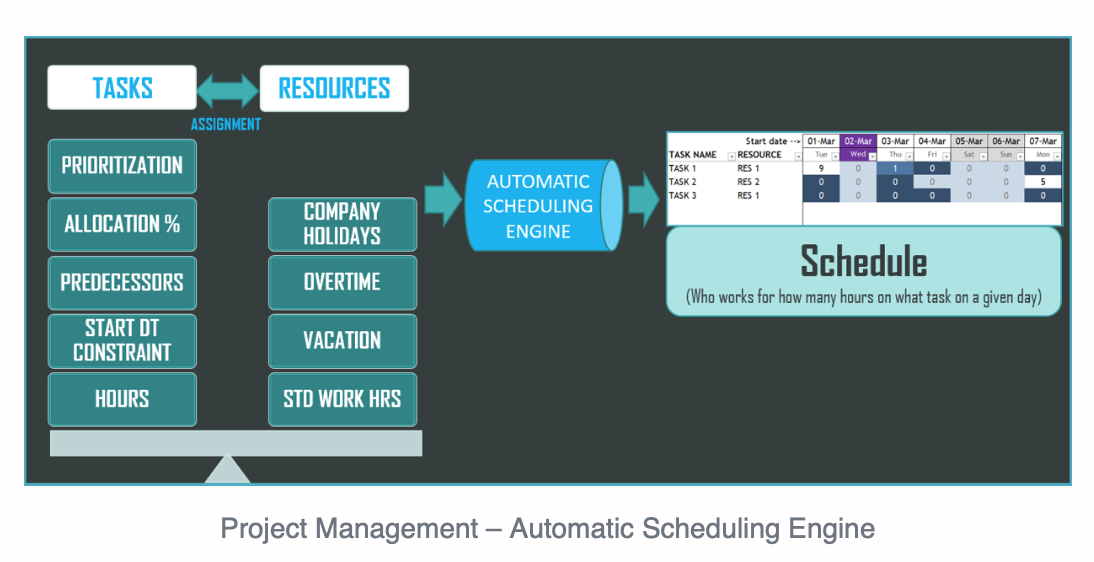
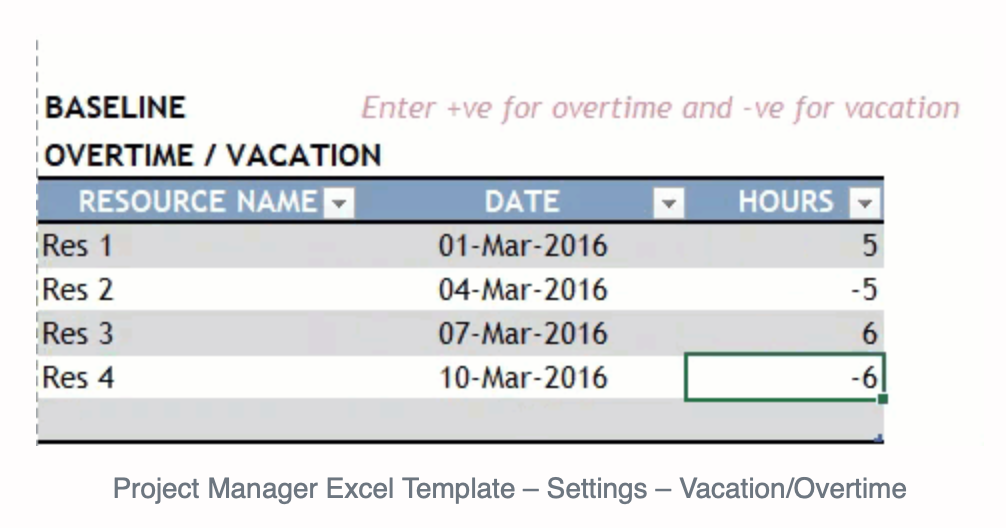
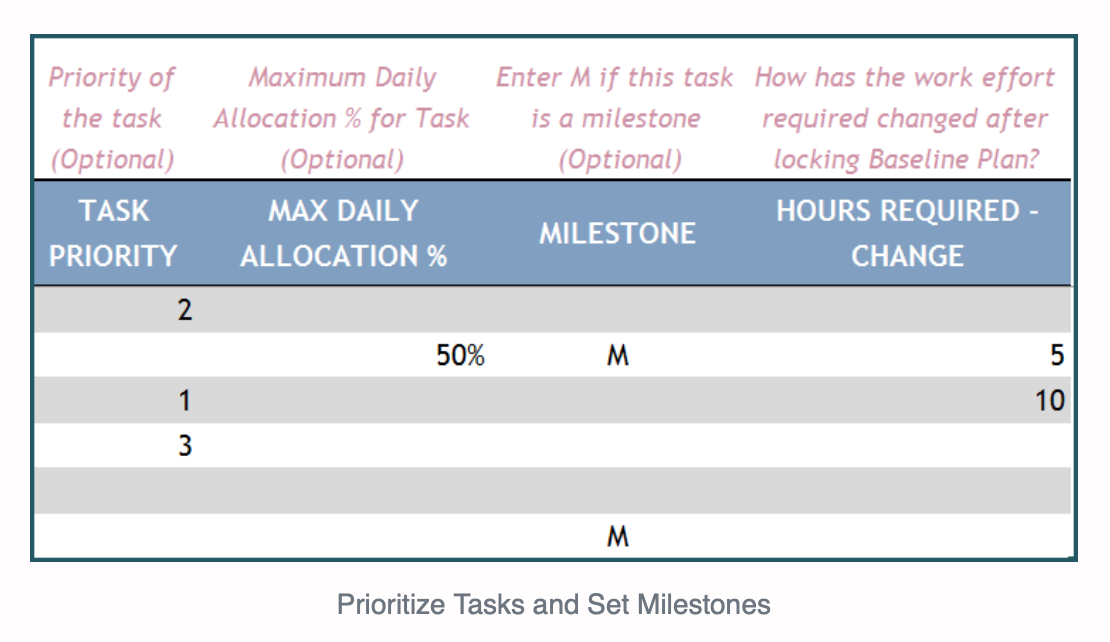
A great benefit of this template is that it will automatically generate the schedule. Simply input the resources (standard availability, vacation/overtime, and company holidays) and tasks (hours required, resource assignment, start date constraint, predecessors). The scheduling engine will then generate a schedule stating the number of hours worked on a specific task, by which employees, and on which day(s). The automation will save PM’s a significant amount of time.
The template creates two schedules:
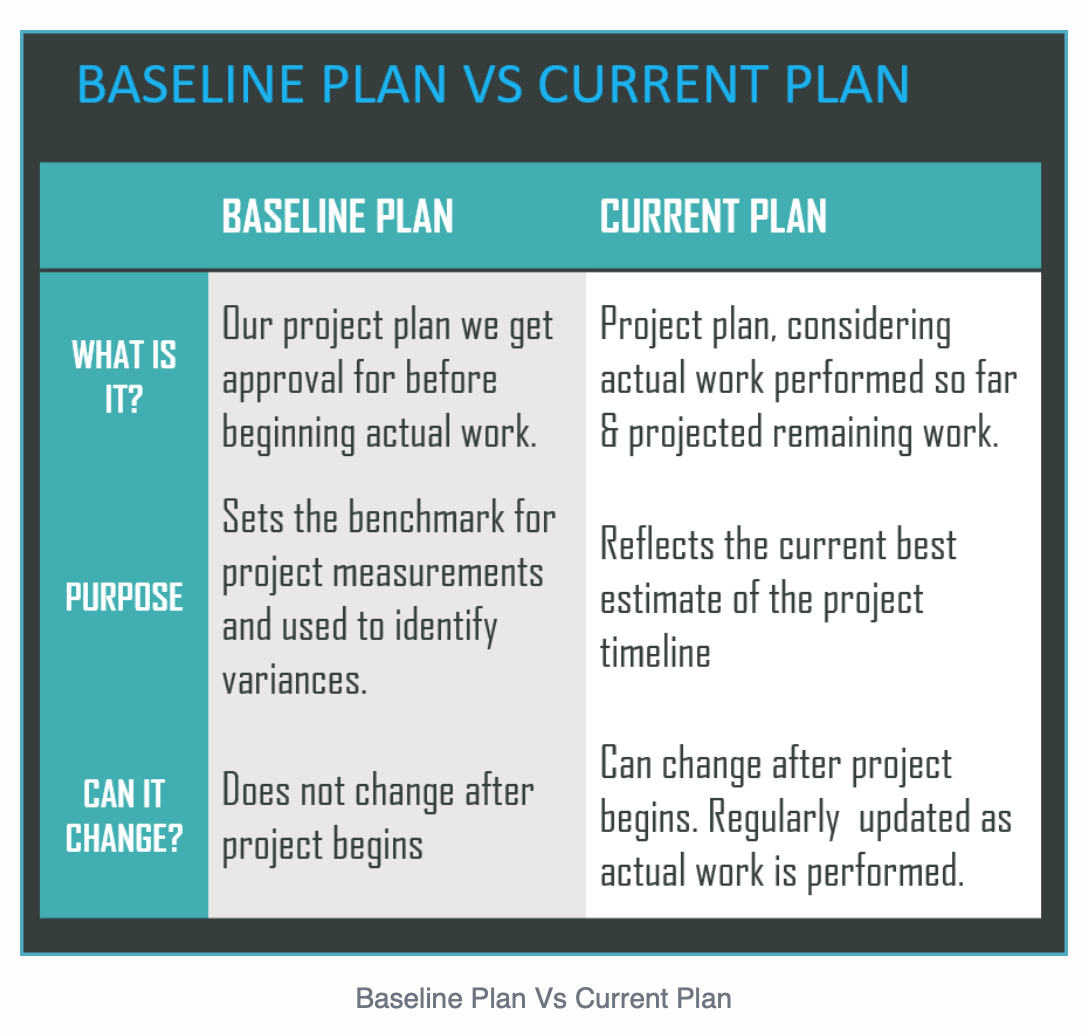
1) The Baseline Plan
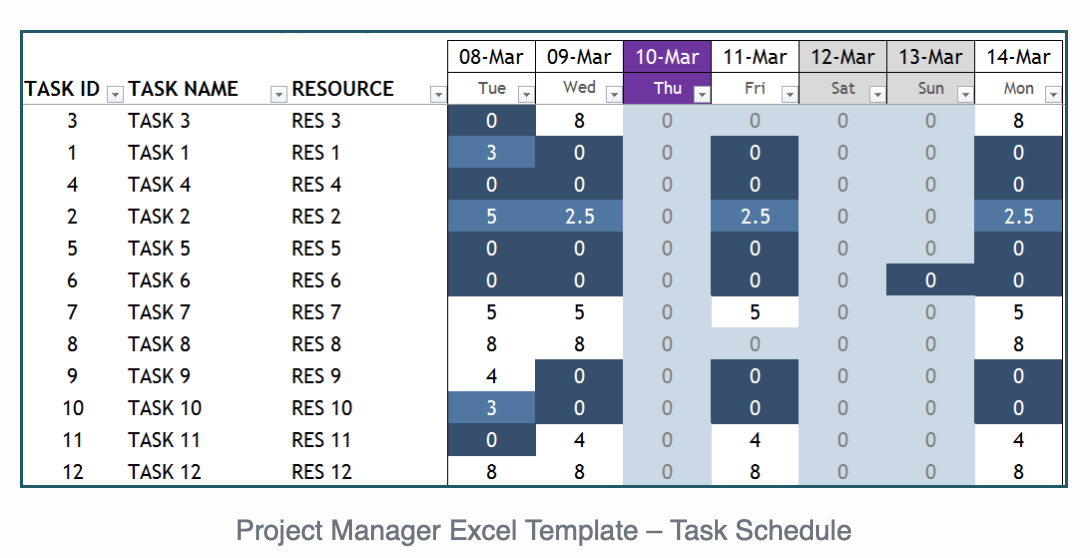
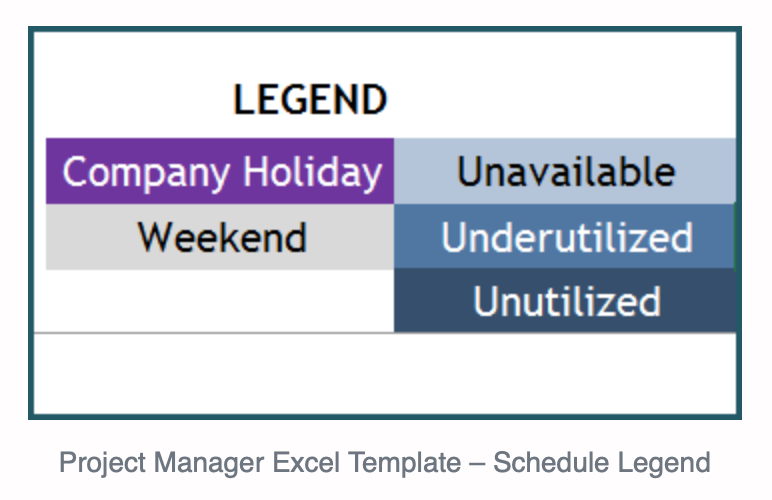
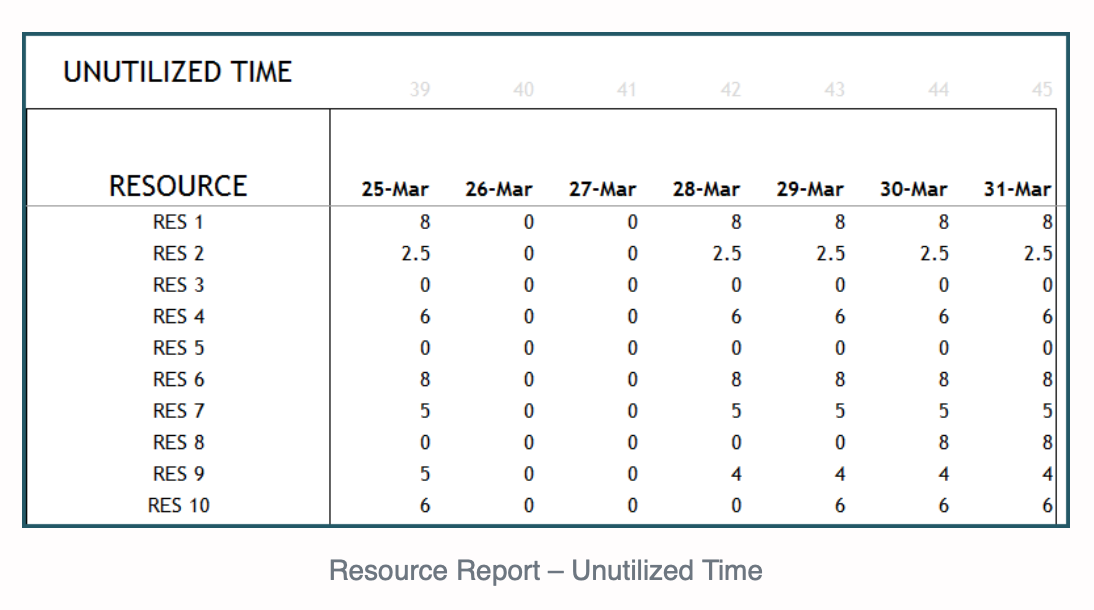
2) The Current Plan: this schedule will continually update with any changes in the actual work performed. A 7-day schedule will also be displayed to visually show if there are any days in which a resource or task is unutilized or underutilized.
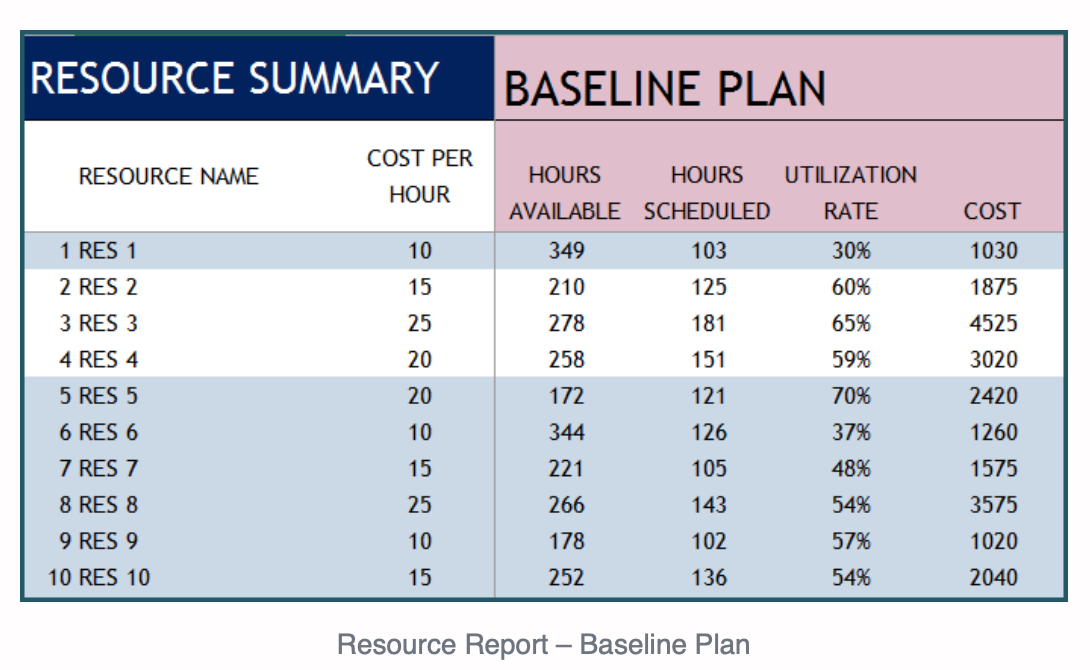
The automatic calculation of the relevant metrics and reports will also save you a lot of time. The templates include a Project Report, Task Report, Resource Report and Gantt Chart.
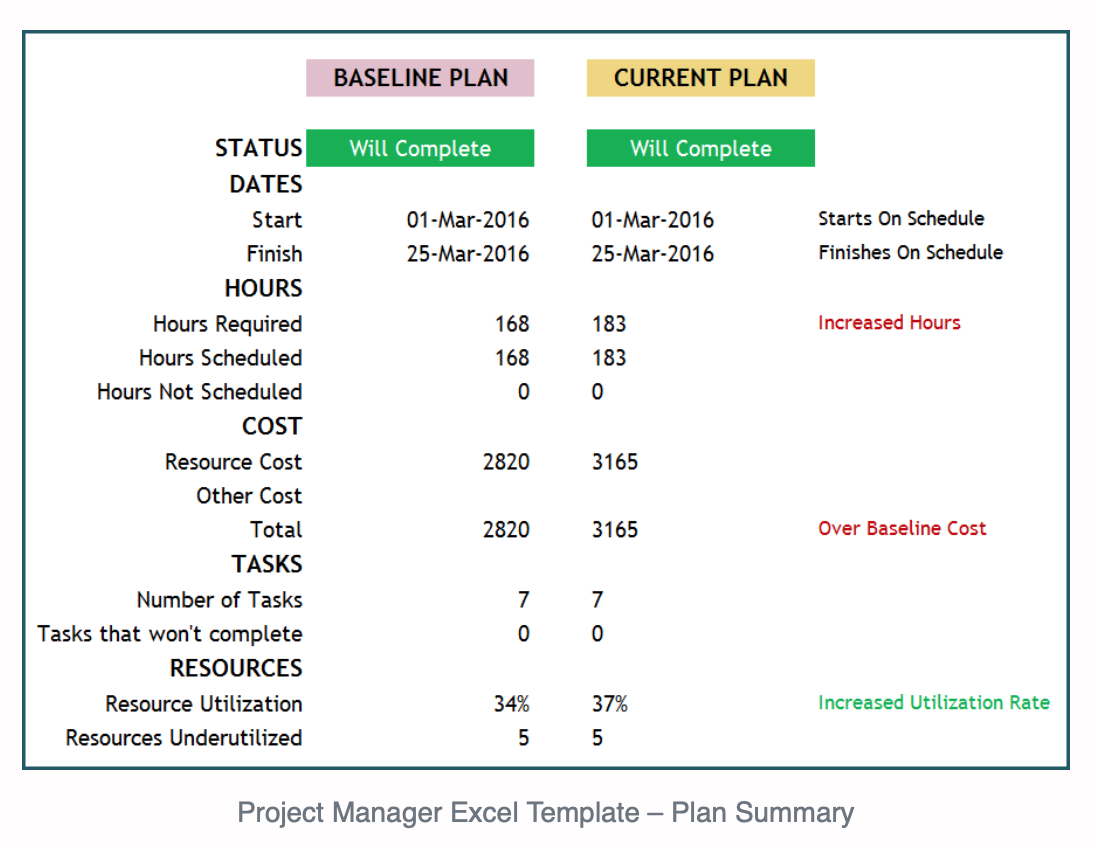
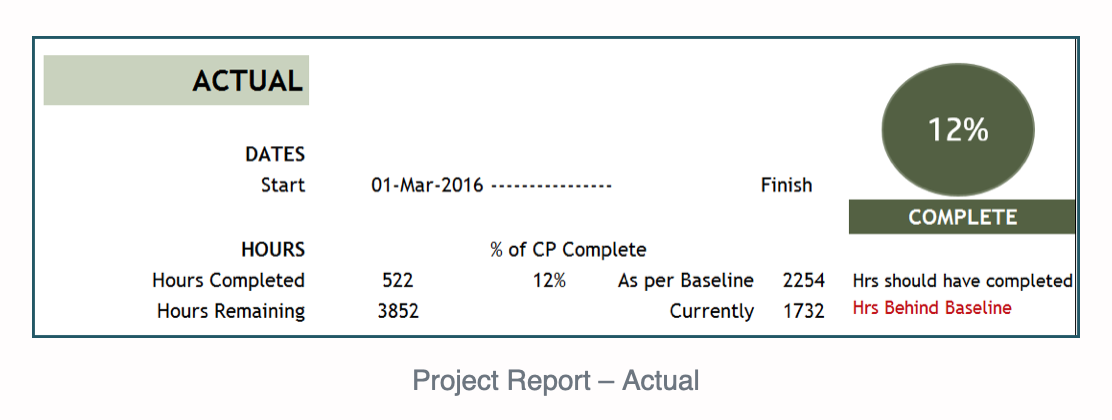
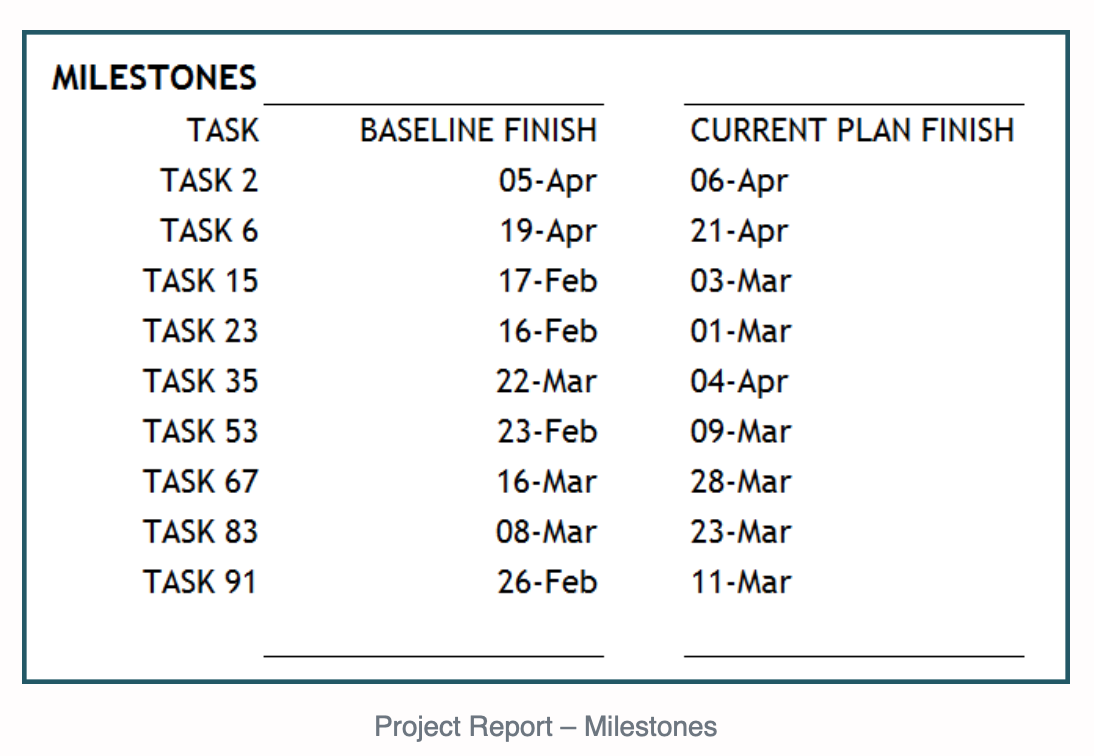
For the Project Report, relevant information is automatically calculated. For both baseline and current plans, the status of the project, start and finish dates, hours scheduled, cost and resource utilization rate are all listed. You can compare the actual progress of the project versus the baseline plan, as well as the project’s progress as of a chosen date.
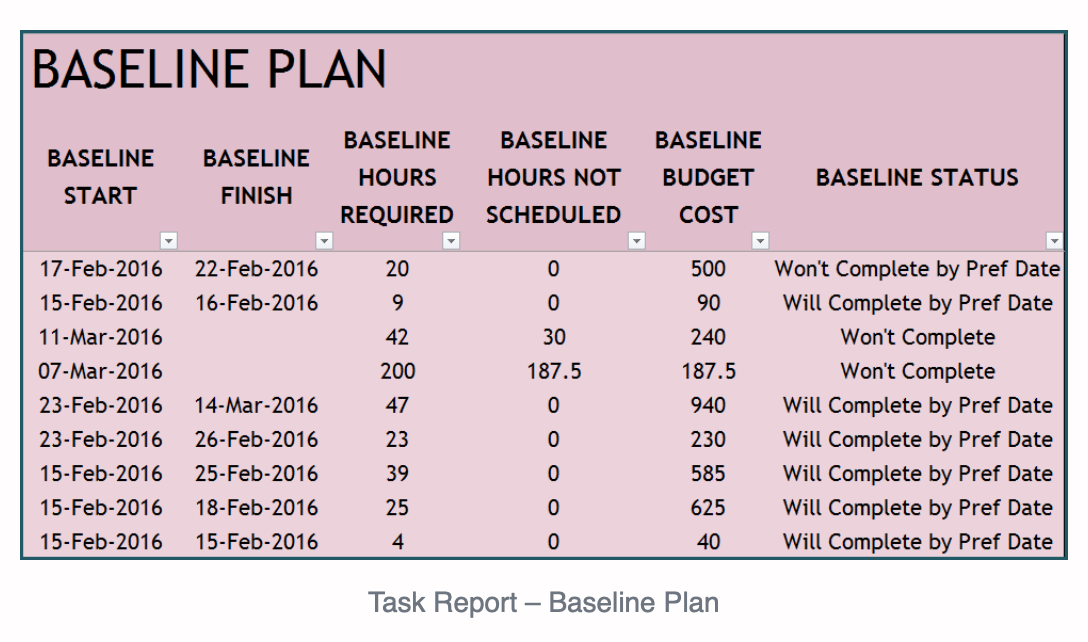
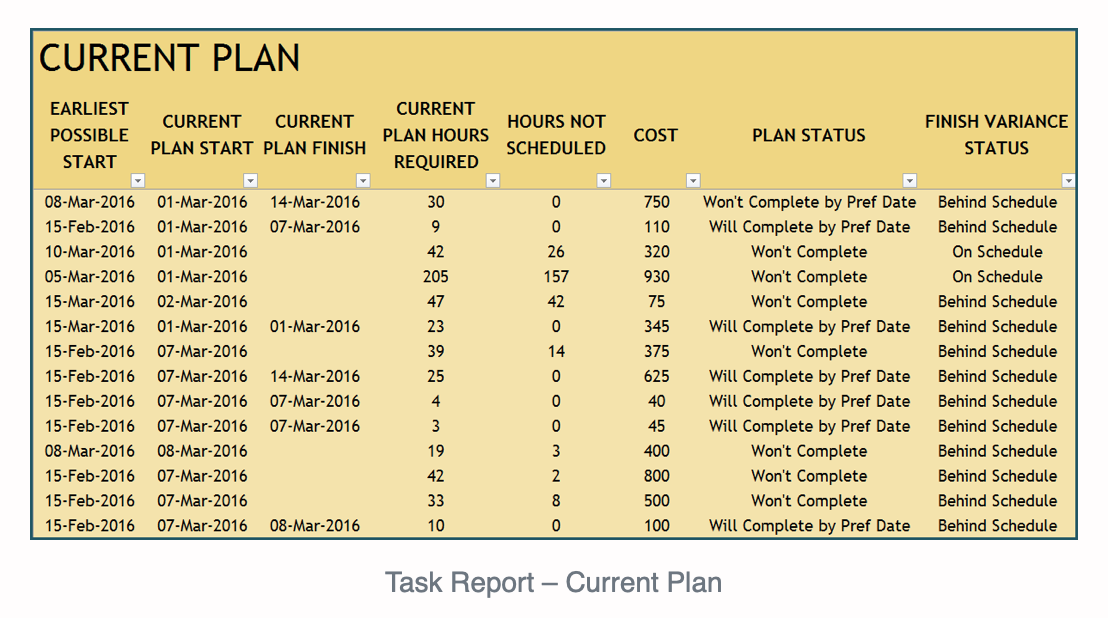
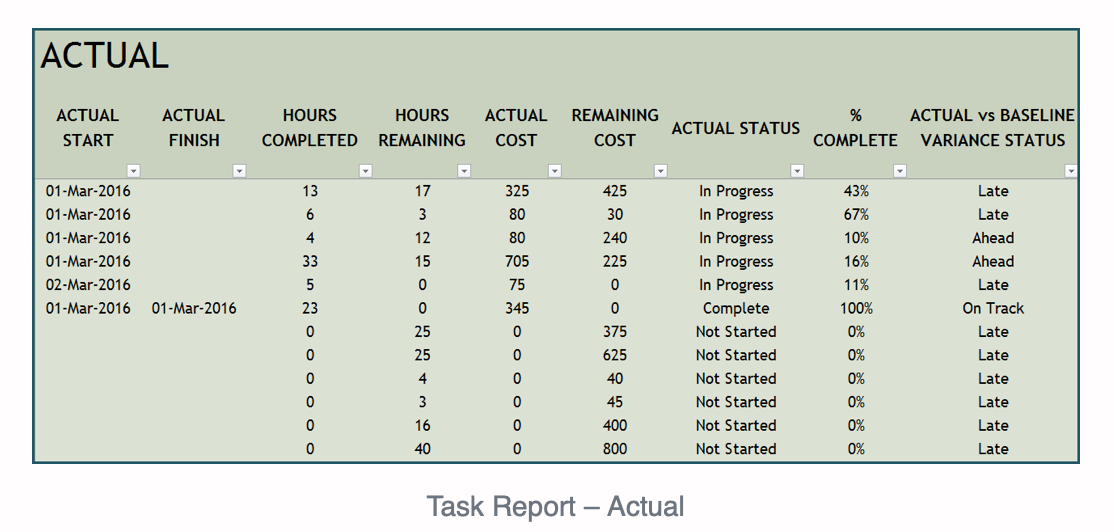
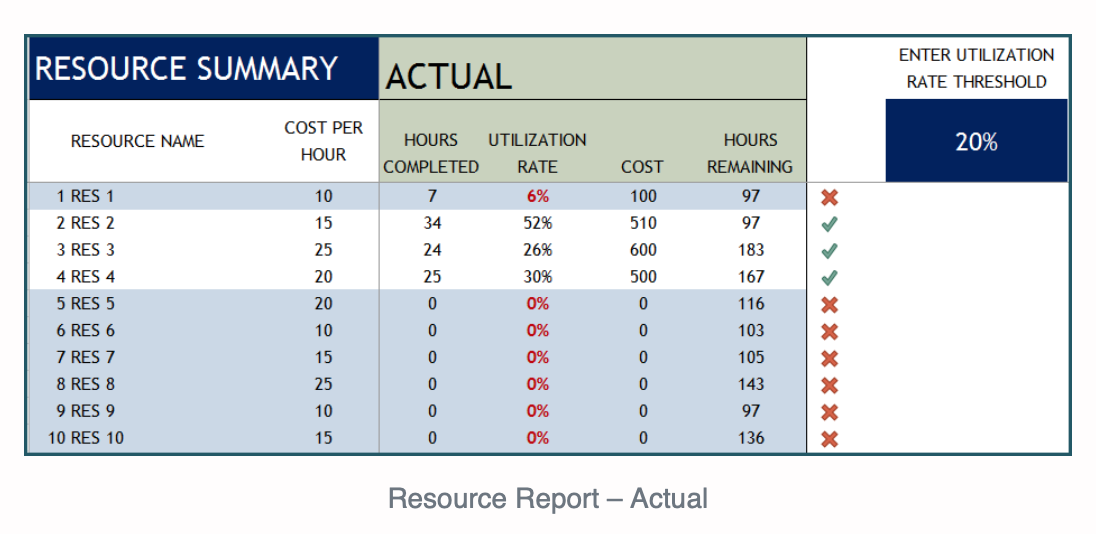
The Task Report provides each task’s details as well as the metrics for Baseline Plan, Current Plan and Actual individually. This will help you to identify any gaps or delays. If you enter the utilization rate threshold and the resources with utilization rates underneath, the threshold will be shown immediately. You can then easily recognize the resources which are underutilized.
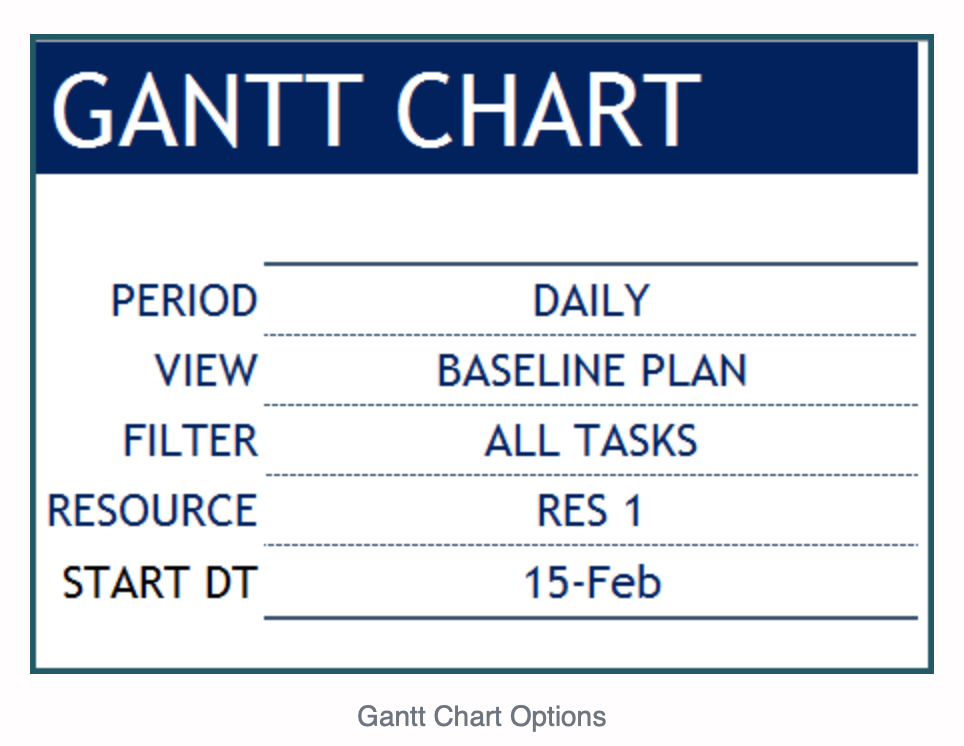
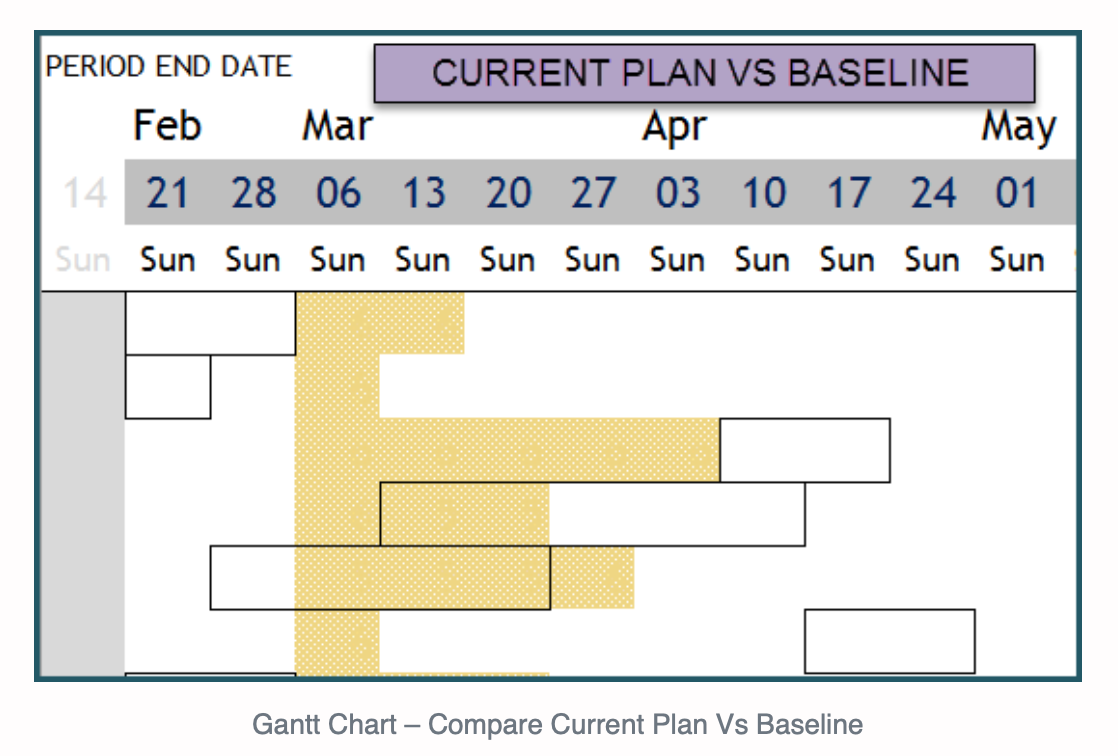
The Gantt chart will help you visualize project timelines and it can be customized in the following ways:
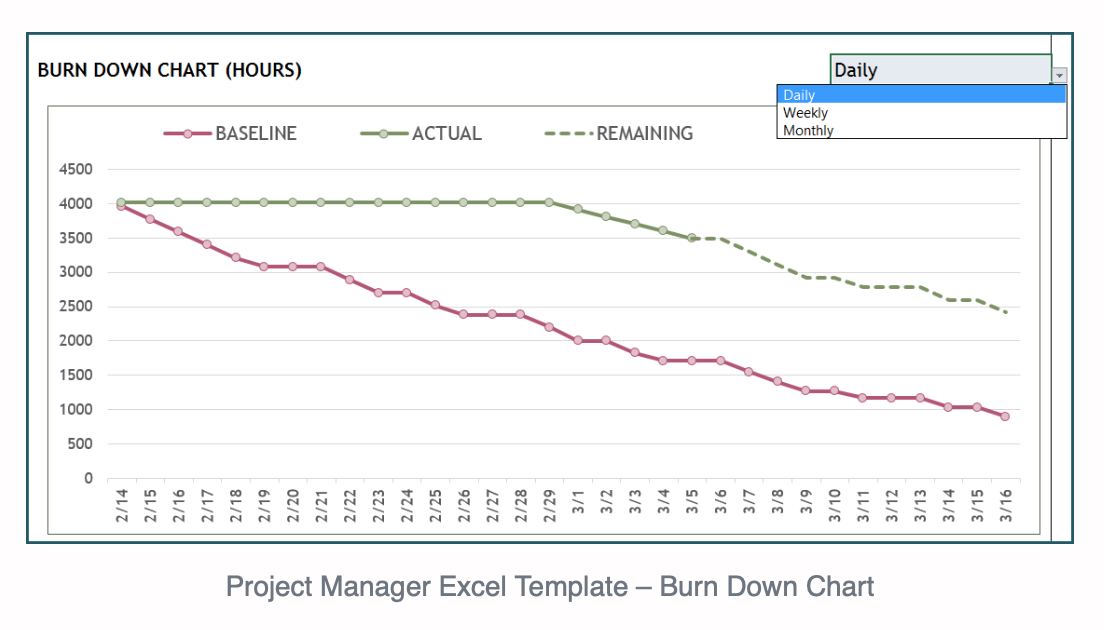
- The period can be set as daily/weekly/monthly
- It can be viewed as the Baseline Plan, Current Plan, Actual, or Current Plan vs Baseline Plan
- It can be filtered by All Tasks/Tasks specific to one resource/Only milestones
- 52 periods can be displayed by the Gantt chart and the start date can be modified for each
The Gantt Chart displays 30 tasks by default, but it can be modified to include more.
Calculations and visual feedback have been implemented throughout the template to help you make impactful actions to improve the project.
- It is simple to identify tasks that will not be finished on time and those which are behind schedule.
- On the Task Schedule, you can see the unavailability of resource assigned to a task.
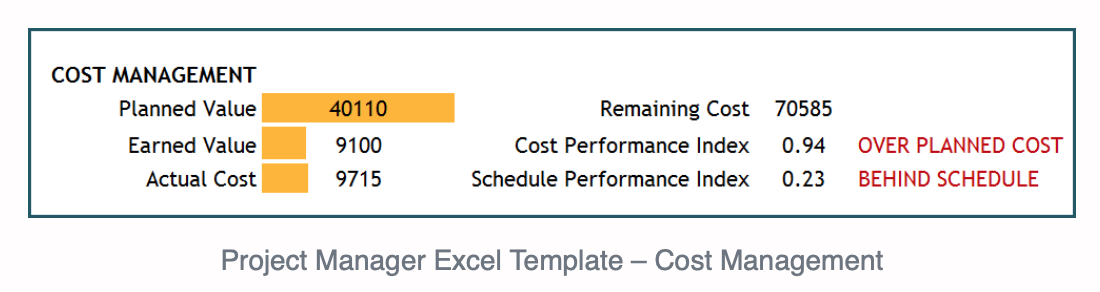
- Cost Performance Index calculations show the current costs versus planned costs.
- The Project Report displays the project’s status.
- The Resource Report identifies underused resources.
The reports are printable and PDF file compatible.
The Project Manager Template is an all-inclusive method to plan and manage projects. It uses the scope of work as an input to generate a schedule and includes cost and resource management into a single solution.
Once the project has commenced, and the actual work performed is being inputted, the current plan will be automatically updated. It is then possible to see whether the plan has diverted from the baseline. You can compare actual progress with baseline targets to assess the project’s progress against the initial objectives.
A great benefit of this template is that it will automatically generate the schedule. Simply input the resources (standard availability, vacation/overtime, and company holidays) and tasks (hours required, resource assignment, start date constraint, predecessors). The scheduling engine will then generate a schedule stating the number of hours worked on a specific task, by which employees, and on which day(s). The automation will save PM’s a significant amount of time.
The template creates two schedules:
1) The Baseline Plan
2) The Current Plan: this schedule will continually update with any changes in the actual work performed. A 7-day schedule will also be displayed to visually show if there are any days in which a resource or task is unutilized or underutilized.
The automatic calculation of the relevant metrics and reports will also save you a lot of time. The templates include a Project Report, Task Report, Resource Report and Gantt Chart.
For the Project Report, relevant information is automatically calculated. For both baseline and current plans, the status of the project, start and finish dates, hours scheduled, cost and resource utilization rate are all listed. You can compare the actual progress of the project versus the baseline plan, as well as the project’s progress as of a chosen date.
The Task Report provides each task’s details as well as the metrics for Baseline Plan, Current Plan and Actual individually. This will help you to identify any gaps or delays. If you enter the utilization rate threshold and the resources with utilization rates underneath, the threshold will be shown immediately. You can then easily recognize the resources which are underutilized.
The Gantt chart will help you visualize project timelines and it can be customized in the following ways:
- The period can be set as daily/weekly/monthly
- It can be viewed as the Baseline Plan, Current Plan, Actual, or Current Plan vs Baseline Plan
- It can be filtered by All Tasks/Tasks specific to one resource/Only milestones
- 52 periods can be displayed by the Gantt chart and the start date can be modified for each
The Gantt Chart displays 30 tasks by default, but it can be modified to include more.
Calculations and visual feedback have been implemented throughout the template to help you make impactful actions to improve the project.
- It is simple to identify tasks that will not be finished on time and those which are behind schedule.
- On the Task Schedule, you can see the unavailability of resource assigned to a task.
- Cost Performance Index calculations show the current costs versus planned costs.
- The Project Report displays the project’s status.
- The Resource Report identifies underused resources.
The reports are printable and PDF file compatible.
This Best Practice includes
1 Excel Template
