
Originally published: 26/04/2019 07:11
Last version published: 16/12/2019 07:00
Publication number: ELQ-52915-2
View all versions & Certificate
Last version published: 16/12/2019 07:00
Publication number: ELQ-52915-2
View all versions & Certificate

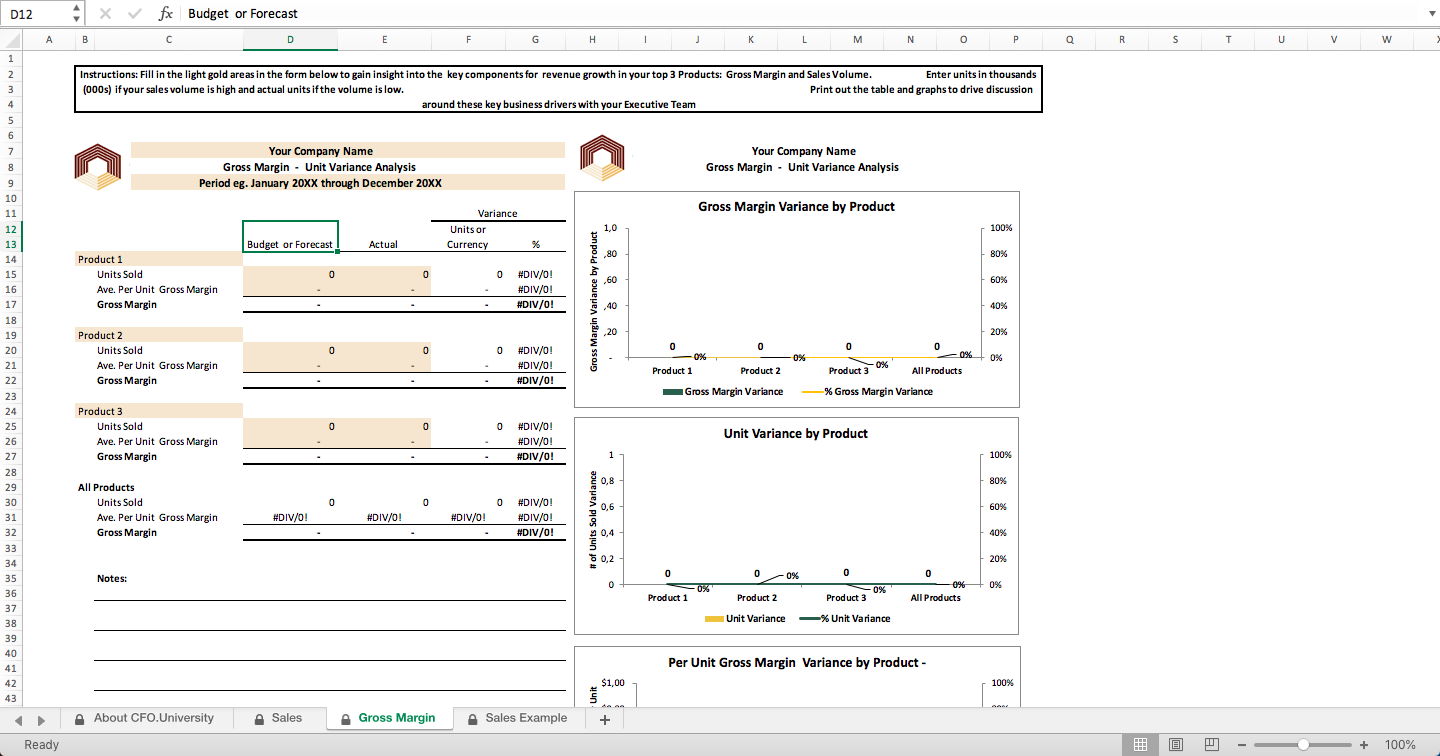
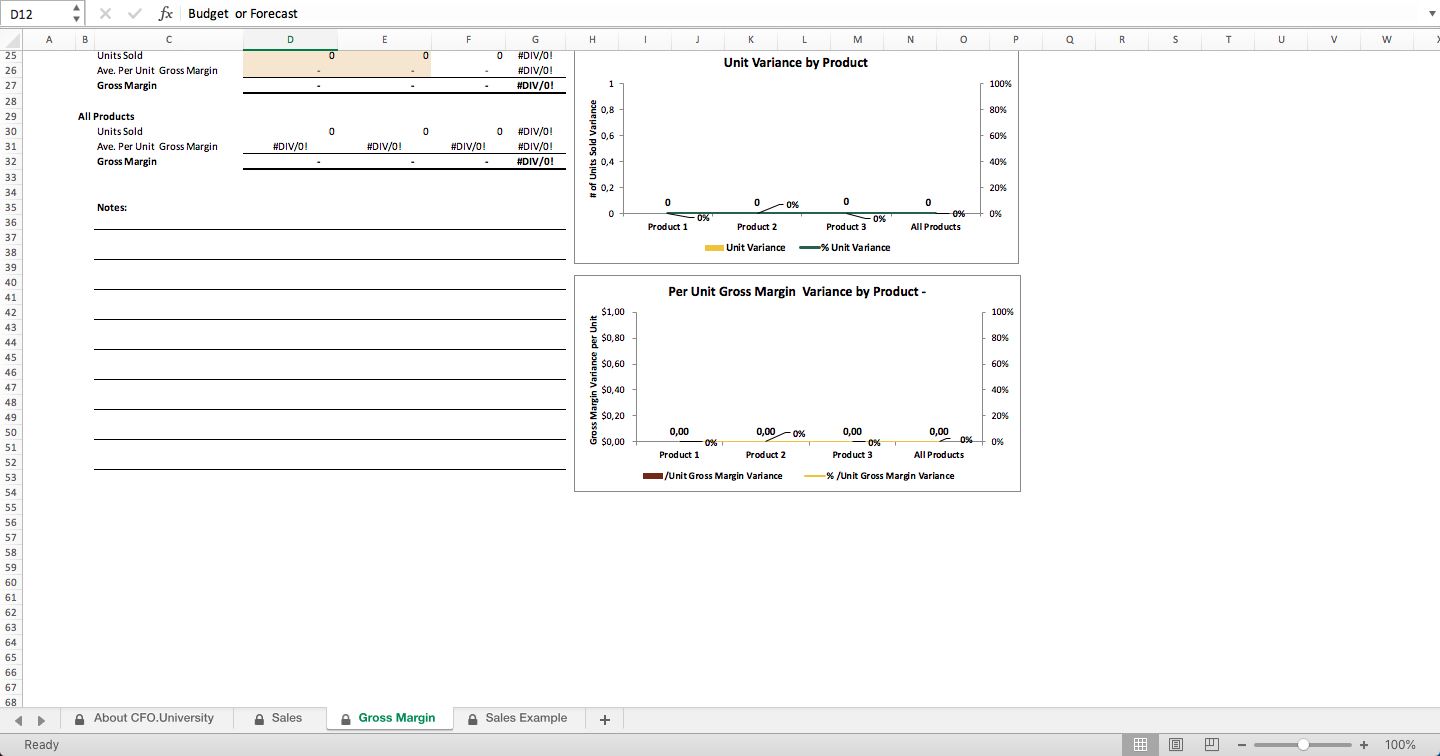
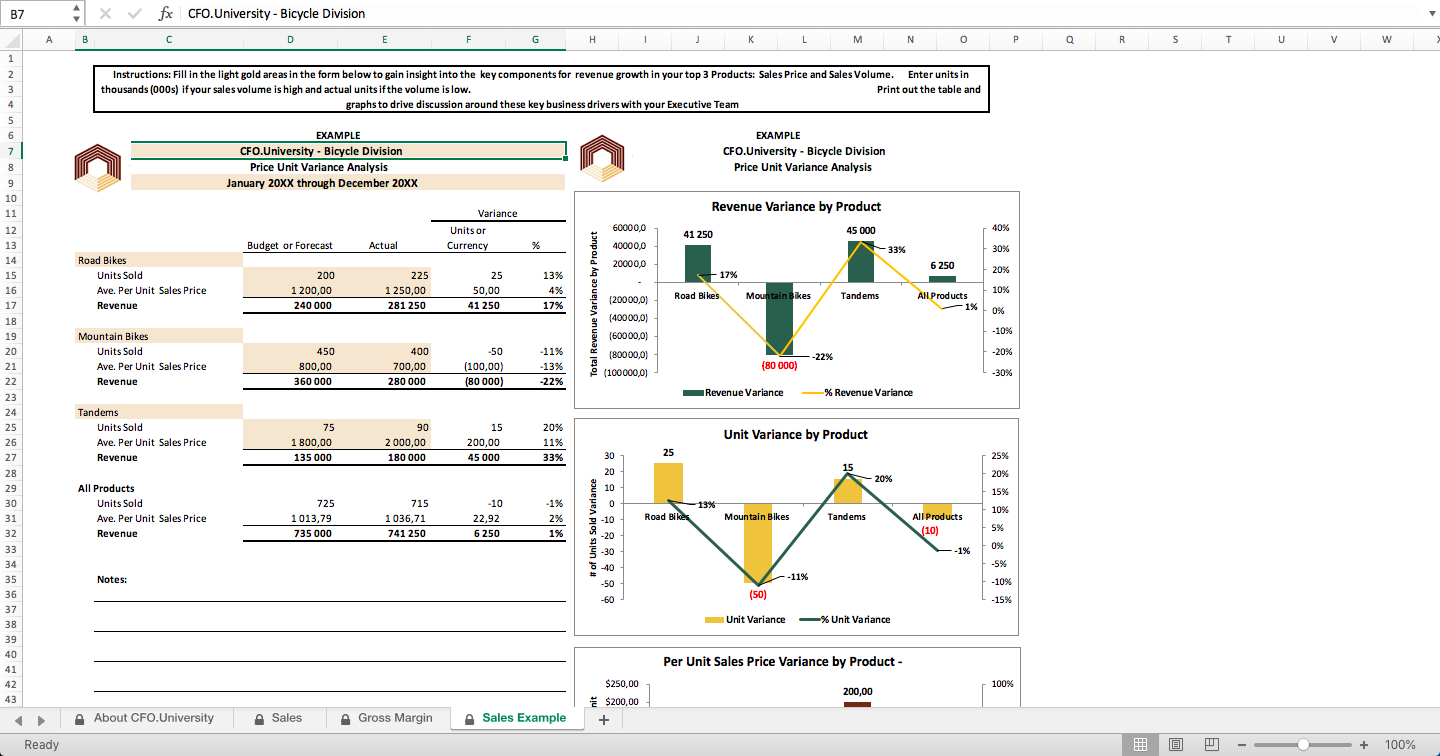
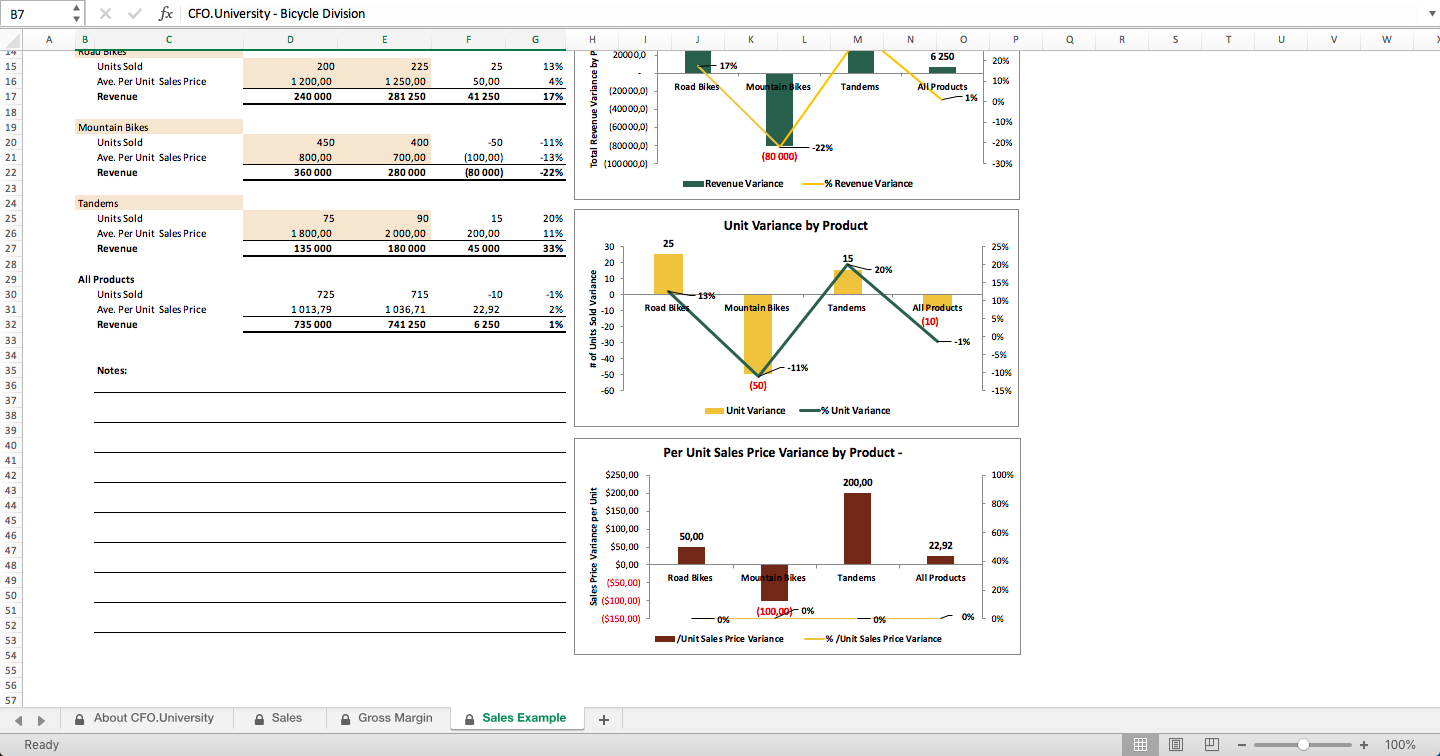
Simple Price, Gross Margin & Unit Variance Analysis Excel Model
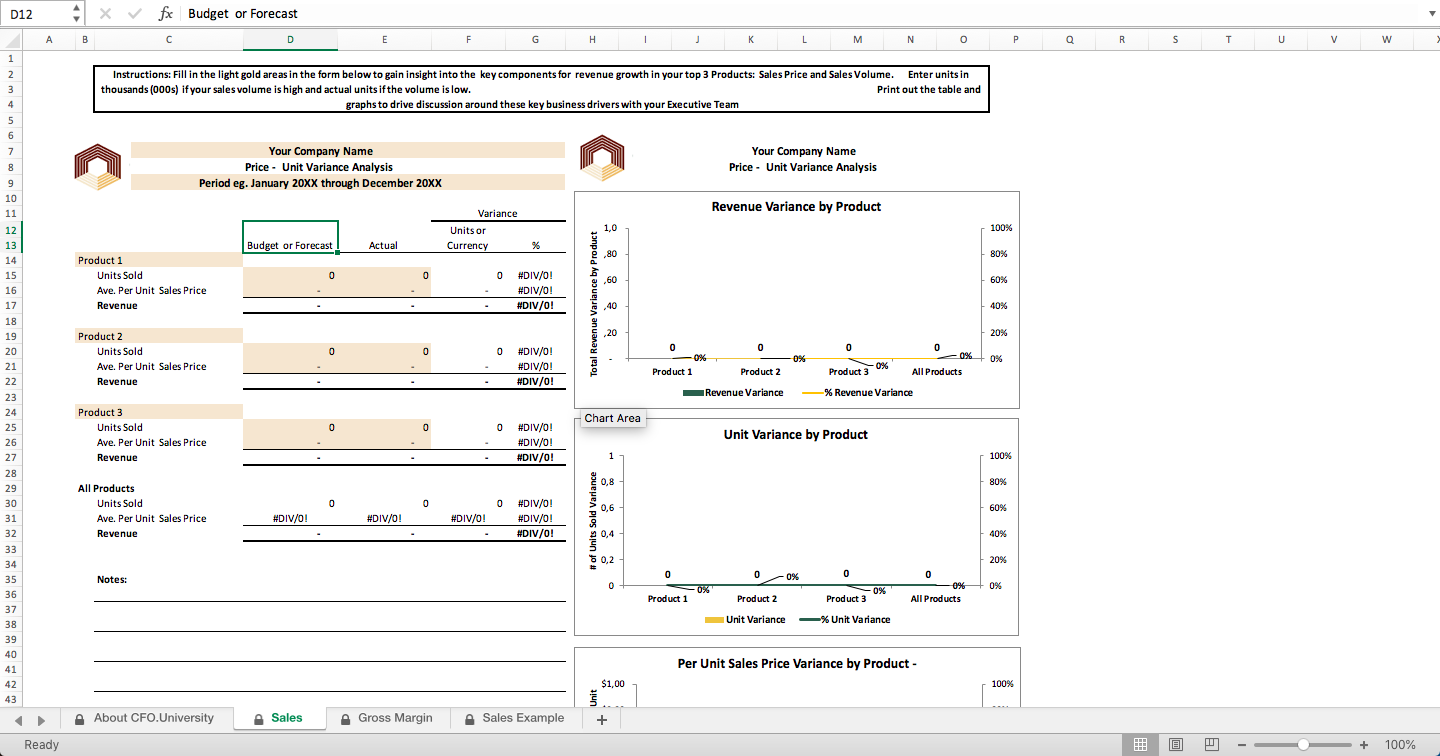
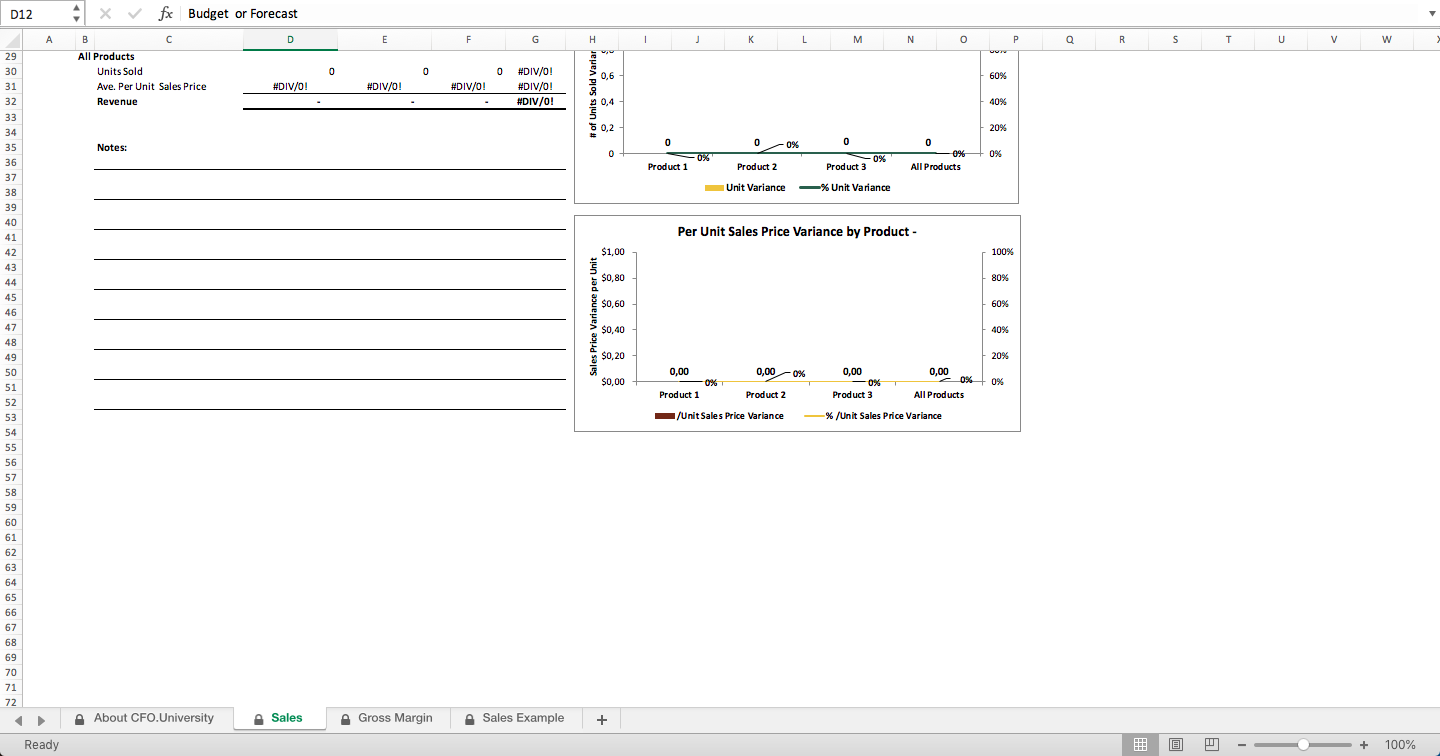
This is a Simple Price, Gross Margin and Unit Variance Analysis summarizes Price, Gross Margin and Units Sold Model.
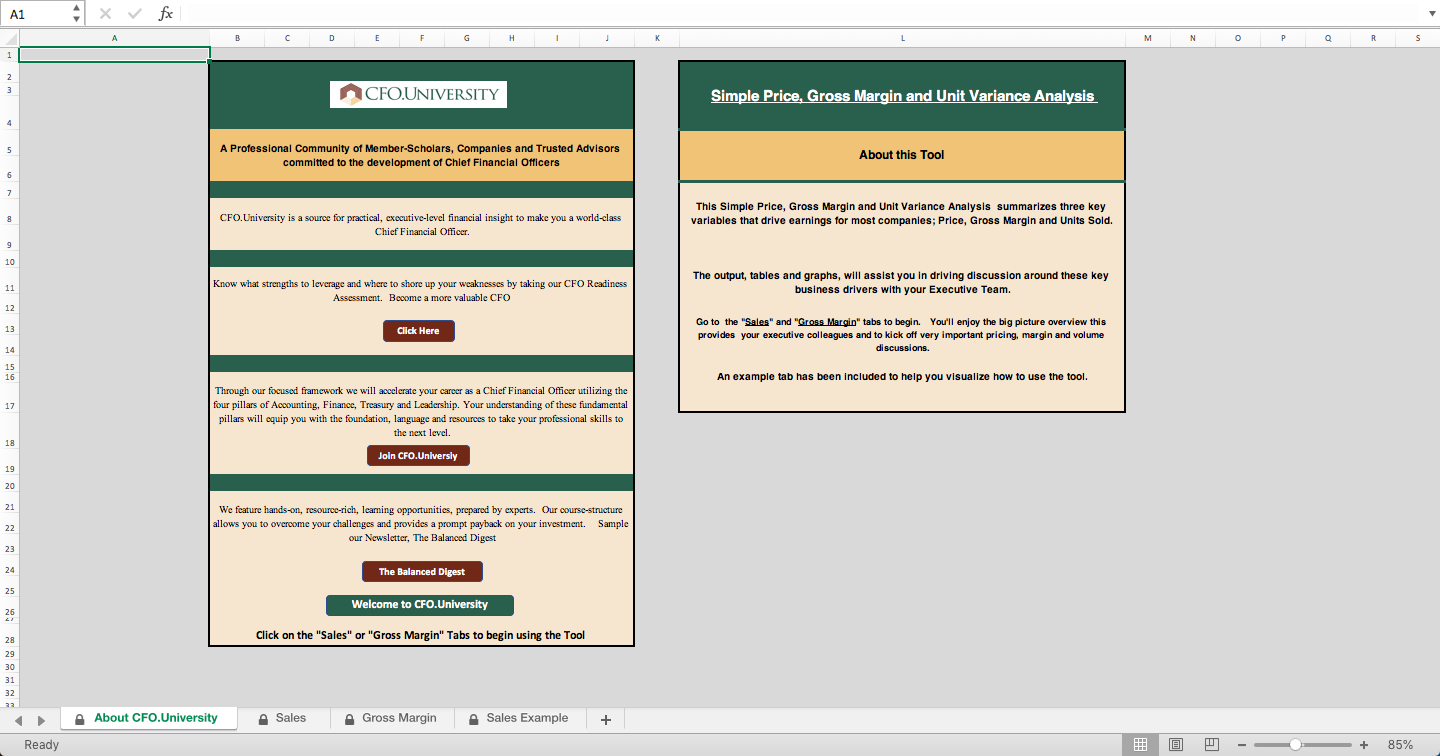
A Community of Member-Scholars, Companies and Trusted Advisors committed to the development of Chief Financial OfficersFollow 60
