Originally published: 03/12/2021 13:40
Last version published: 02/03/2022 09:39
Publication number: ELQ-69196-2
View all versions & Certificate
Last version published: 02/03/2022 09:39
Publication number: ELQ-69196-2
View all versions & Certificate

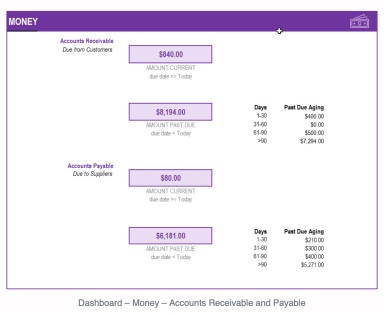
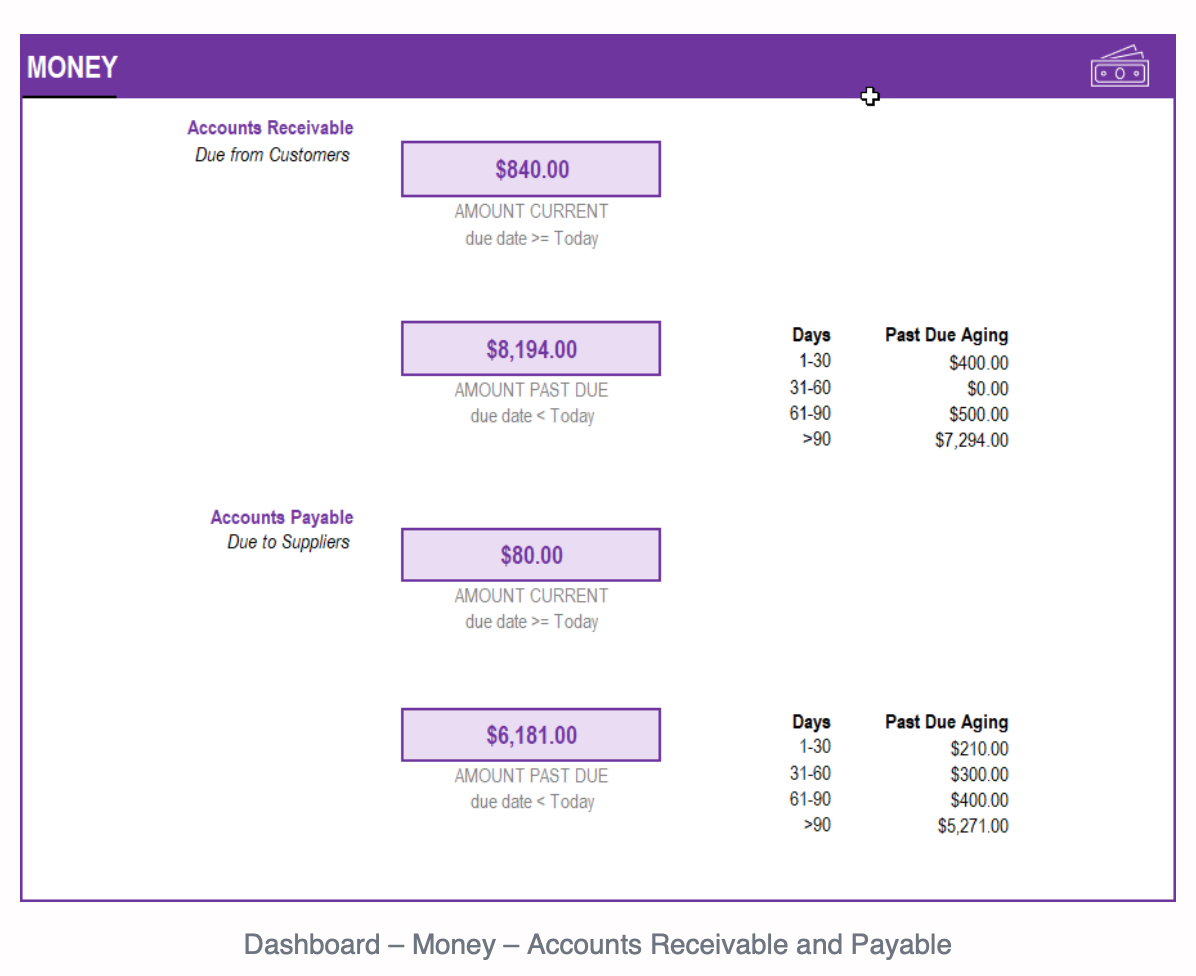
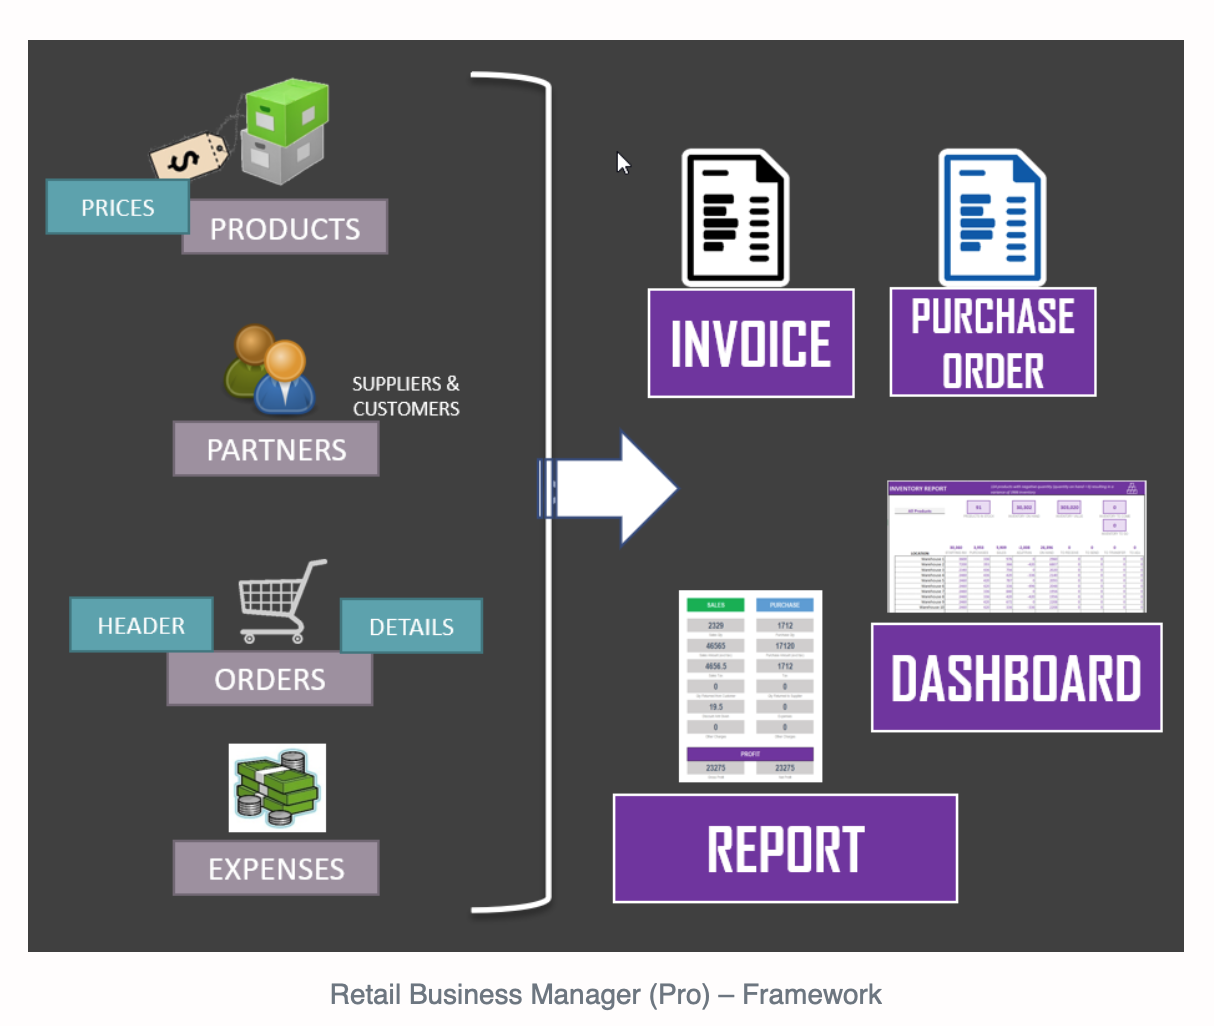
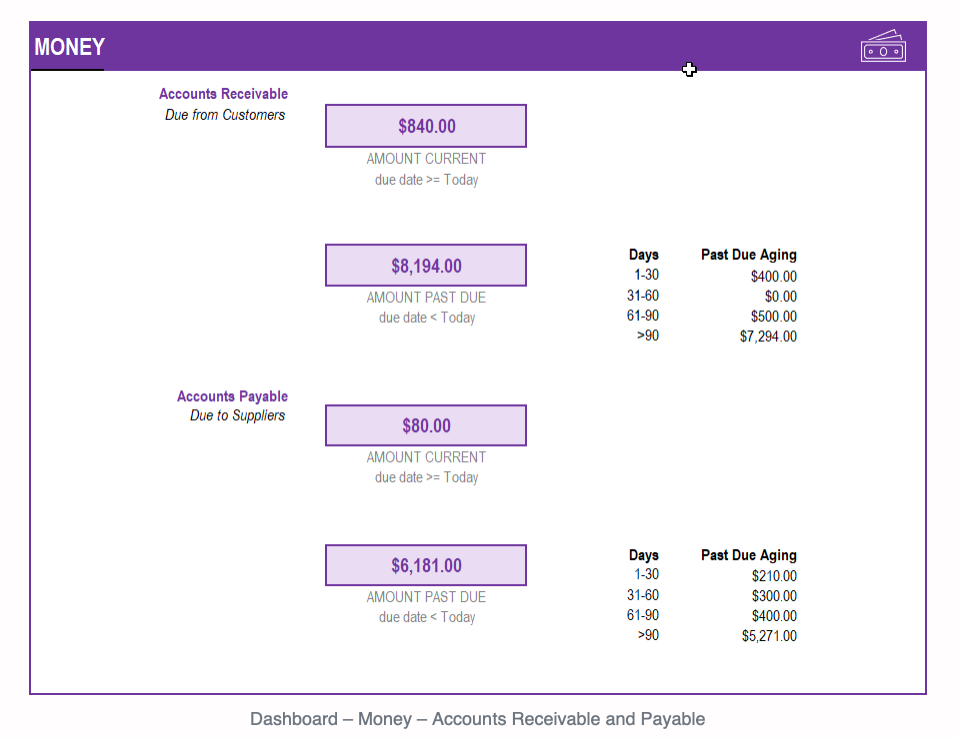
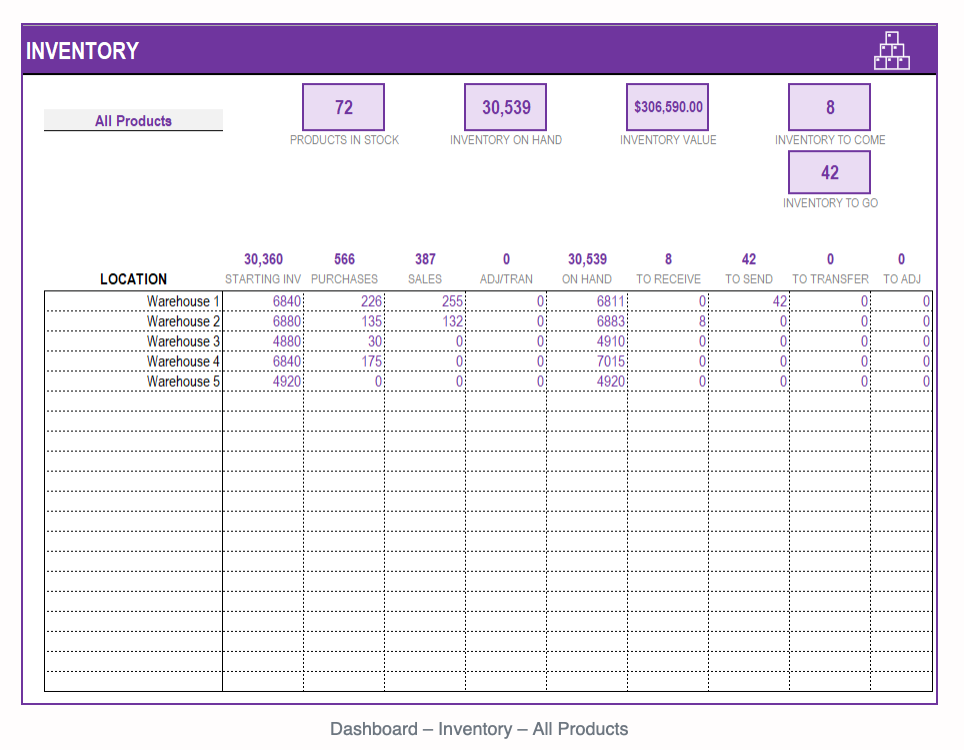
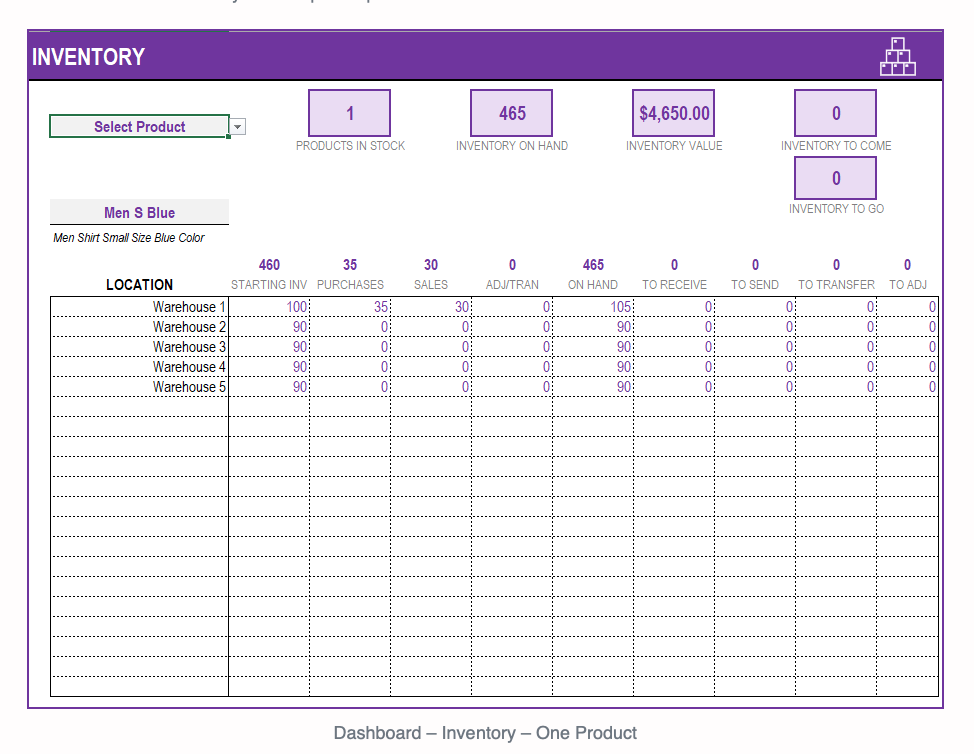
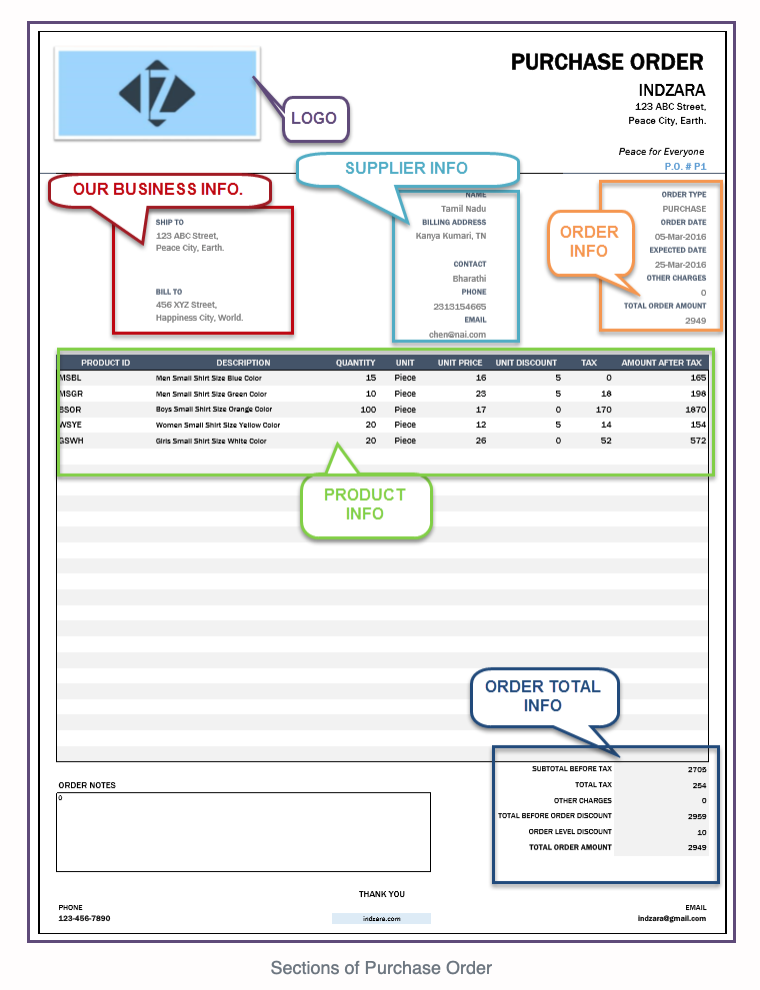
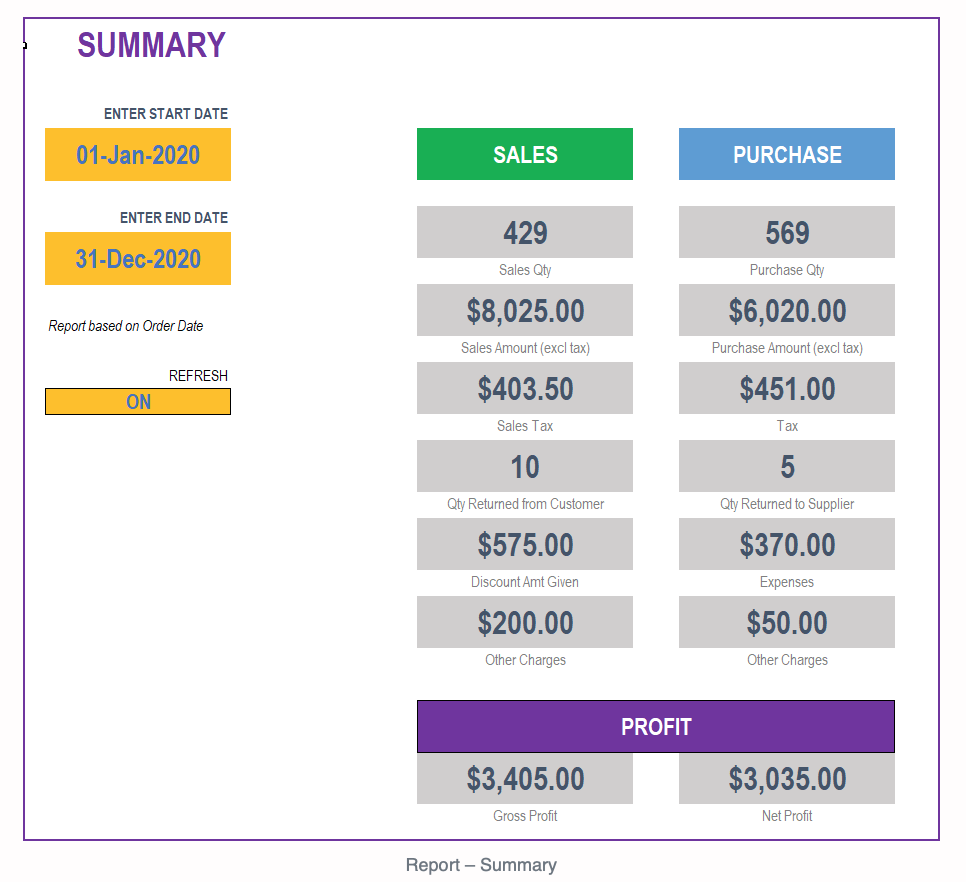
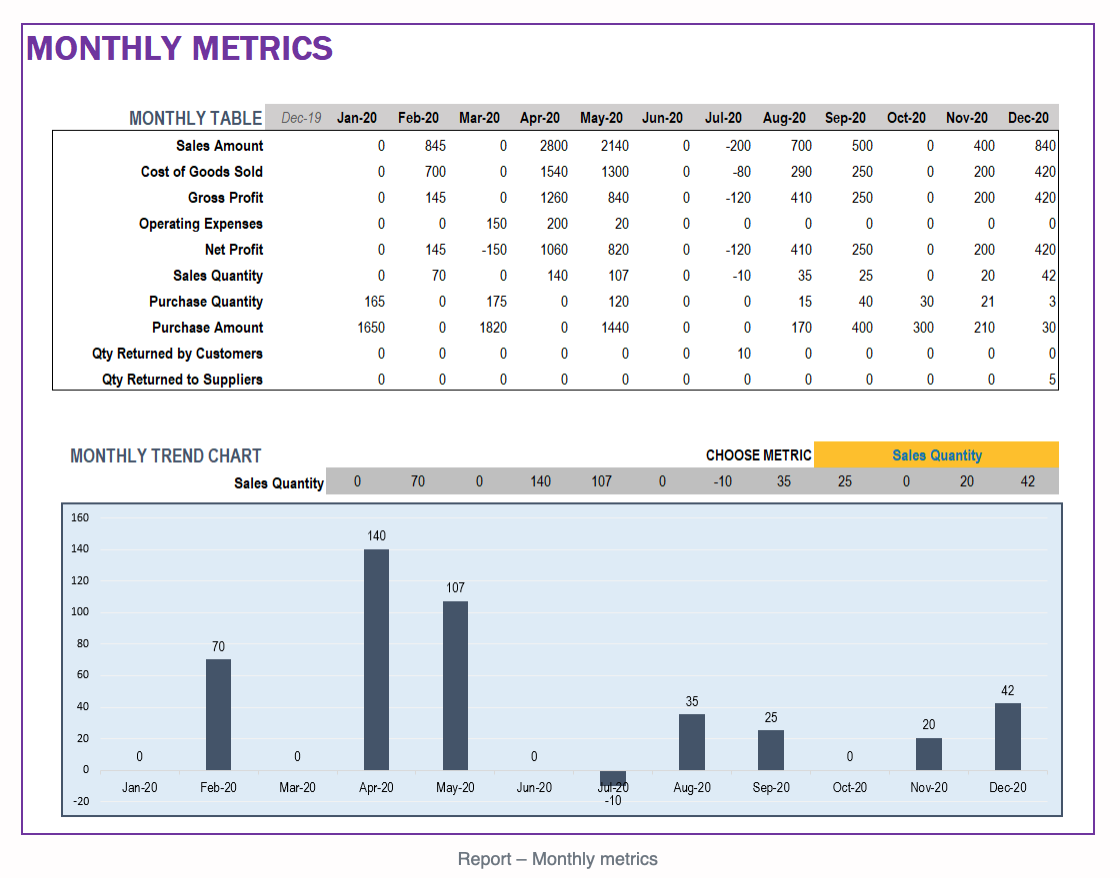
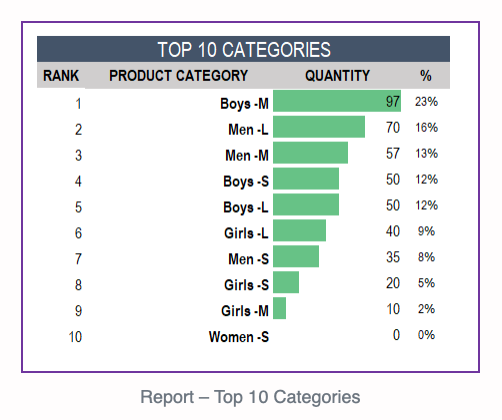
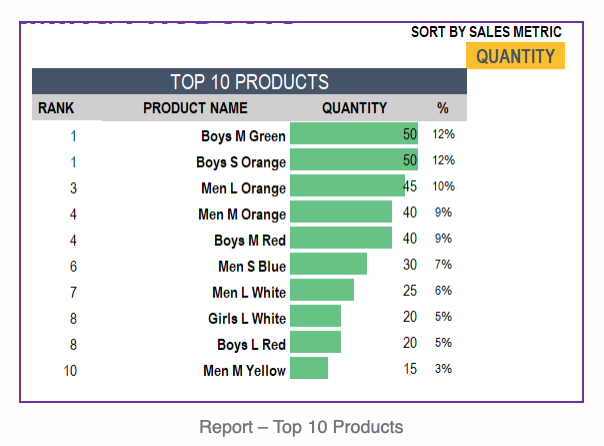
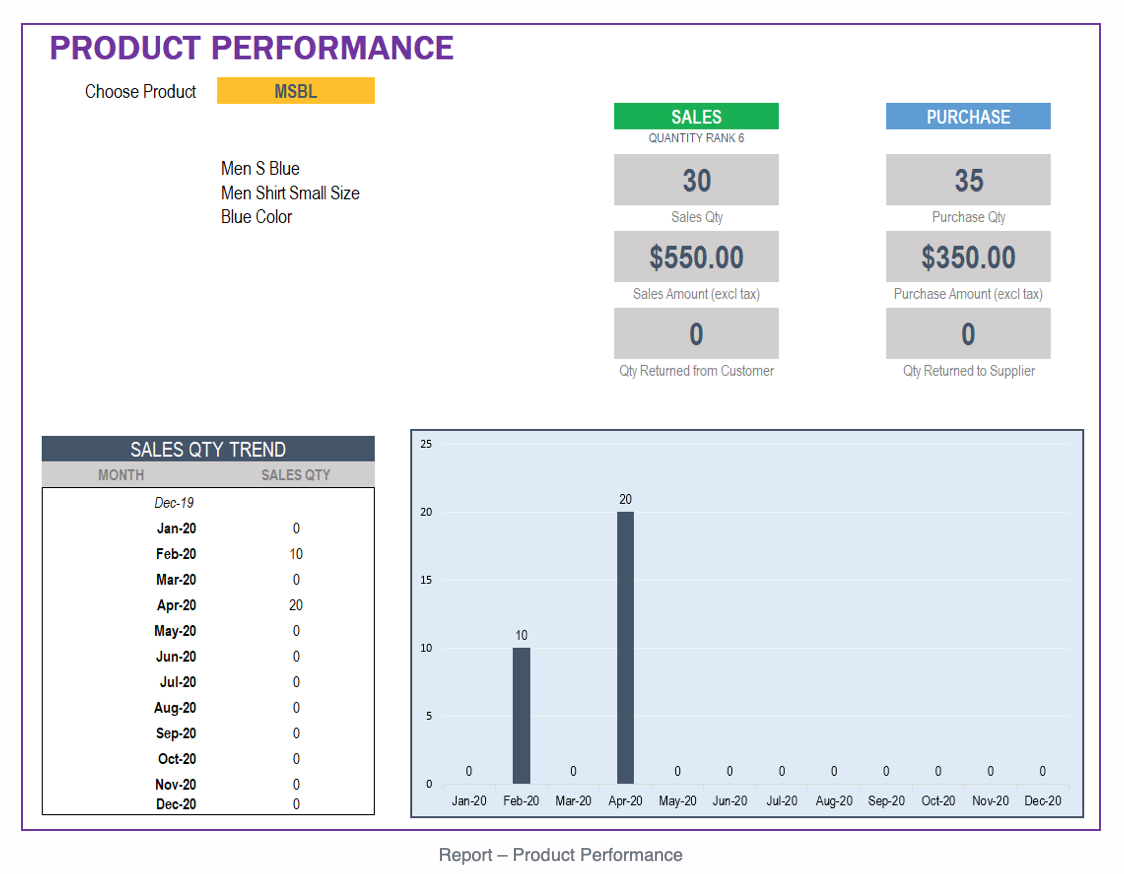
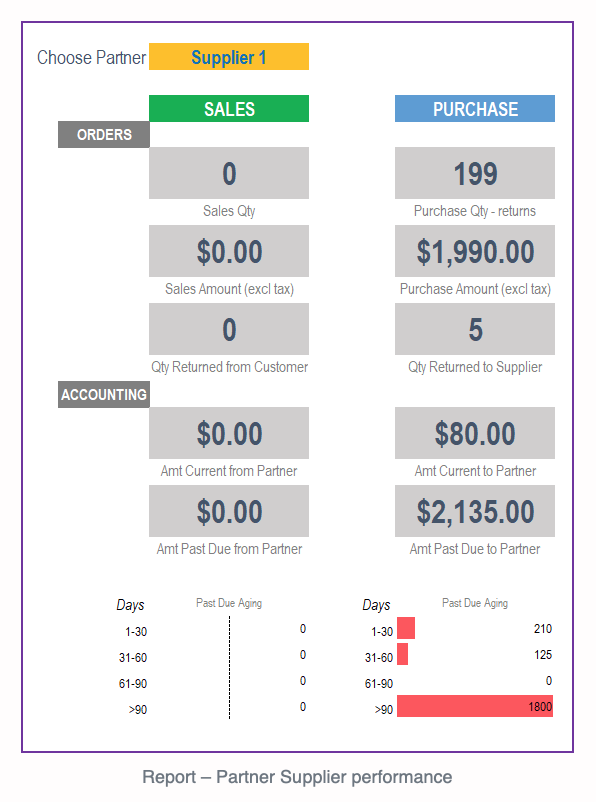
Retail Business Manager Pro (Multiple Locations) – Excel Template
The Retail Business Manager template will help you to efficiently manage your inventory, invoicing and sales in multiple locations.
