Originally published: 17/04/2018 10:17
Last version published: 26/01/2021 08:43
Publication number: ELQ-65064-4
View all versions & Certificate
Last version published: 26/01/2021 08:43
Publication number: ELQ-65064-4
View all versions & Certificate

Van Westendorp Price Sensitivity Meter Excel Template
A tool designed to determine consumer price preferences.
pricingpricing methodsdemand estimationprice sensitivitypricing techniquesrevenue estimationprice sensitivity meter
Description
People are asked to define prices for a product at four levels: too cheap, cheap, expensive, and too expensive. The questions usually asked are:
- At what price would you consider the product to be so expensive that you would not buy it? (Too expensive)
- At what price would you consider the product to be so inexpensive that you would doubt its quality? (Too cheap)
- At what price would you consider the product to start to be expensive enough that you could start to reconsider buying it? (Expensive)
- At what price would you consider the product to be good value for money? (Cheap)
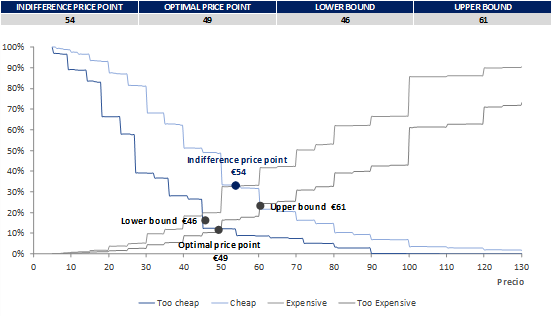
The results are organized by price level, with the accumulated demand for each question. The demand is usually accumulated inversely for the categories “cheap” and “too cheap” to define crossing points with the other two variables.
From the four intersections, we have the boundaries between which the price should be settled (lower bound and upper bound). Although the other two price points are sometimes used, I prefer to use this model to define the lead prices and upper prices for a product, while the middle prices should not be static but should change based on several factors (period of purchase, place, conditions, etc.).
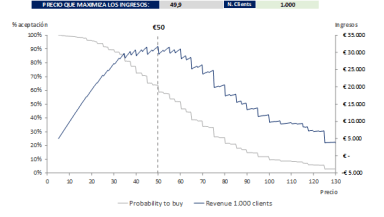
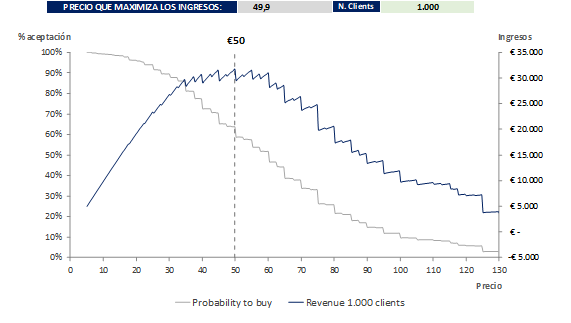
With this model we can define price boundaries, but we cannot estimate the purchase likelihood or demand. For the estimation of the demand (and revenues), we ask an additional question regarding the likelihood of buying the product at a specific price with a five-point Likert scale (5 = strongly agree, 1 = strongly disagree). The price to be tested can be the average of the “cheap” price and the “expensive” price for each respondent. A more comprehensive approach would be to ask the question for both the “cheap” and the “expensive” price. Then the results must be transformed into purchase probabilities, for example strongly agree = 70%, agree = 50%, and so on. With these results we can build a cumulative demand curve and a revenue curve . The optimal price is the one at which the revenues are maximized (be aware that this approach aims to maximize revenues and does not take into account any variable costs).
How to use the template:
1) First you need to carry on a survey asking the four questions (cheap, too cheap, expensive, too expensive). With the answers to these questions you can modify the data in the "green" cells in the first sheet. If you have less people surveyed than the ones on the template, delete the rest of data, if you have more, you can add more rows, the calculations will work.
2) in the same sheet you have the results, namely the 4 price points (indifference, optimal, lower, and upper bounds), they ara automatically calculated above and in the graph.
3) if you also want to find the price that maximizes revenues, you first have to add another question in the survey about the probability of purchasing your product at a specific price. Here I suggest tu use the average of the cheap and expensive price (using the answers of each person). In the second sheet you modify the data in the "green" cells, which is the same as the previous one, but it will also include the probability to buy. If you proposed a different price, you need to modify also the column G. If you have less people surveyed than the ones on the template, delete the rest of data, if you have more, you can add more rows, the calculations will work.
4) In the same sheet you have the results, namely the price that maximizes revenues. Notice that above the graph you can modify the number of prospective clients. This is useful if you are also interested in estimating the revenue amount at the optimal price and/or at other price points.
It is available to download instantly and is ready to use. As it is a template, it is fully editable allowing the user to modify for their specific needs.
If you have any problems or questions regarding this tool, don't hesitate to start a discussion below. Alternatively, you can reach out directly through private message via my Eloquens author account.
If you have enjoyed utilising this tool, please show your appreciation by leaving a 5* rating and review!
People are asked to define prices for a product at four levels: too cheap, cheap, expensive, and too expensive. The questions usually asked are:
- At what price would you consider the product to be so expensive that you would not buy it? (Too expensive)
- At what price would you consider the product to be so inexpensive that you would doubt its quality? (Too cheap)
- At what price would you consider the product to start to be expensive enough that you could start to reconsider buying it? (Expensive)
- At what price would you consider the product to be good value for money? (Cheap)
The results are organized by price level, with the accumulated demand for each question. The demand is usually accumulated inversely for the categories “cheap” and “too cheap” to define crossing points with the other two variables.
From the four intersections, we have the boundaries between which the price should be settled (lower bound and upper bound). Although the other two price points are sometimes used, I prefer to use this model to define the lead prices and upper prices for a product, while the middle prices should not be static but should change based on several factors (period of purchase, place, conditions, etc.).
With this model we can define price boundaries, but we cannot estimate the purchase likelihood or demand. For the estimation of the demand (and revenues), we ask an additional question regarding the likelihood of buying the product at a specific price with a five-point Likert scale (5 = strongly agree, 1 = strongly disagree). The price to be tested can be the average of the “cheap” price and the “expensive” price for each respondent. A more comprehensive approach would be to ask the question for both the “cheap” and the “expensive” price. Then the results must be transformed into purchase probabilities, for example strongly agree = 70%, agree = 50%, and so on. With these results we can build a cumulative demand curve and a revenue curve . The optimal price is the one at which the revenues are maximized (be aware that this approach aims to maximize revenues and does not take into account any variable costs).
How to use the template:
1) First you need to carry on a survey asking the four questions (cheap, too cheap, expensive, too expensive). With the answers to these questions you can modify the data in the "green" cells in the first sheet. If you have less people surveyed than the ones on the template, delete the rest of data, if you have more, you can add more rows, the calculations will work.
2) in the same sheet you have the results, namely the 4 price points (indifference, optimal, lower, and upper bounds), they ara automatically calculated above and in the graph.
3) if you also want to find the price that maximizes revenues, you first have to add another question in the survey about the probability of purchasing your product at a specific price. Here I suggest tu use the average of the cheap and expensive price (using the answers of each person). In the second sheet you modify the data in the "green" cells, which is the same as the previous one, but it will also include the probability to buy. If you proposed a different price, you need to modify also the column G. If you have less people surveyed than the ones on the template, delete the rest of data, if you have more, you can add more rows, the calculations will work.
4) In the same sheet you have the results, namely the price that maximizes revenues. Notice that above the graph you can modify the number of prospective clients. This is useful if you are also interested in estimating the revenue amount at the optimal price and/or at other price points.
It is available to download instantly and is ready to use. As it is a template, it is fully editable allowing the user to modify for their specific needs.
If you have any problems or questions regarding this tool, don't hesitate to start a discussion below. Alternatively, you can reach out directly through private message via my Eloquens author account.
If you have enjoyed utilising this tool, please show your appreciation by leaving a 5* rating and review!
This Best Practice includes
1 Van Westendorp Price Sensitivity Meter Excel Template
