
Originally published: 22/04/2019 07:36
Last version published: 08/04/2021 07:51
Publication number: ELQ-52984-6
View all versions & Certificate
Last version published: 08/04/2021 07:51
Publication number: ELQ-52984-6
View all versions & Certificate

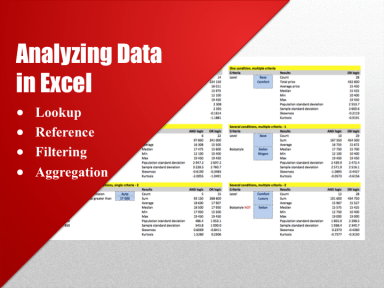
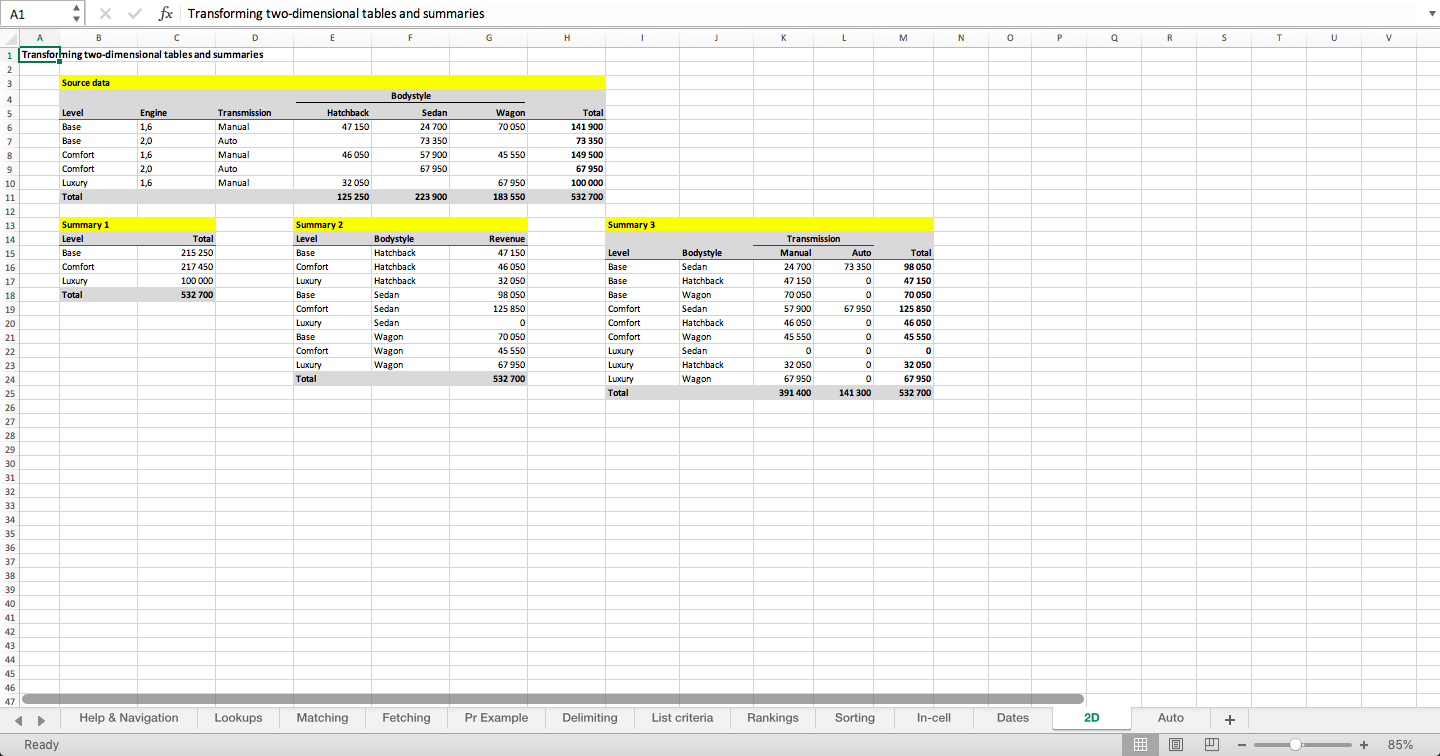
Analysing data in Excel
A set of techniques for working with data in Excel
Further information
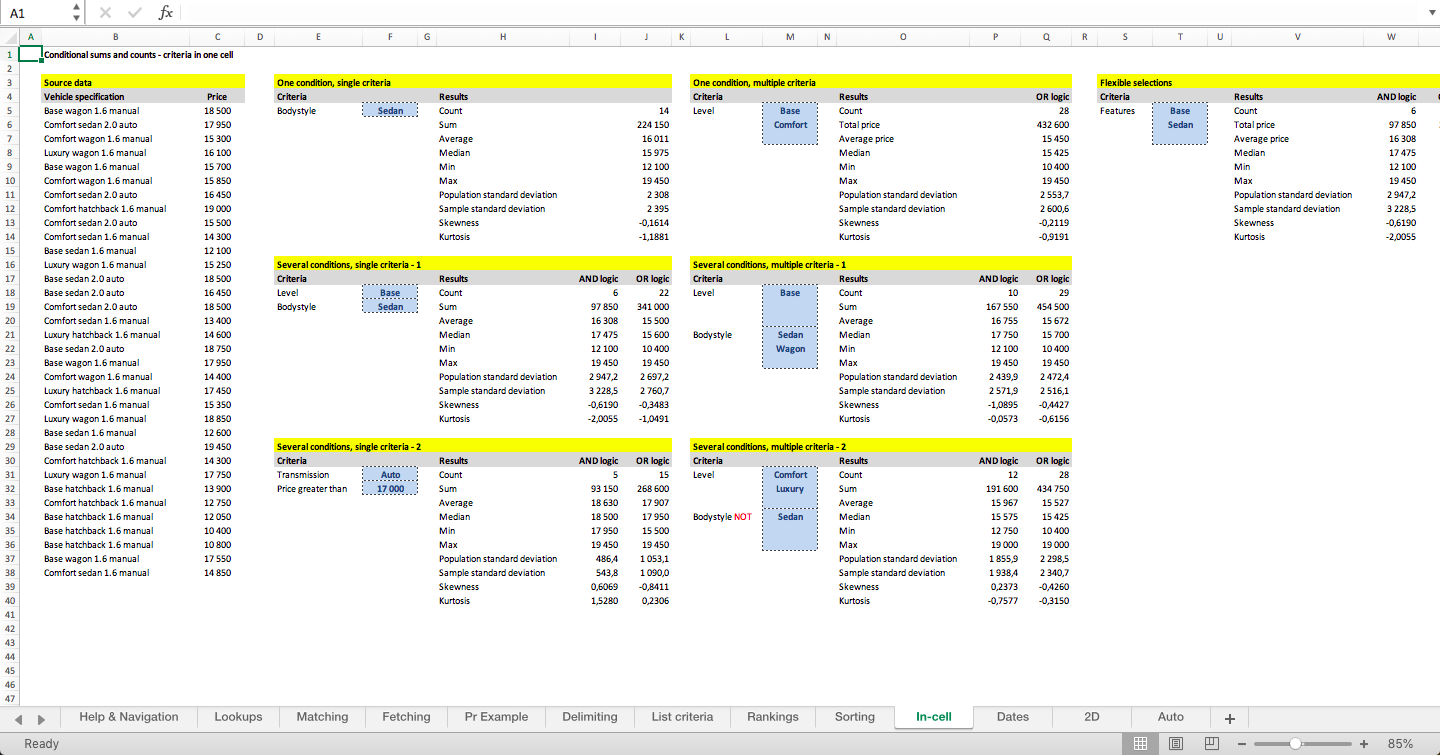
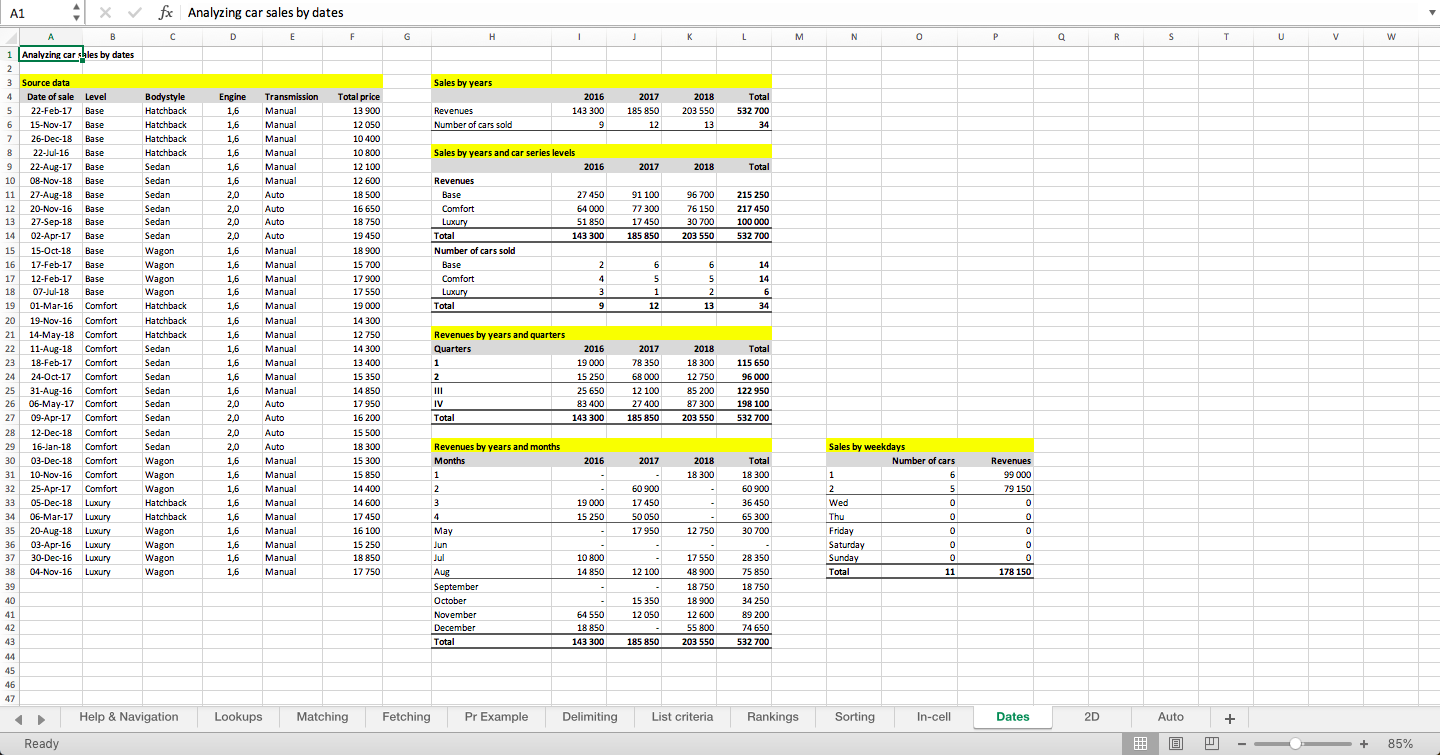
Calculating statistical measures of data based on various criteria
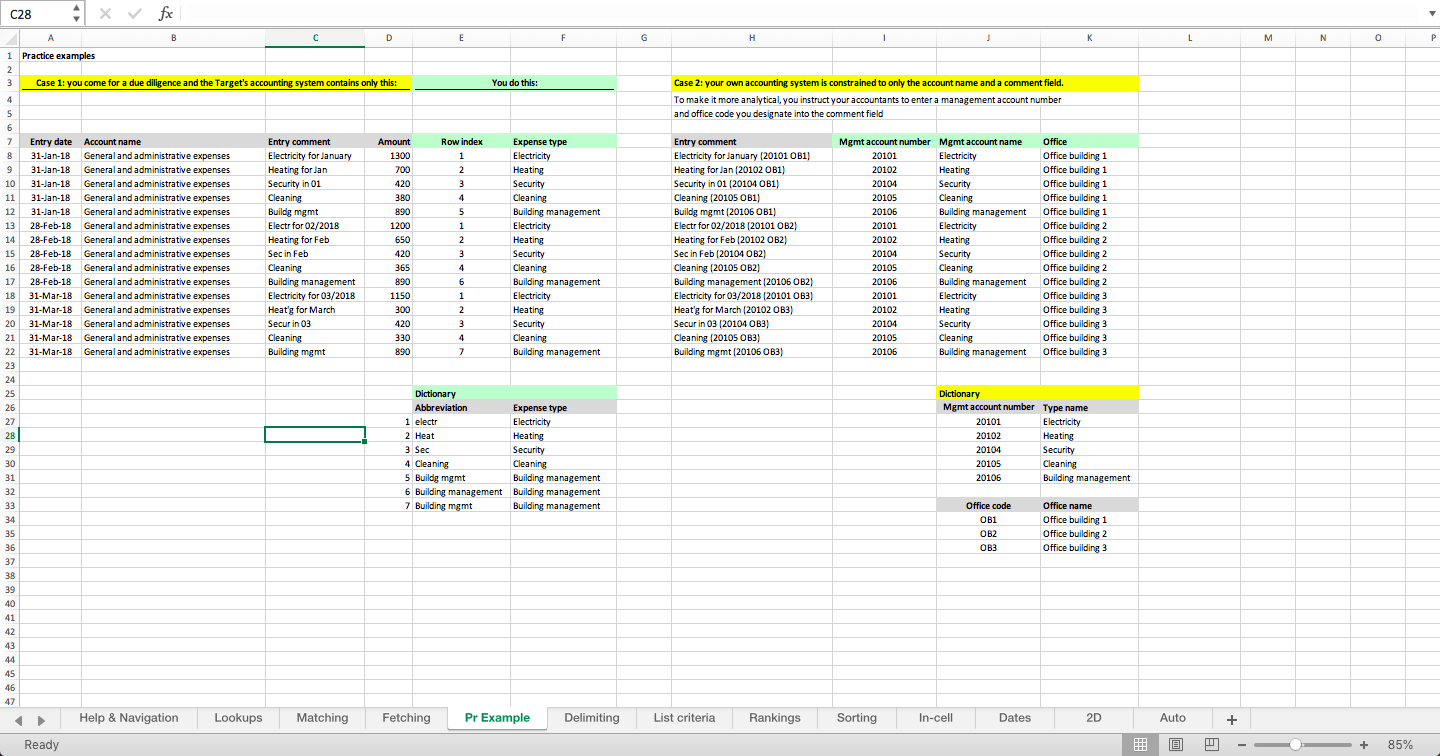
Tables with data which needs to be analysed based on certain conditions and criteria.
None
