
Originally published: 06/04/2020 14:43
Last version published: 07/09/2022 12:14
Publication number: ELQ-29516-13
View all versions & Certificate
Last version published: 07/09/2022 12:14
Publication number: ELQ-29516-13
View all versions & Certificate

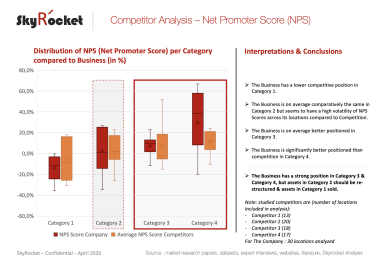
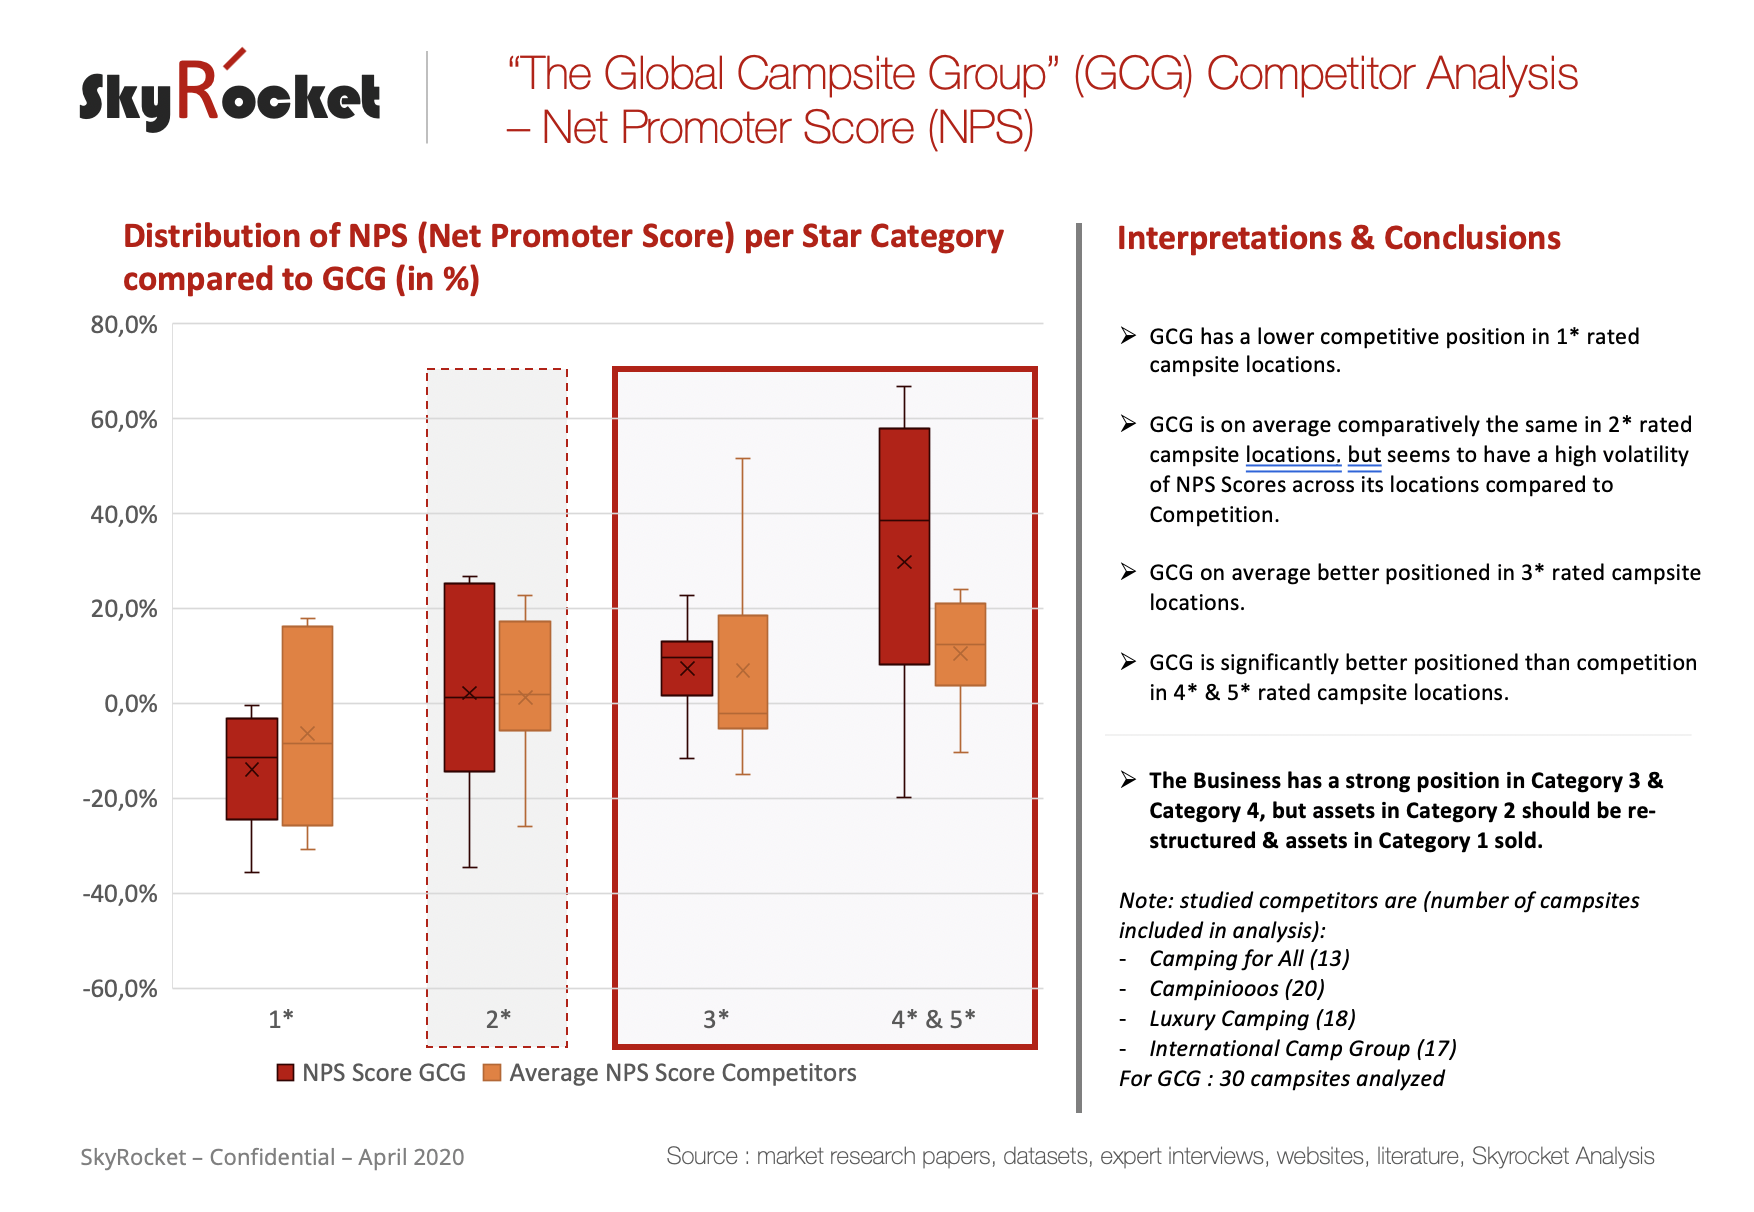
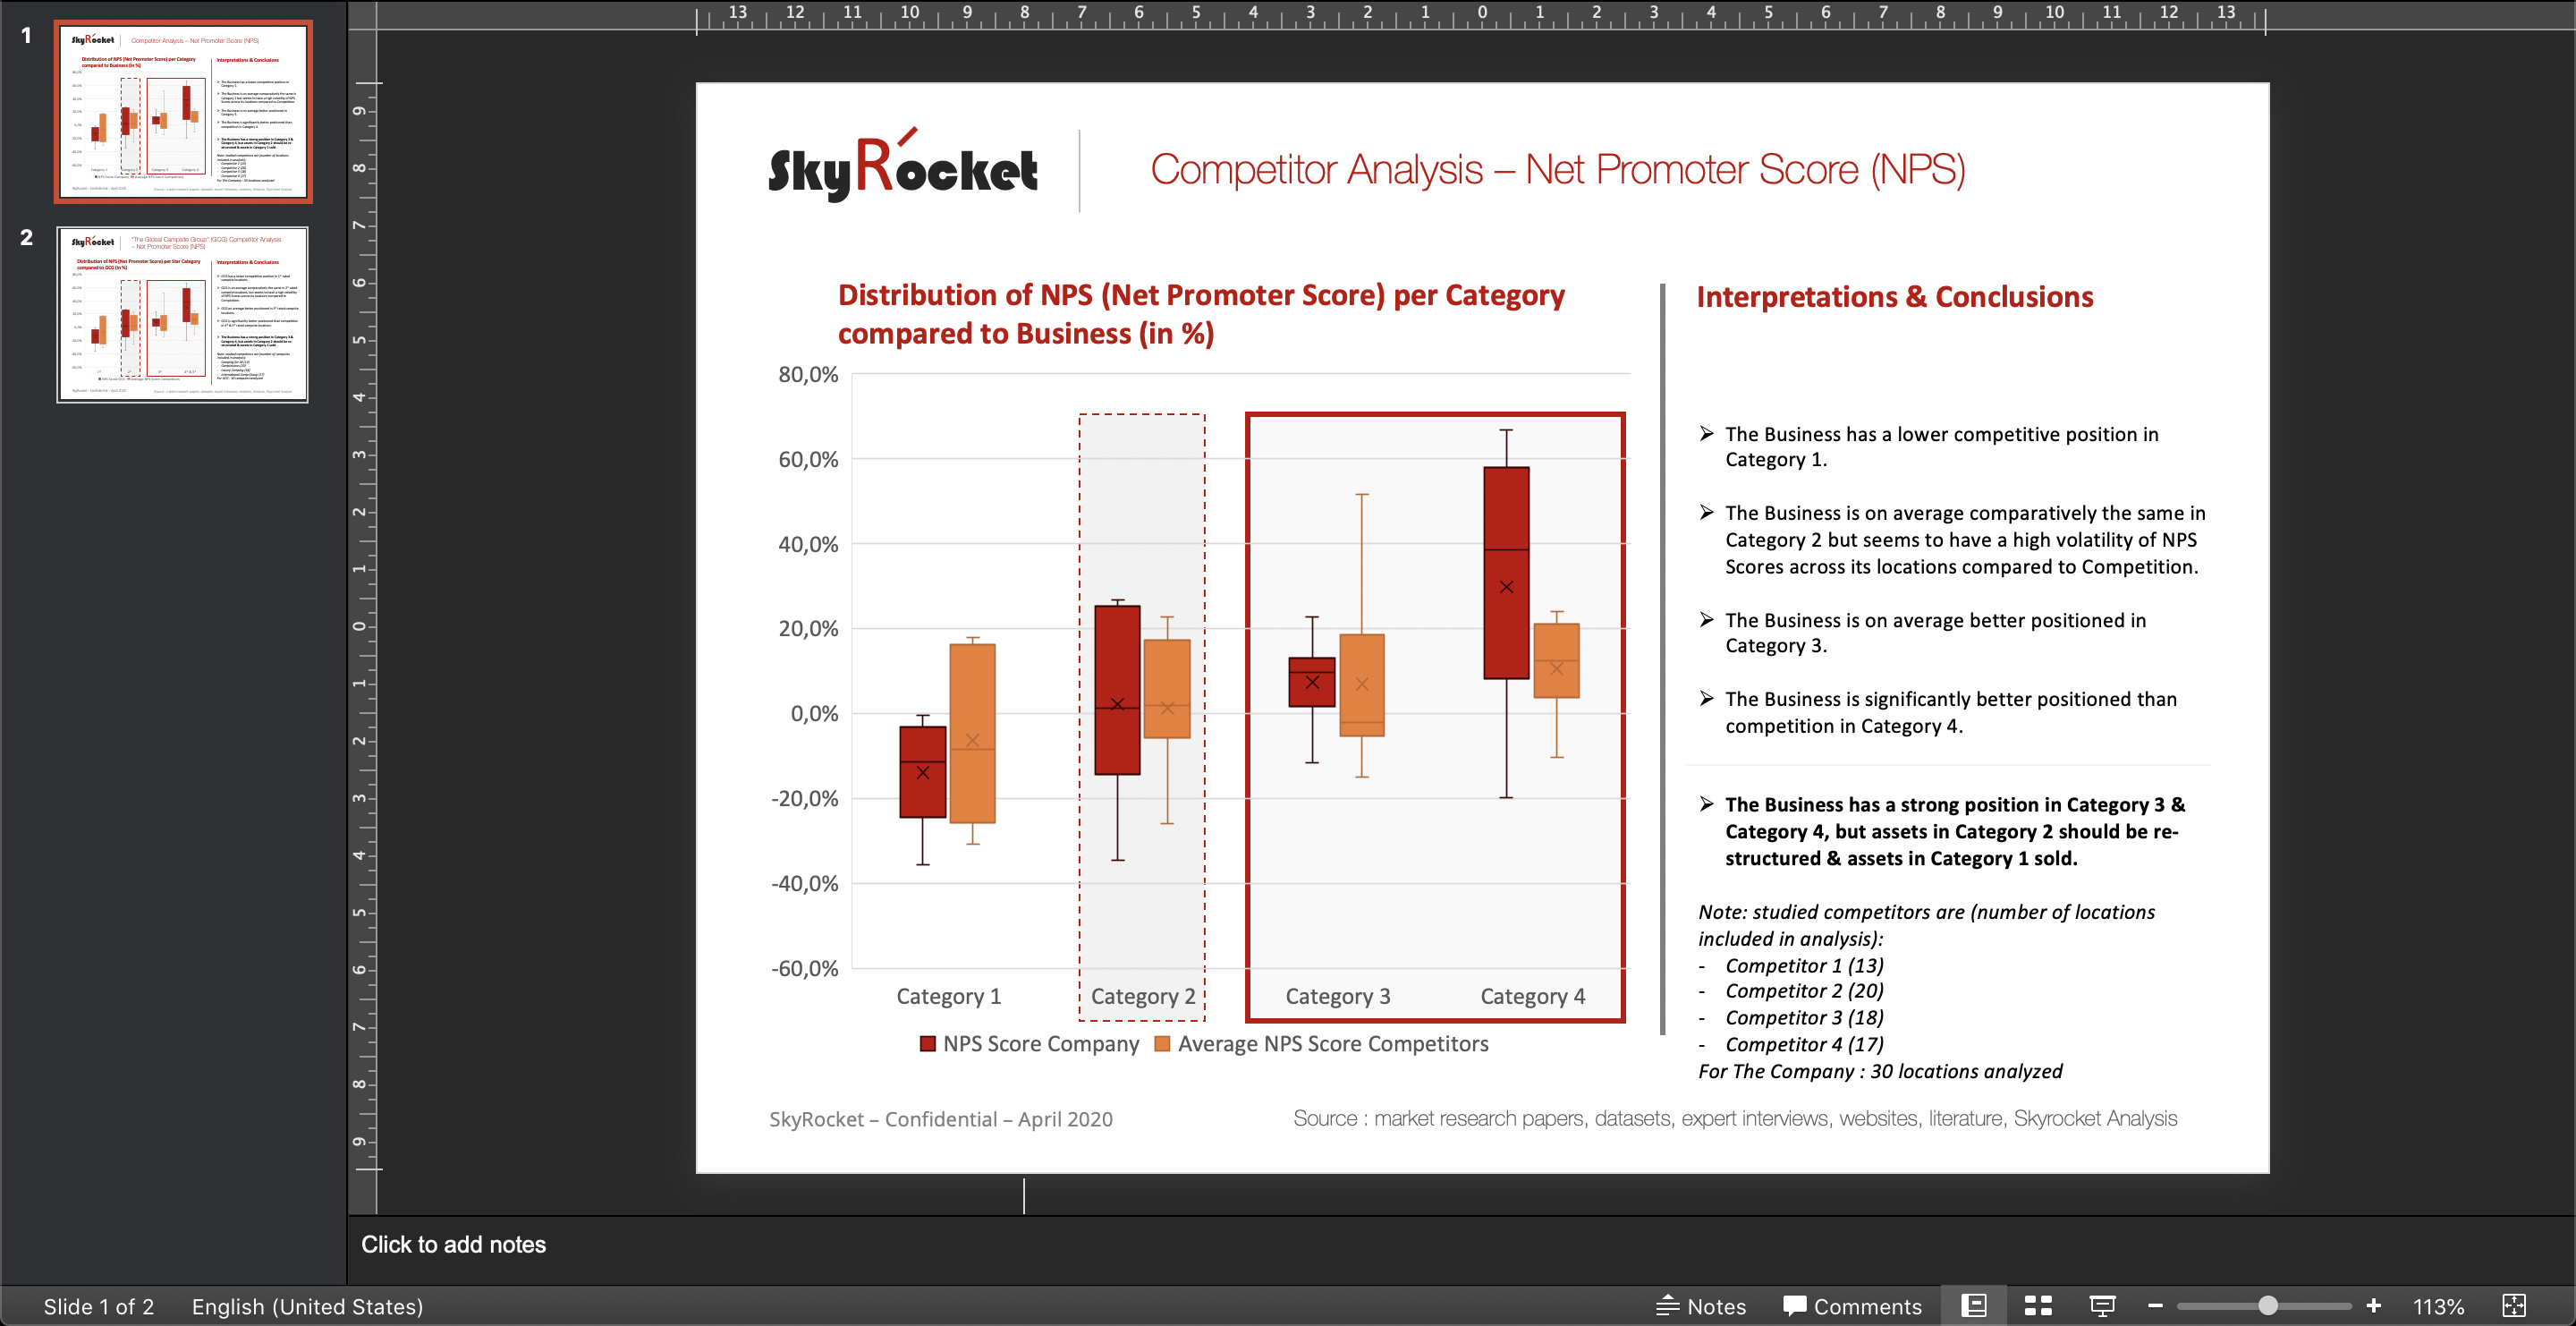
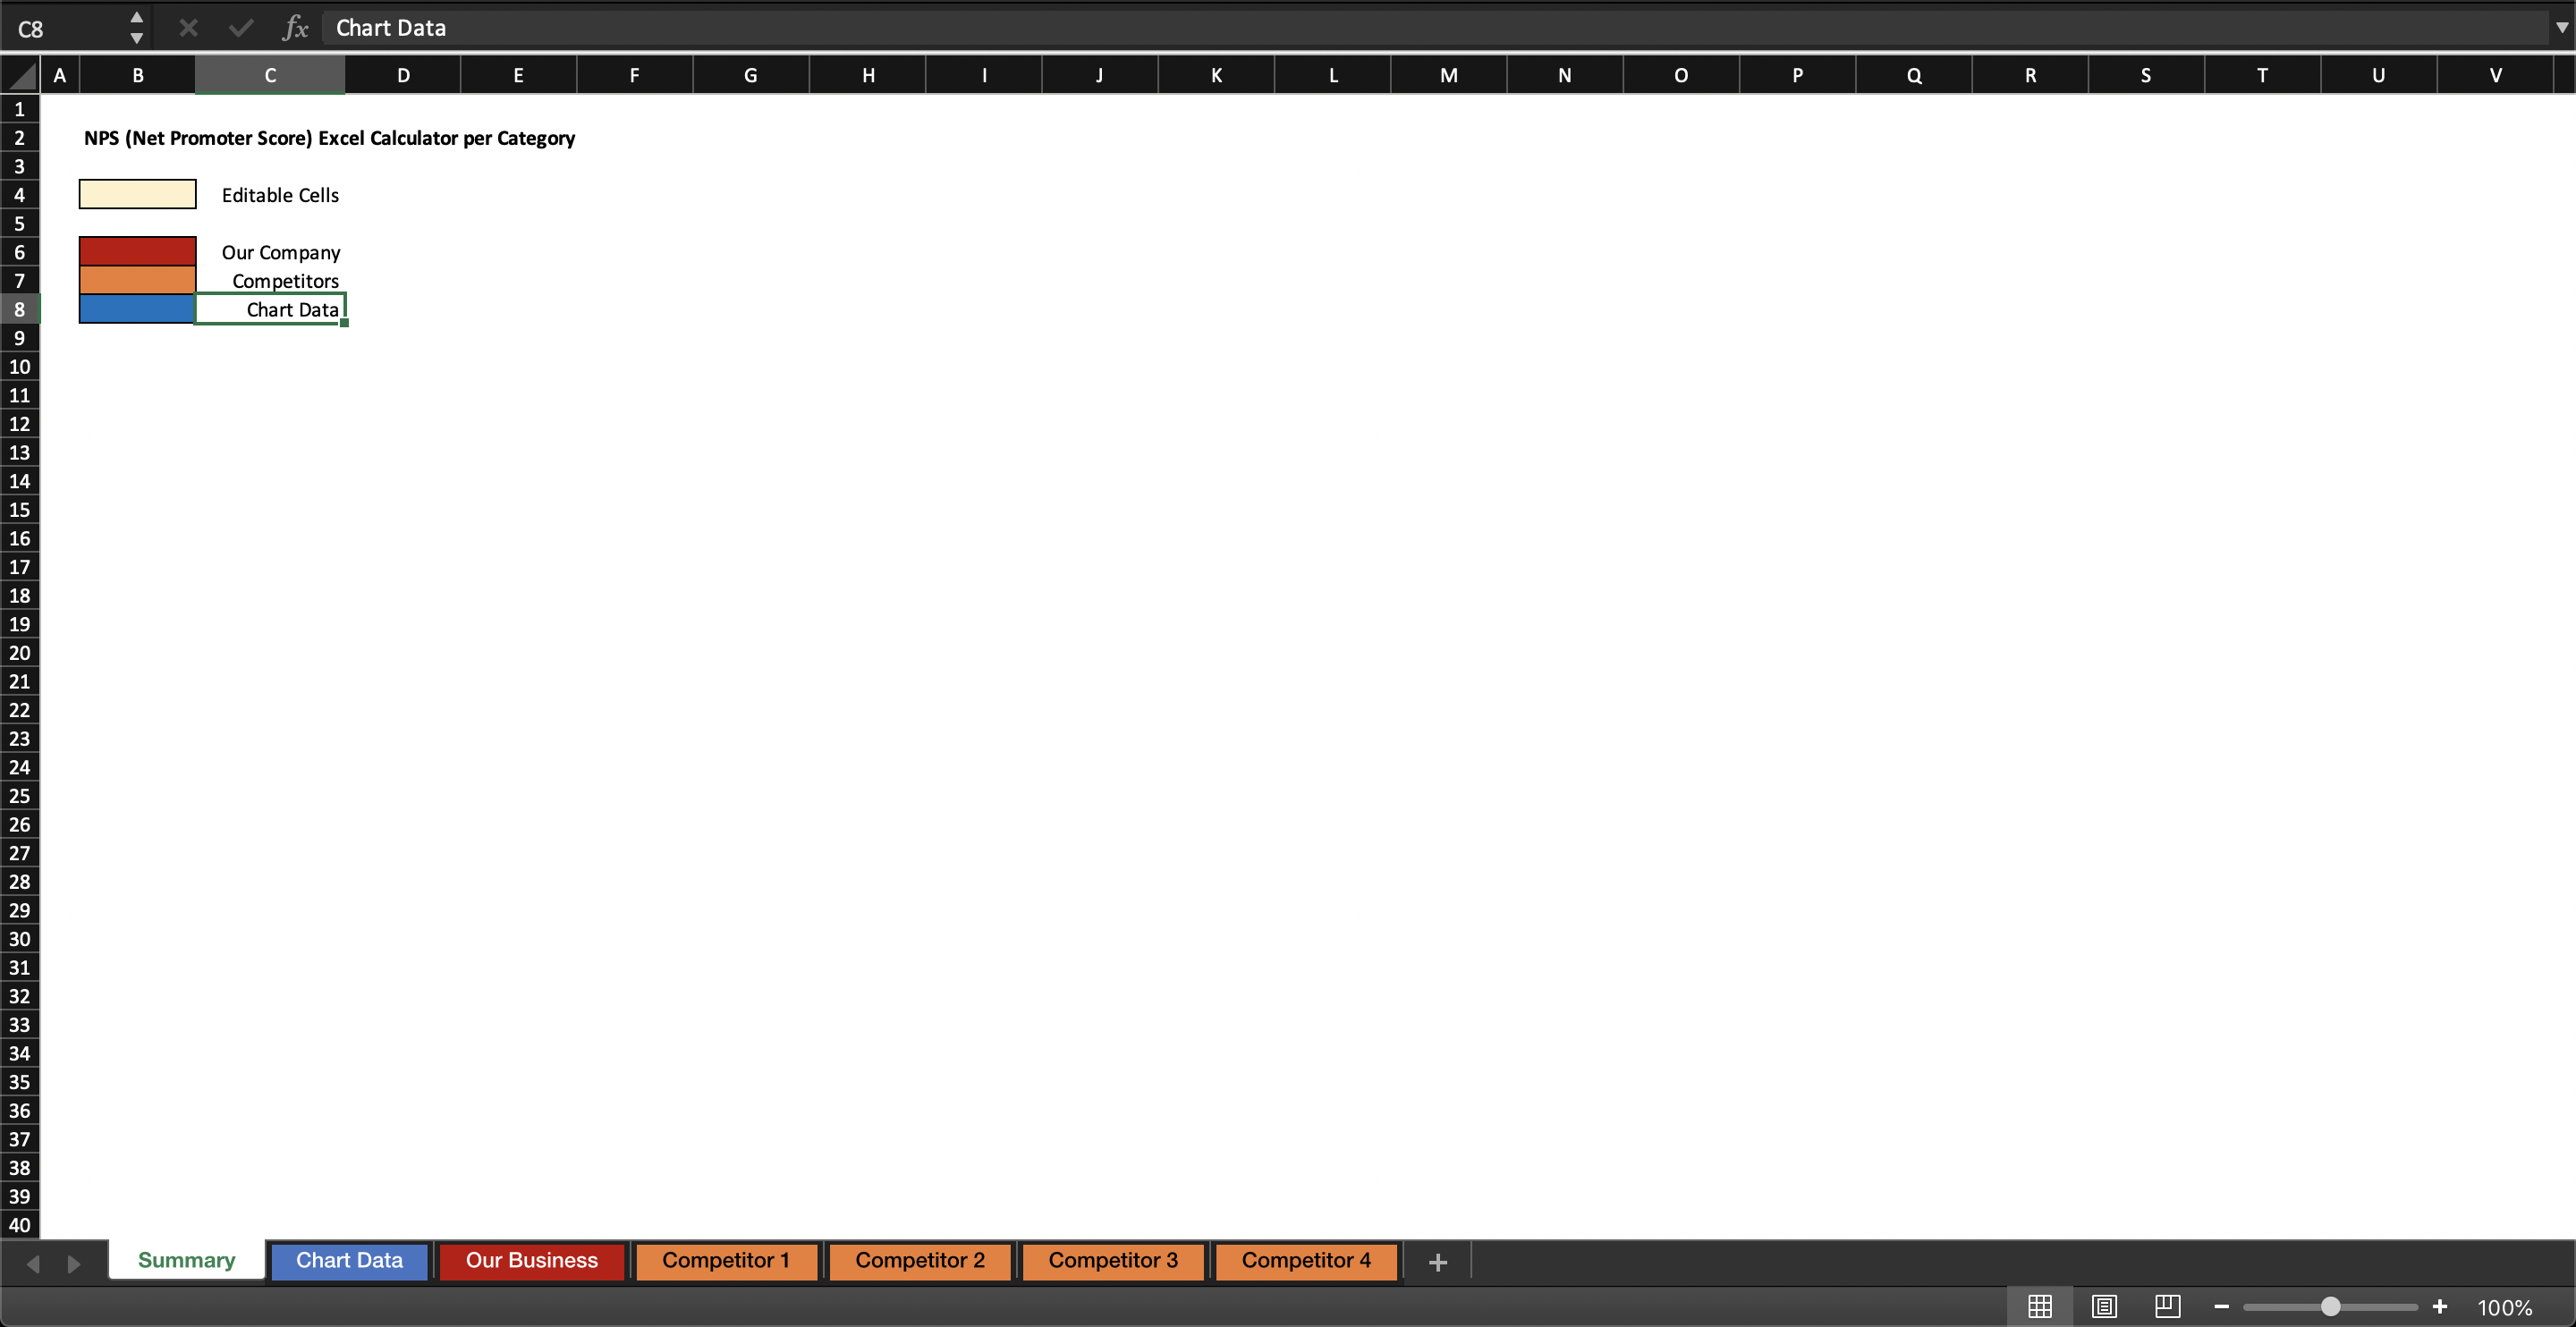
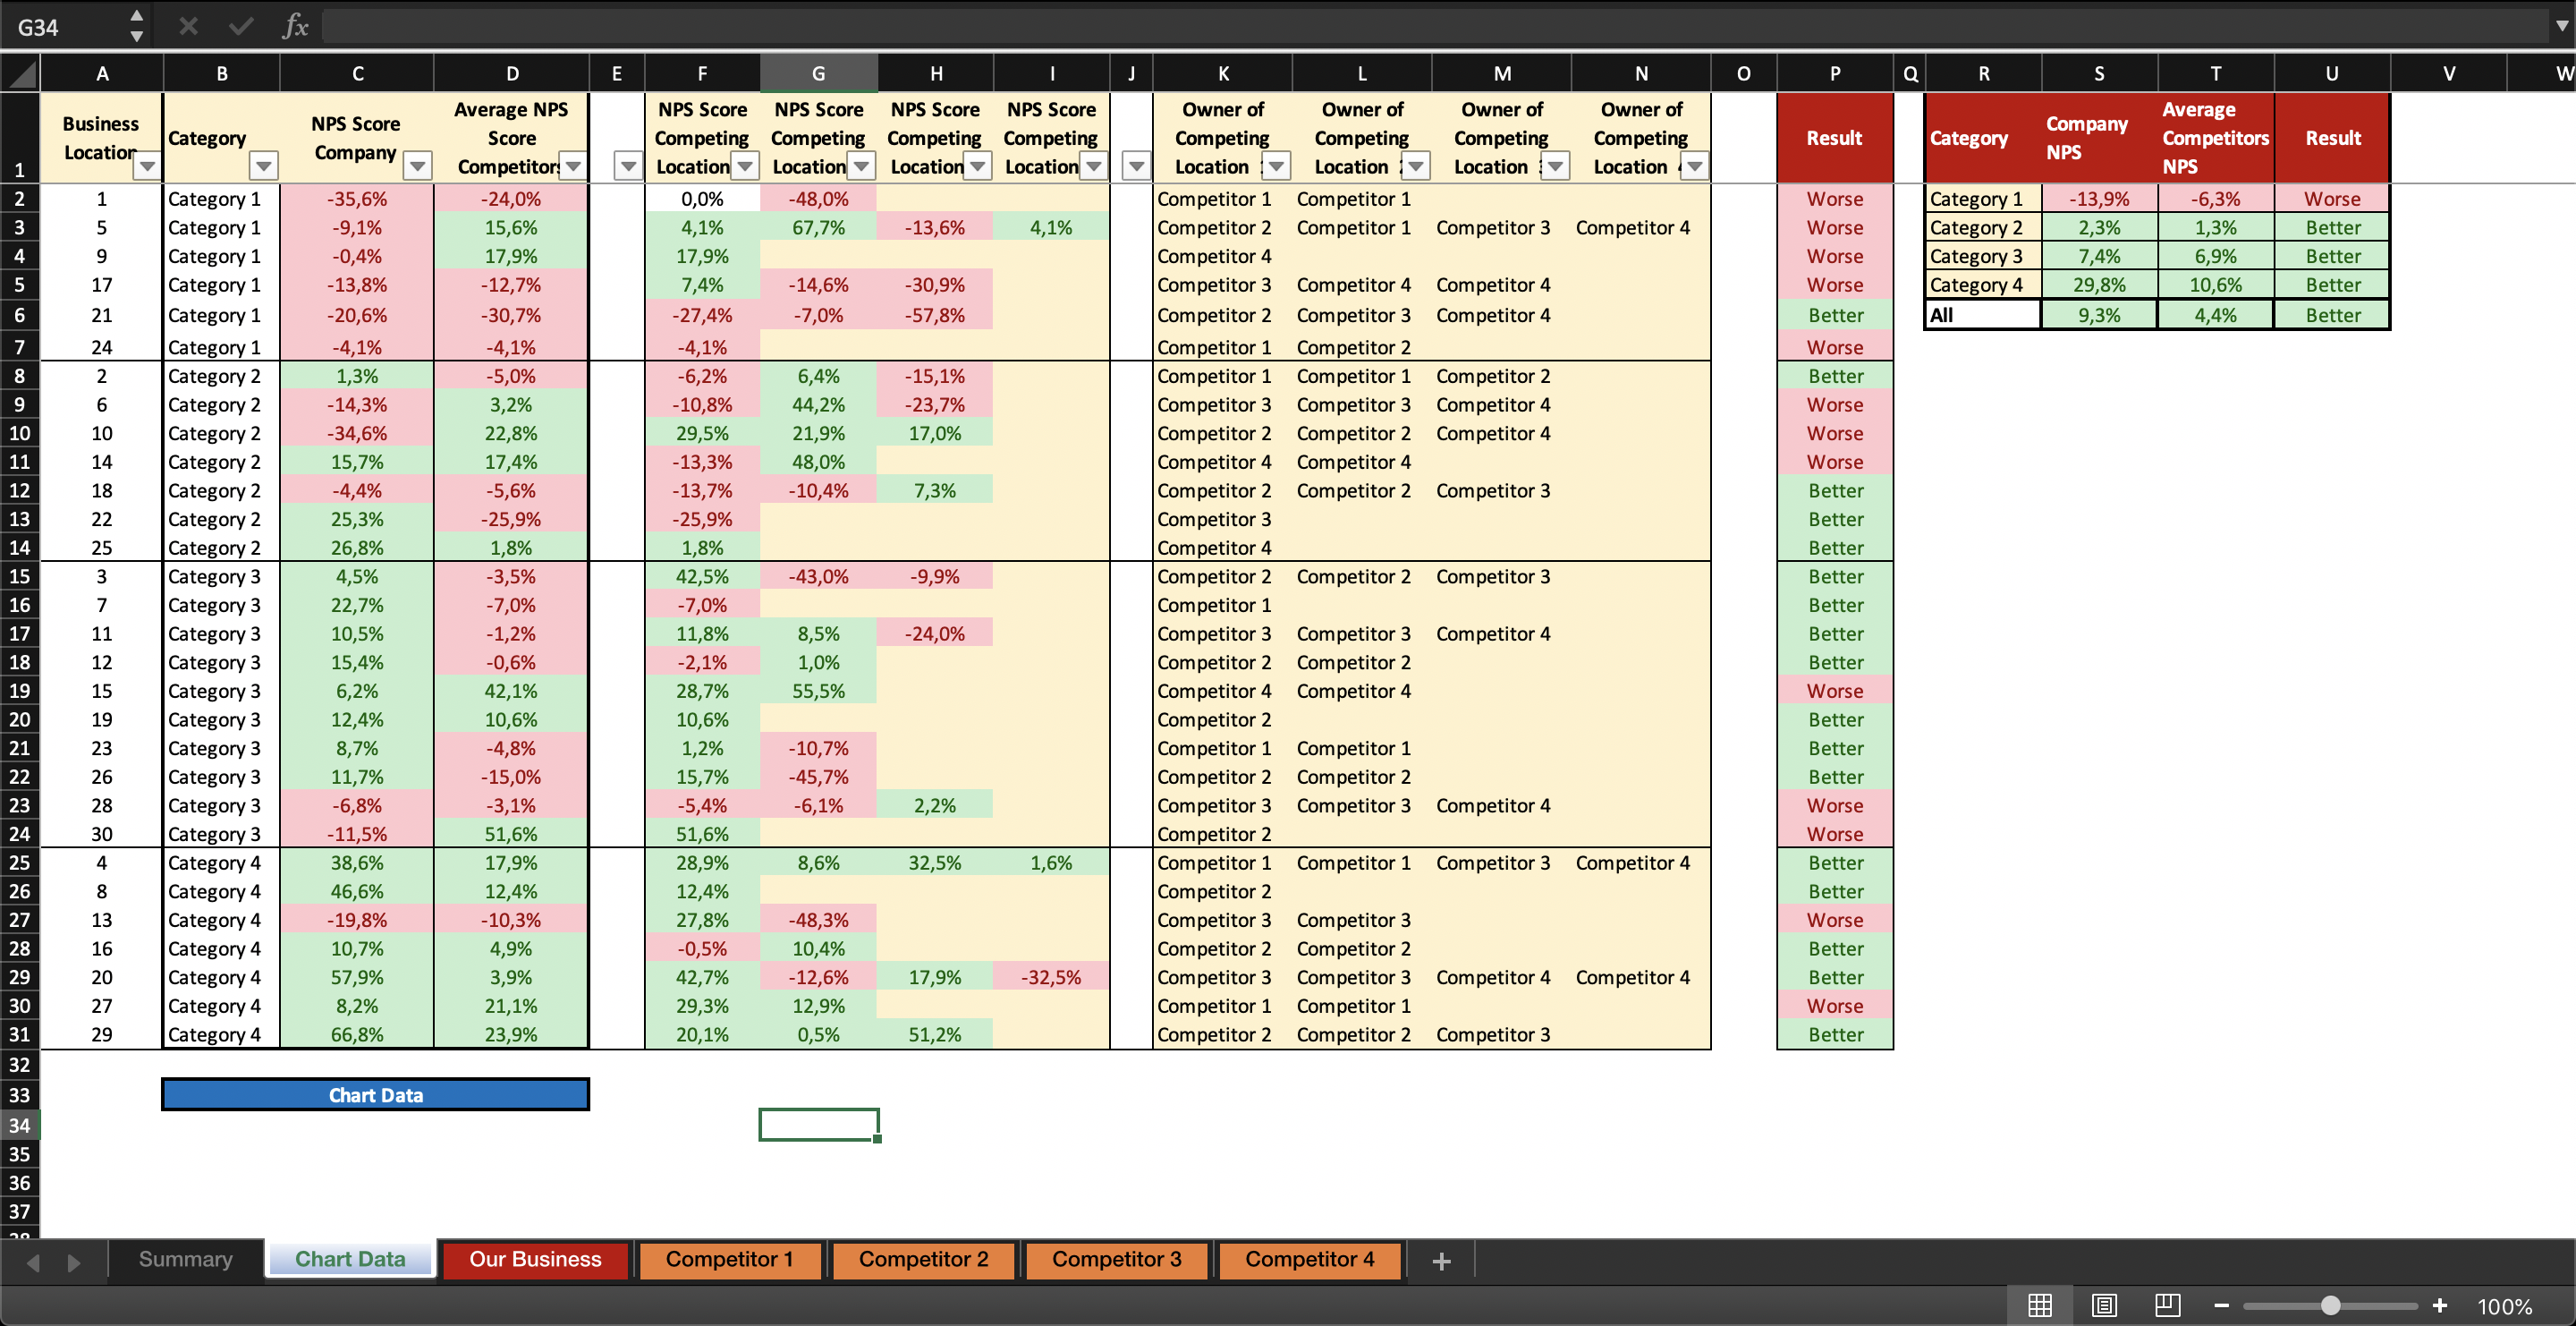
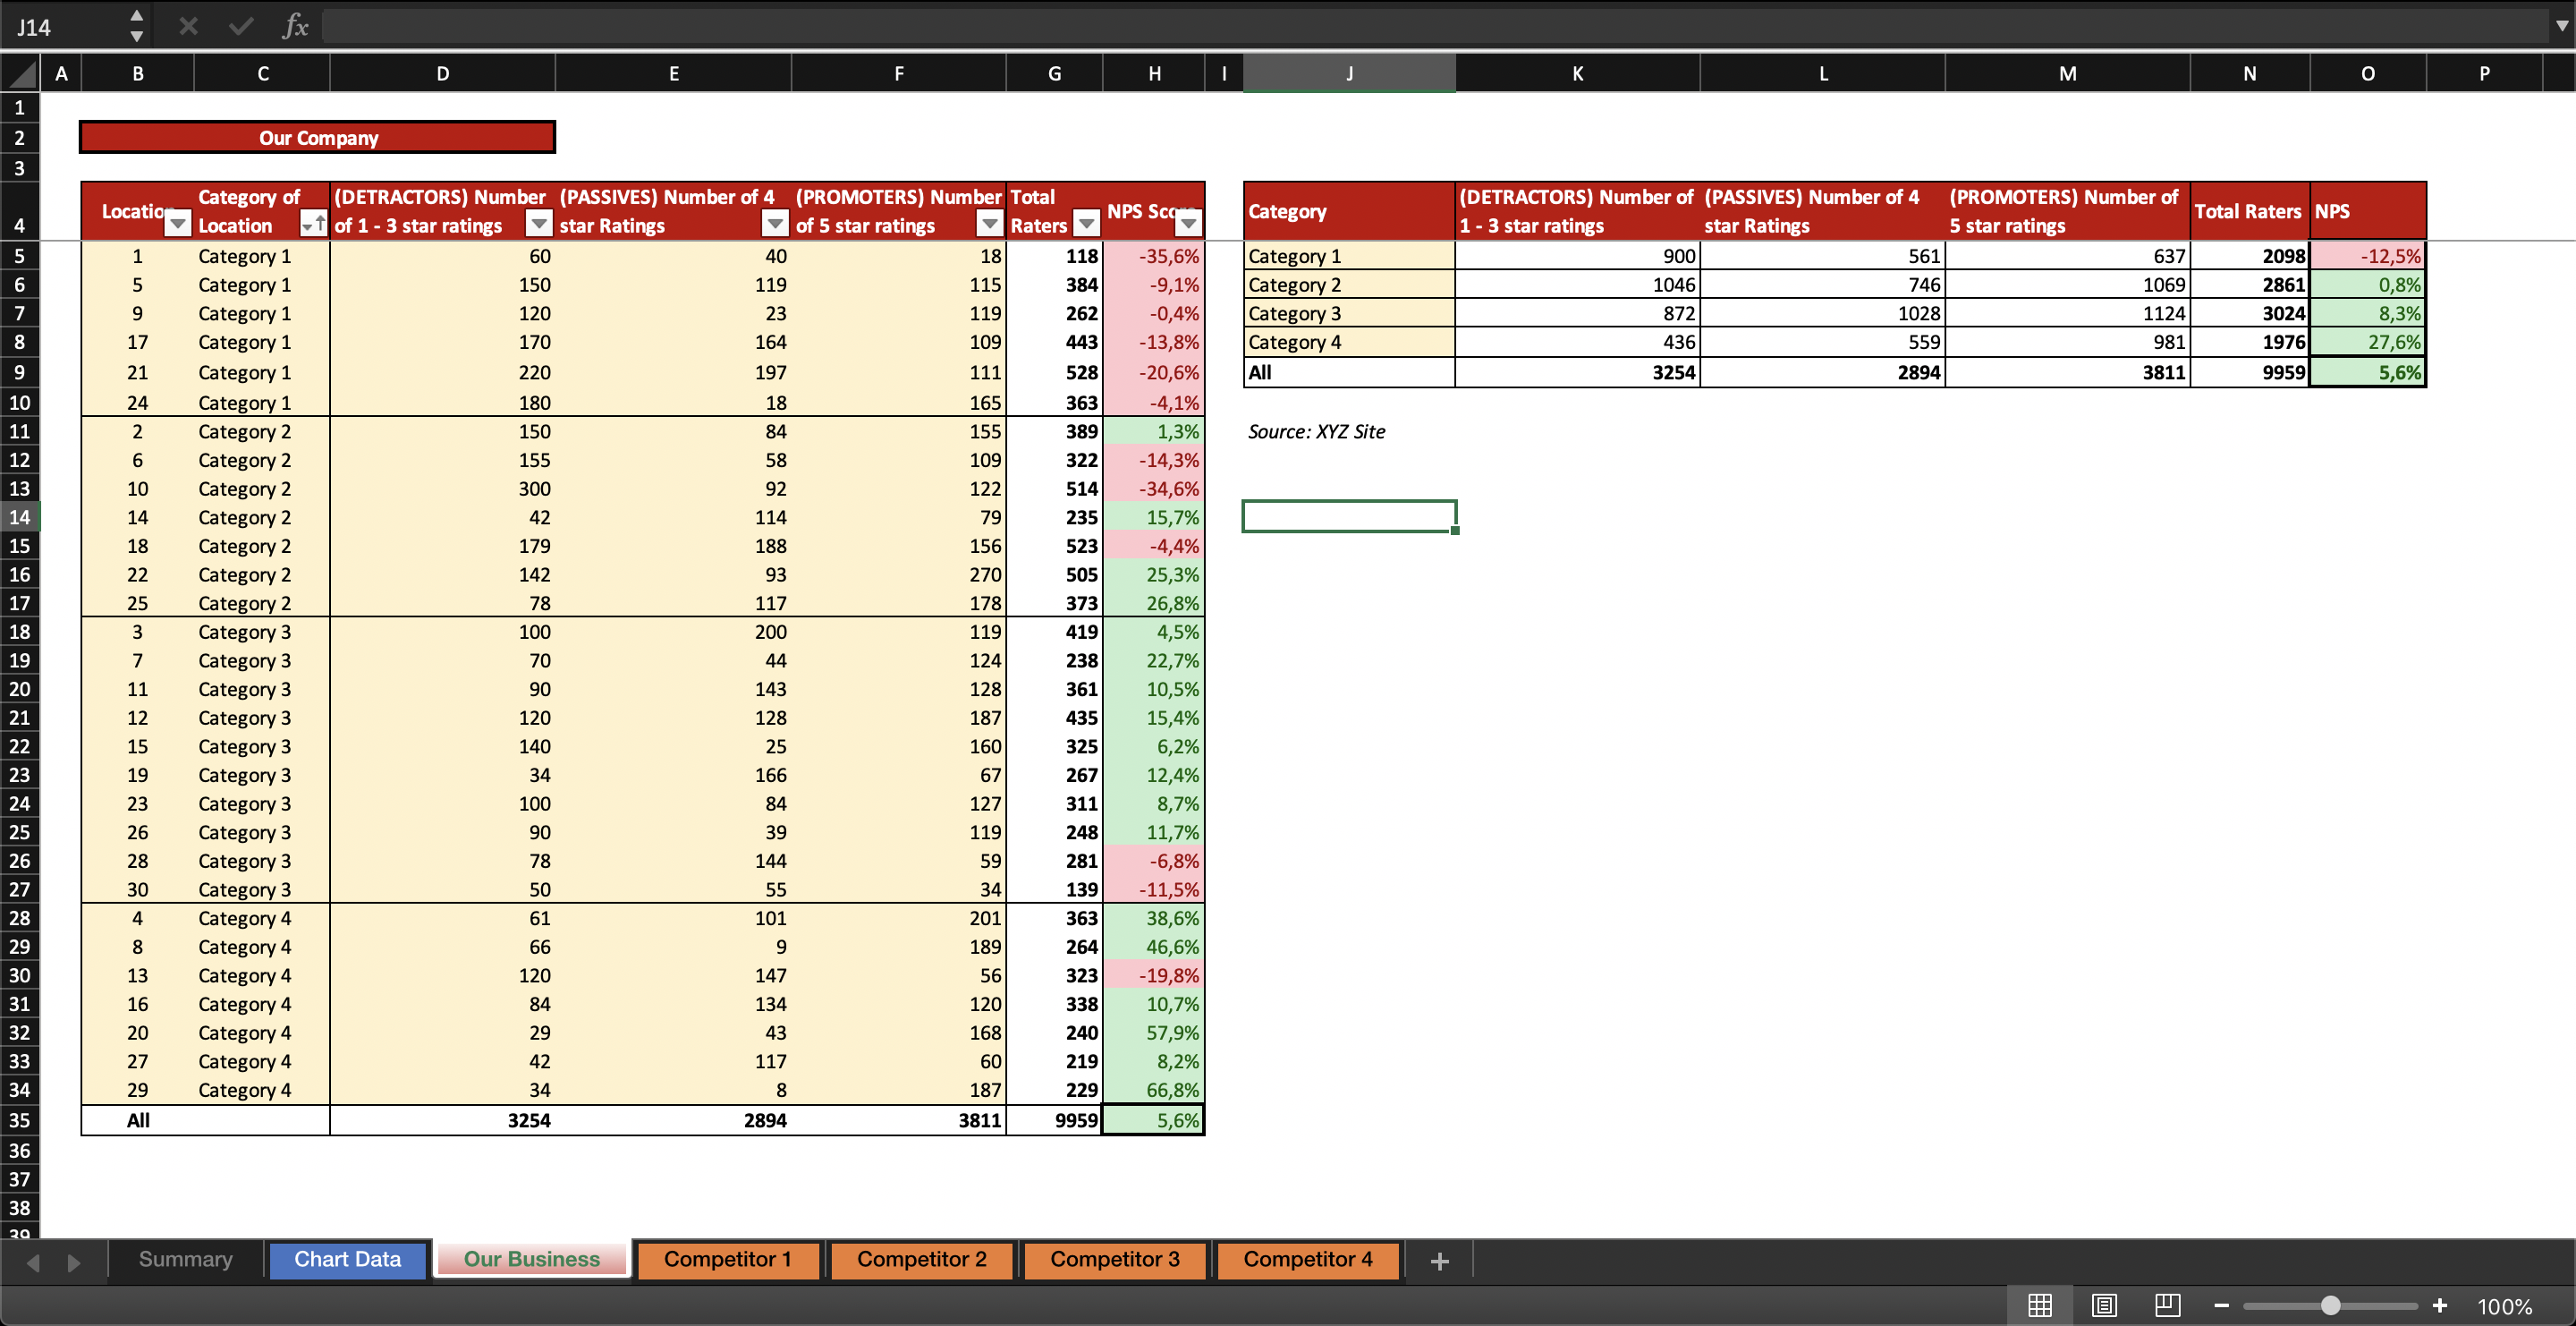
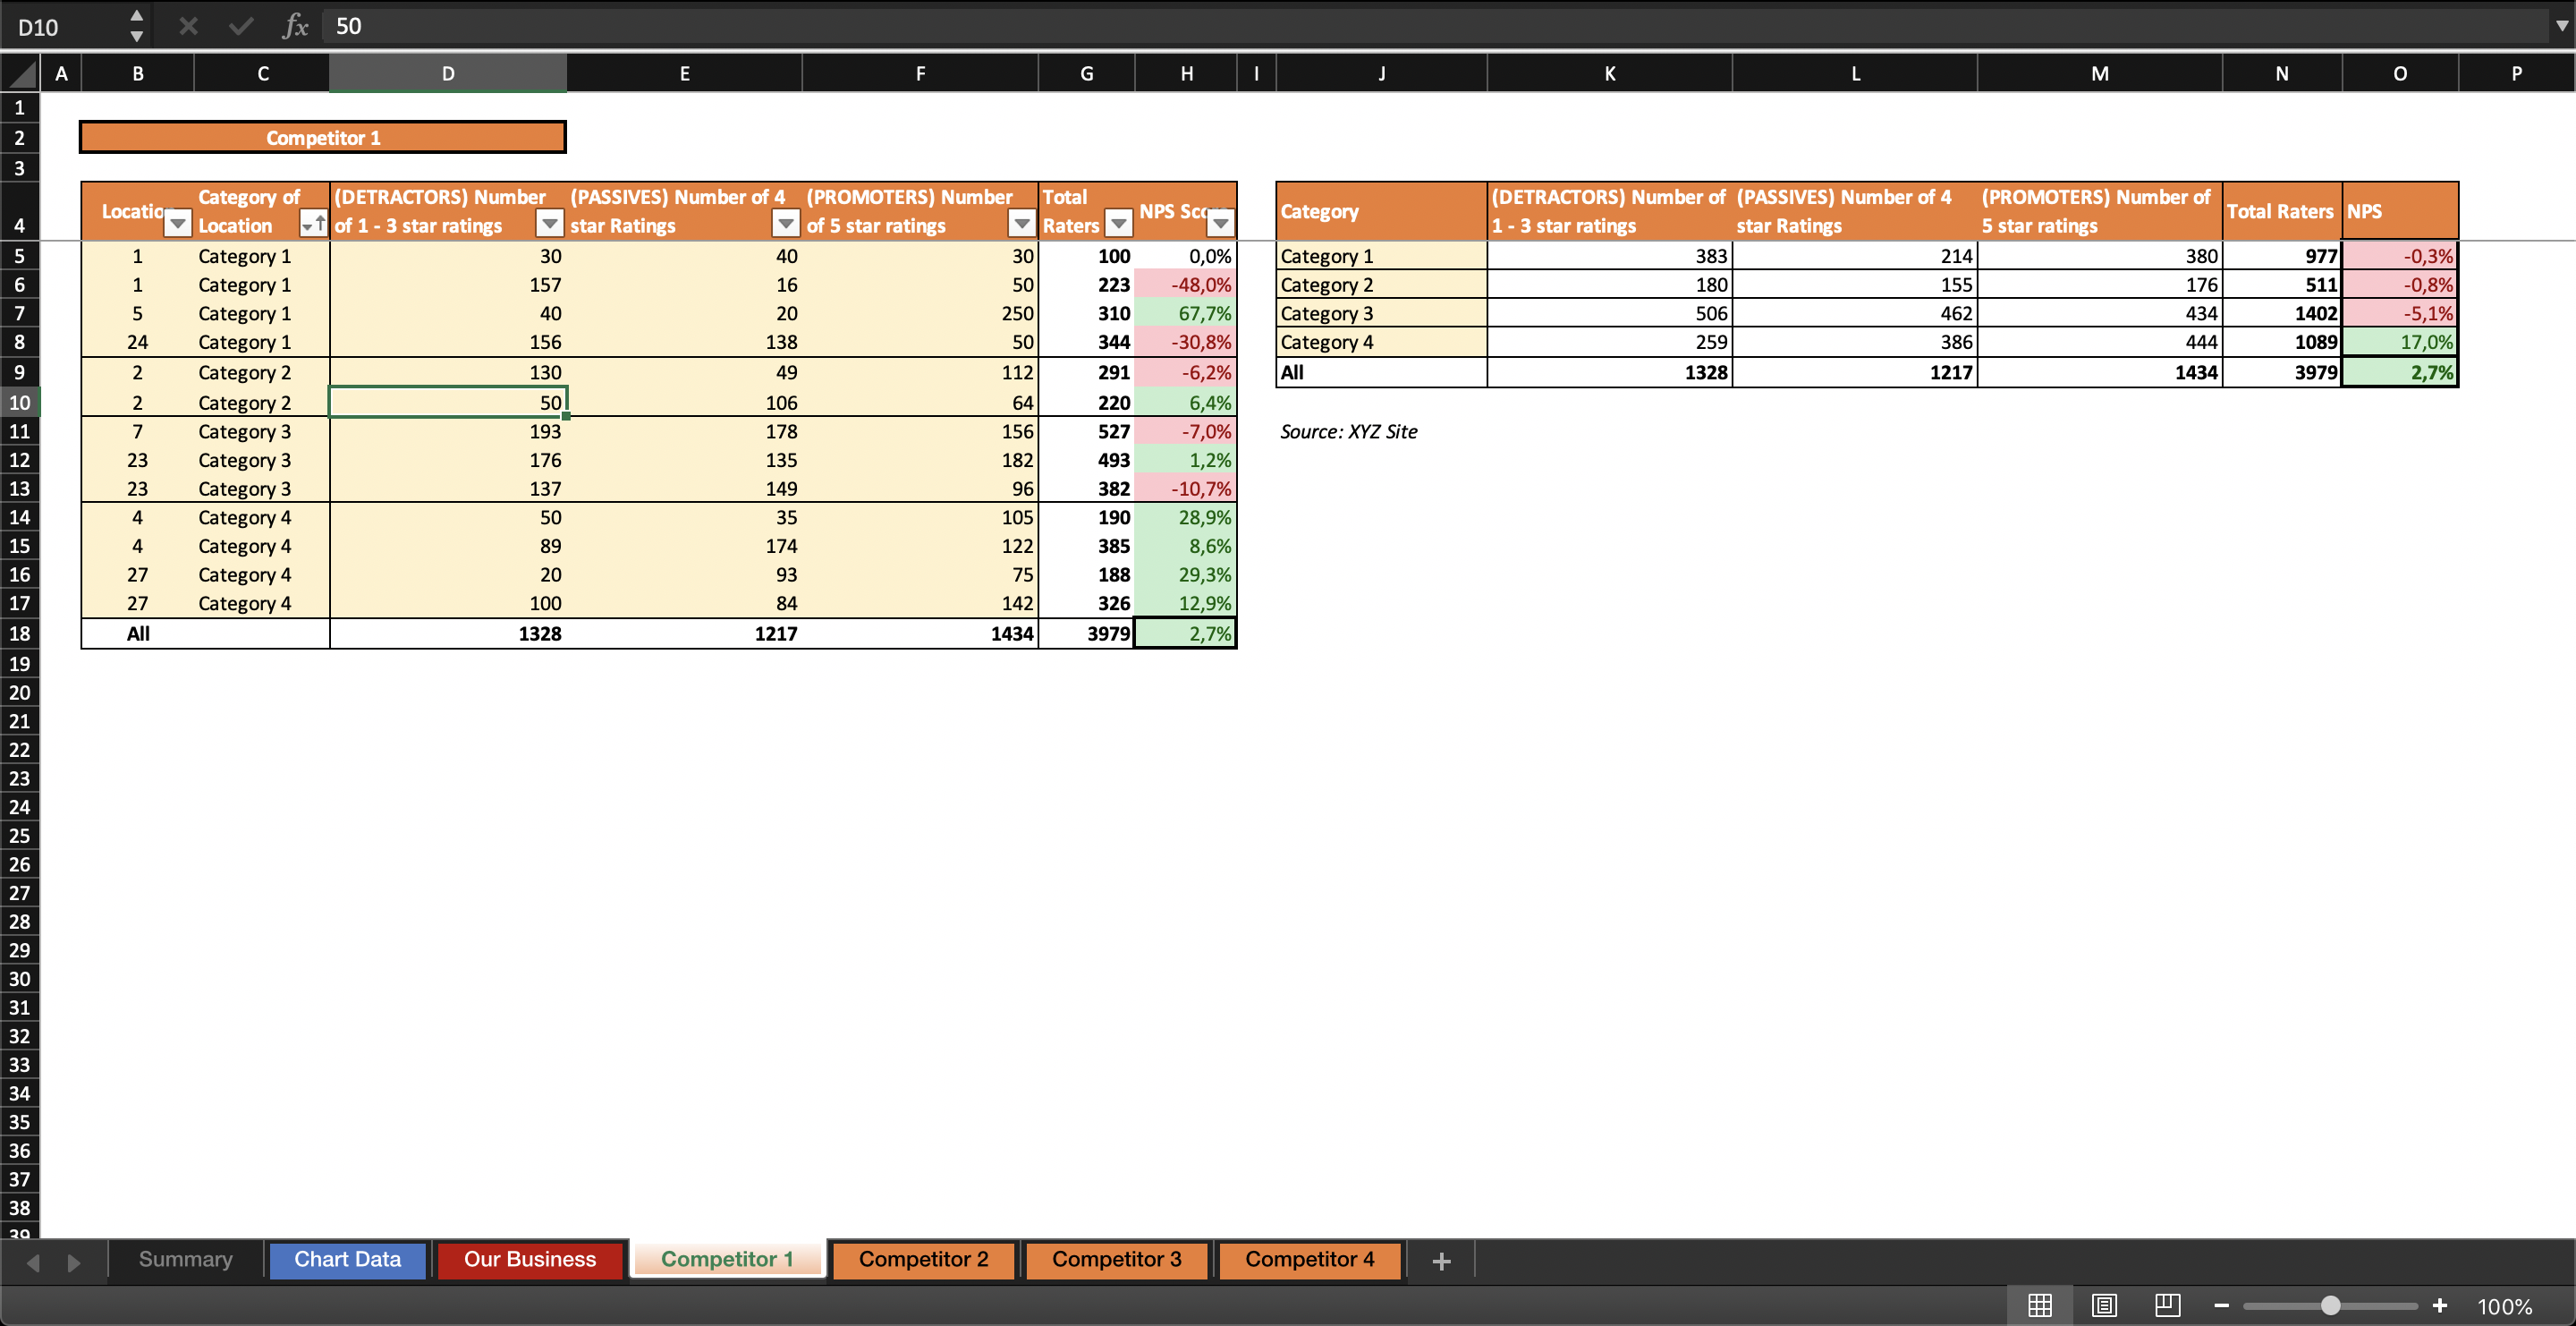
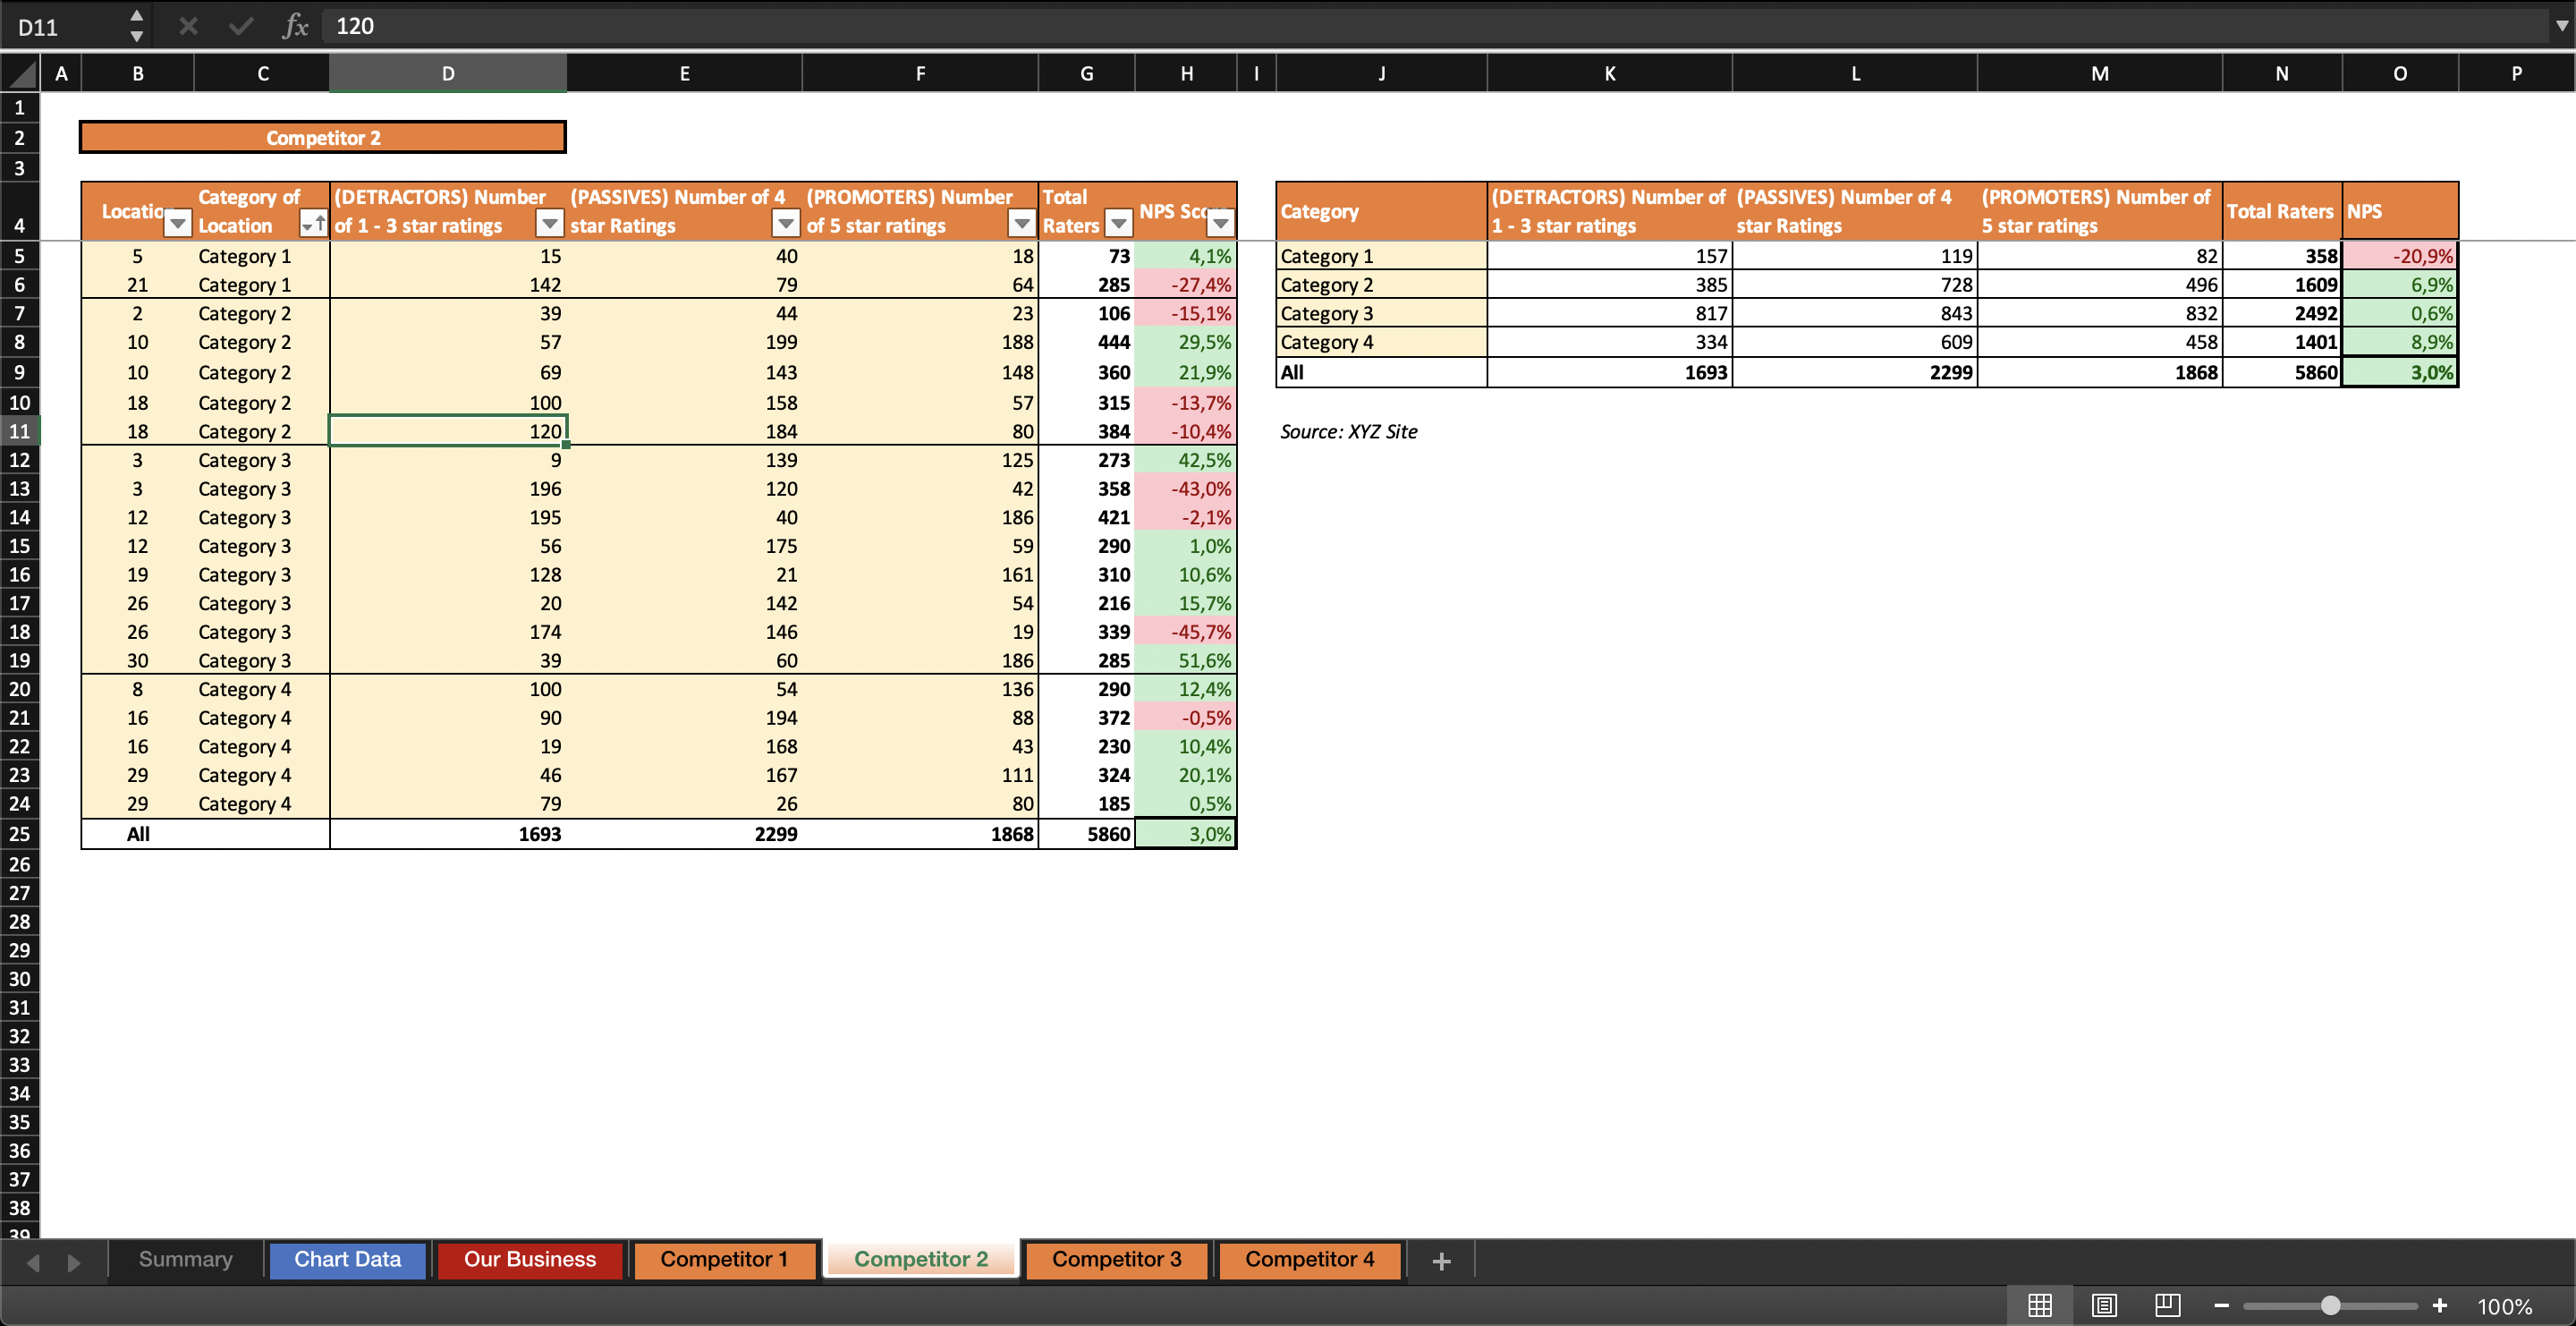
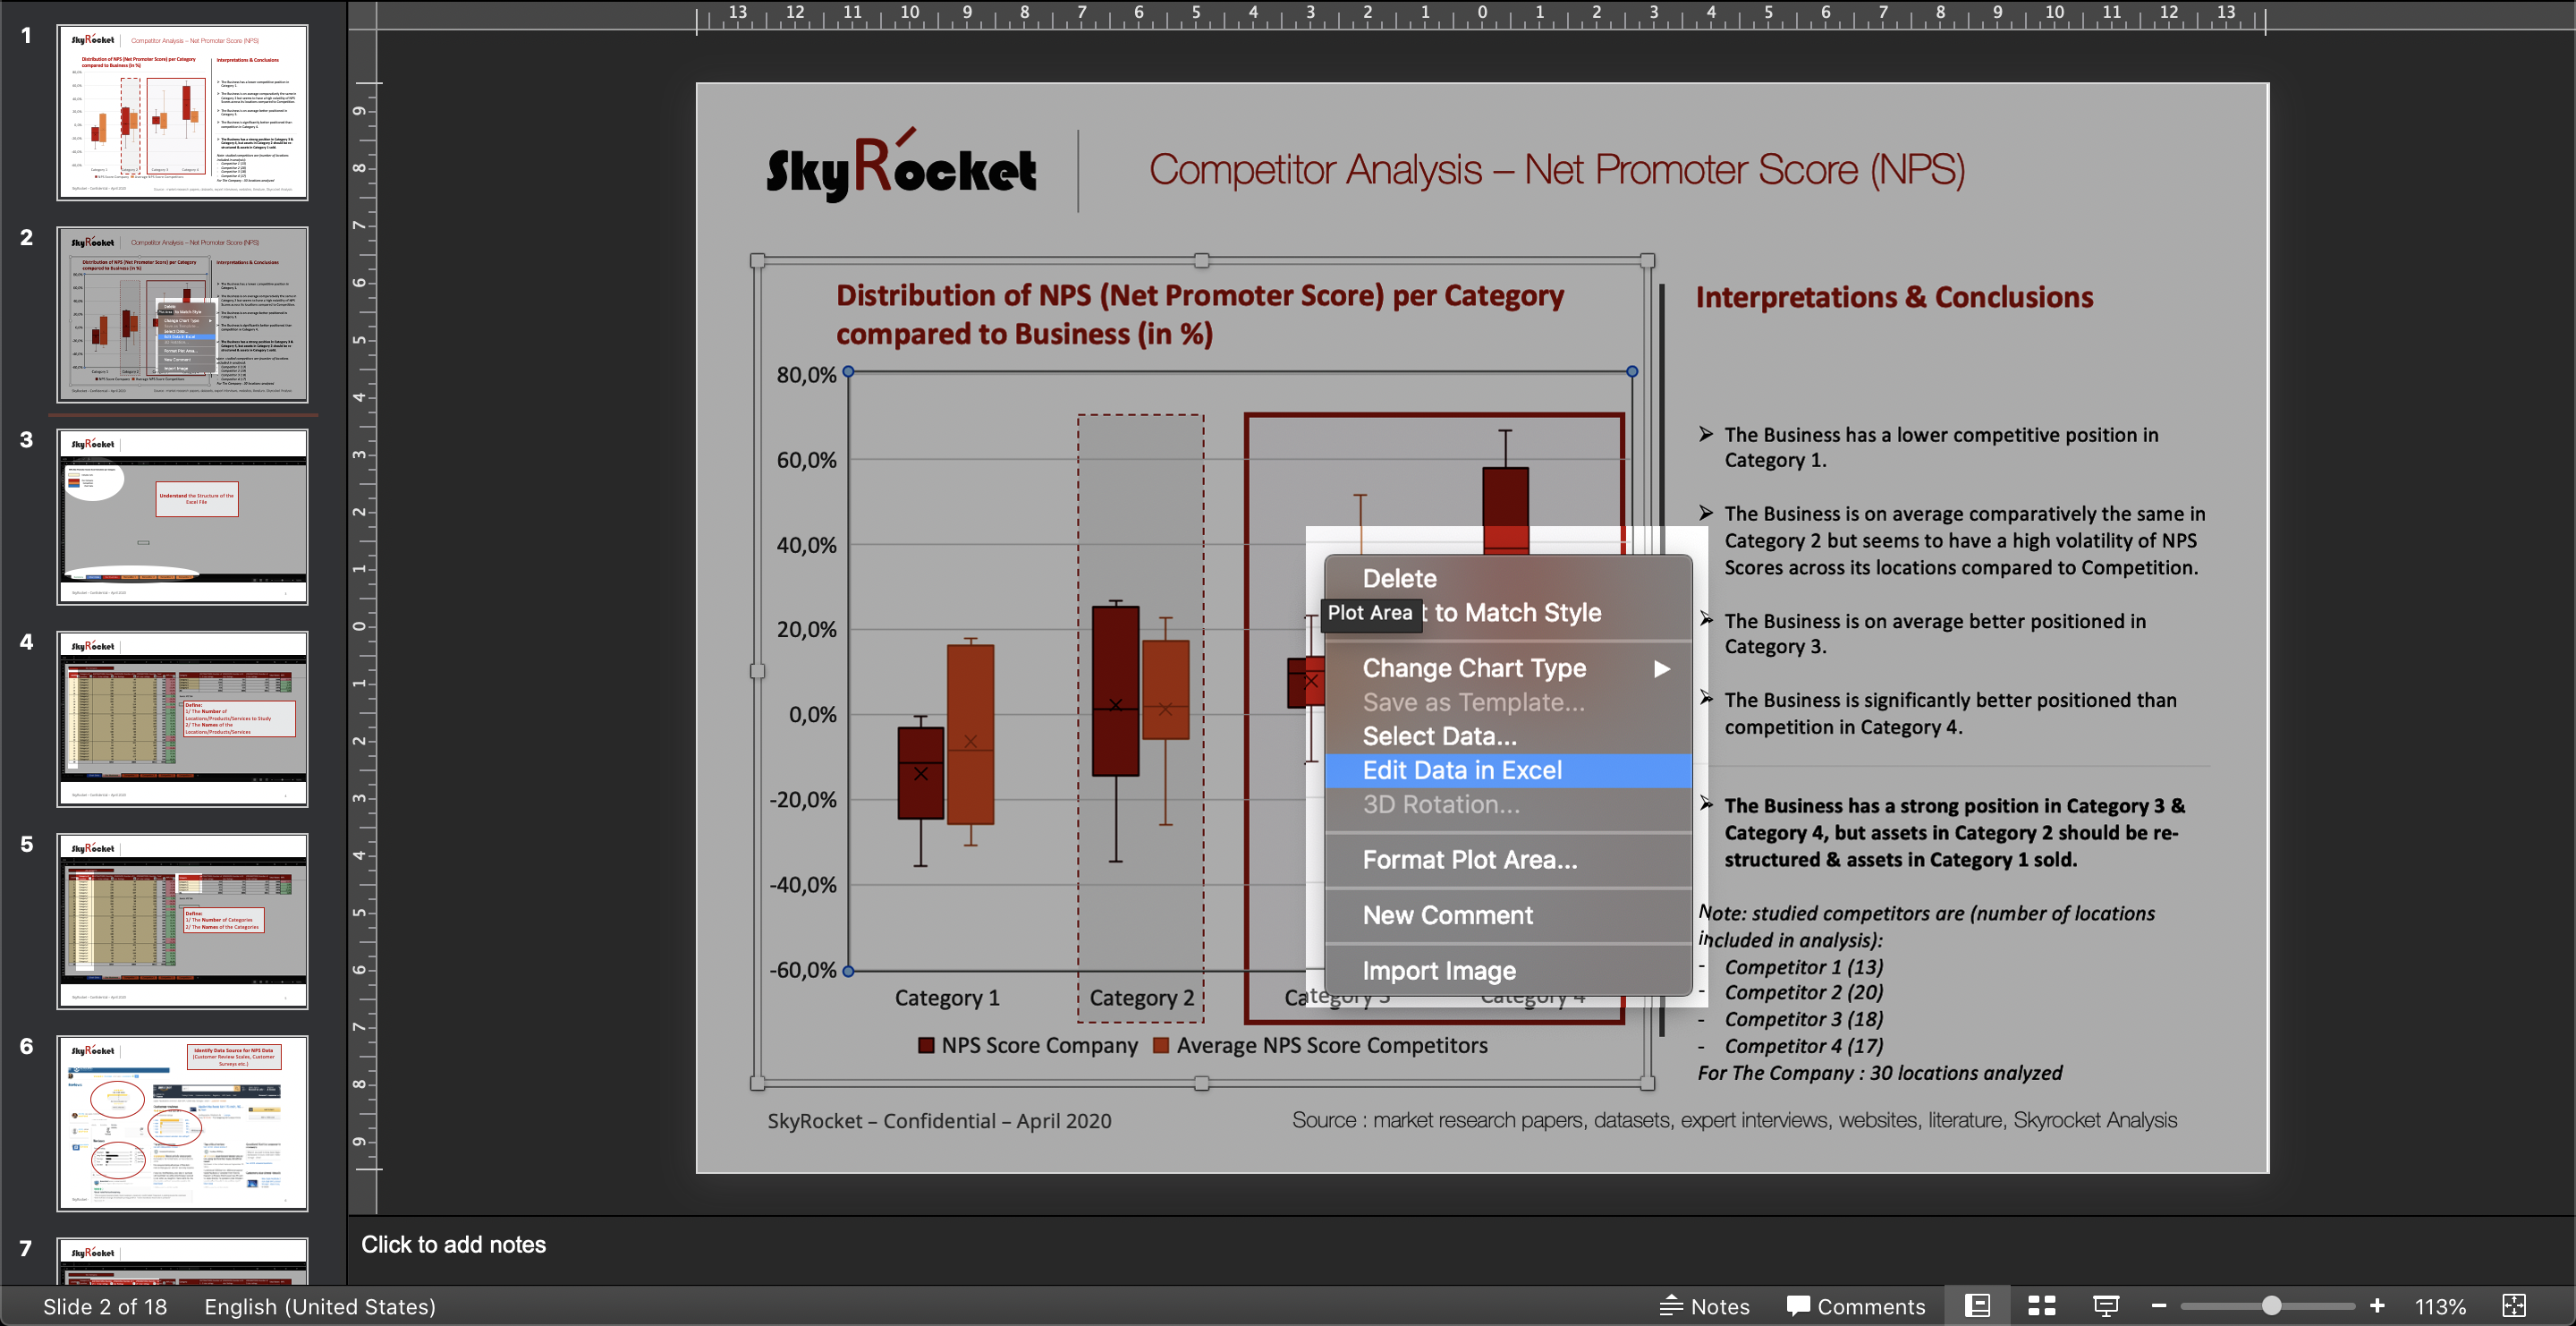
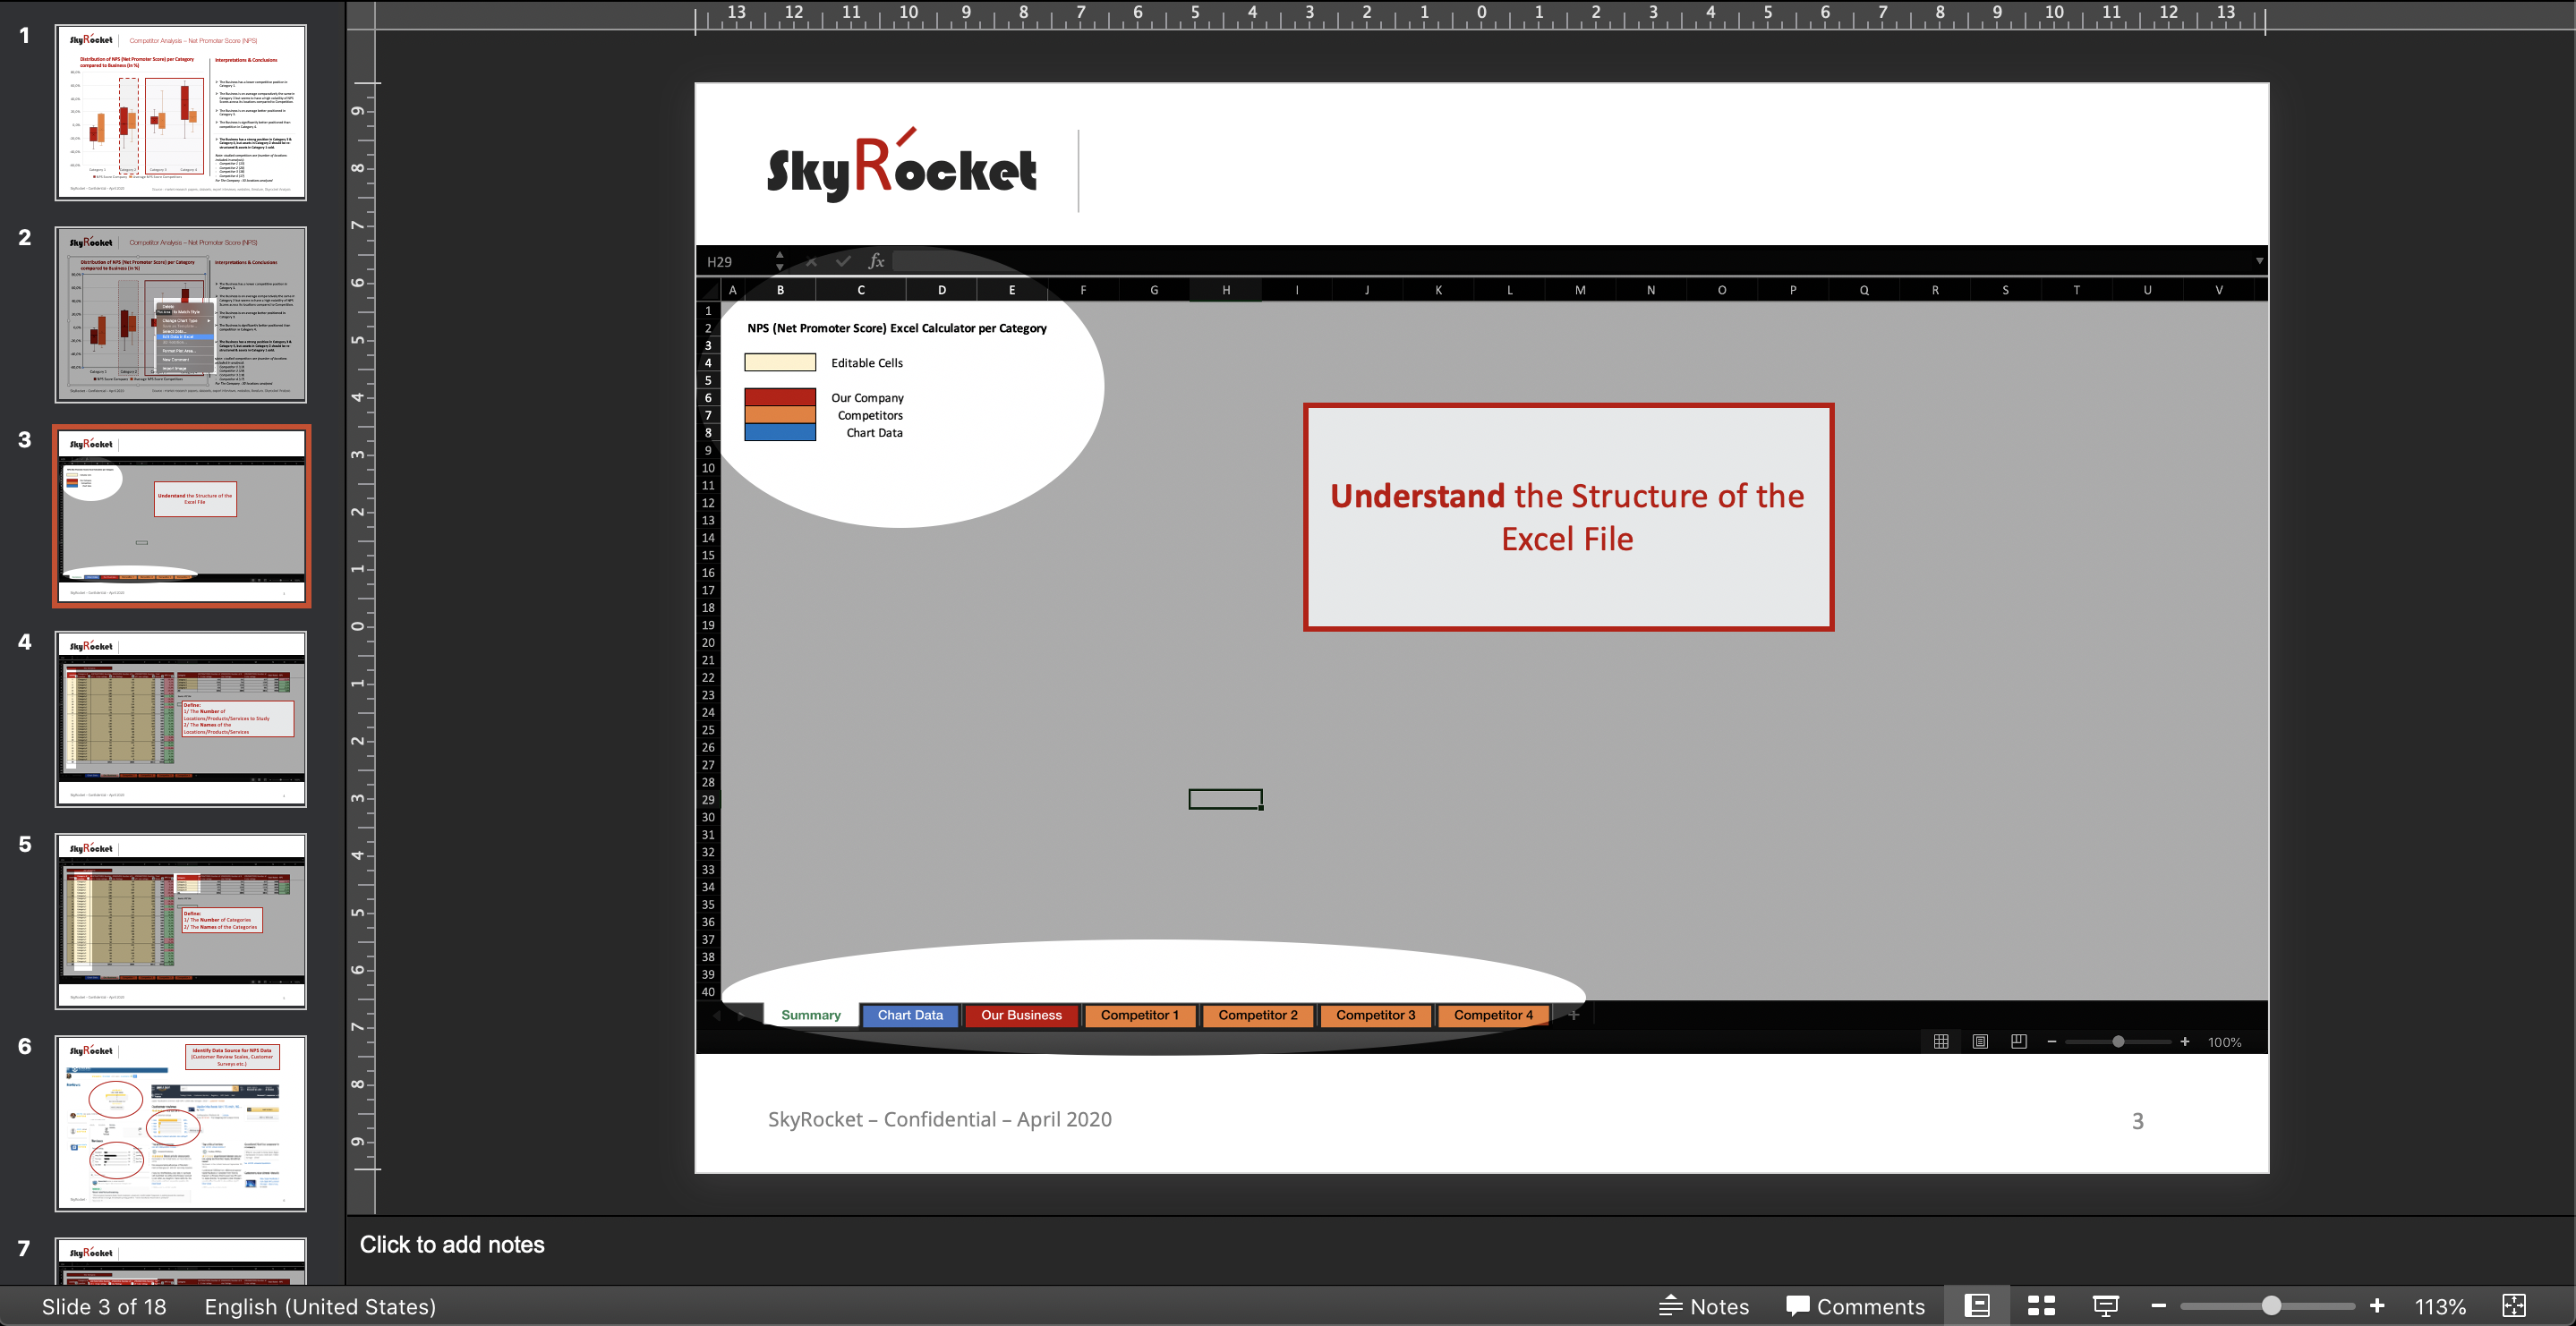
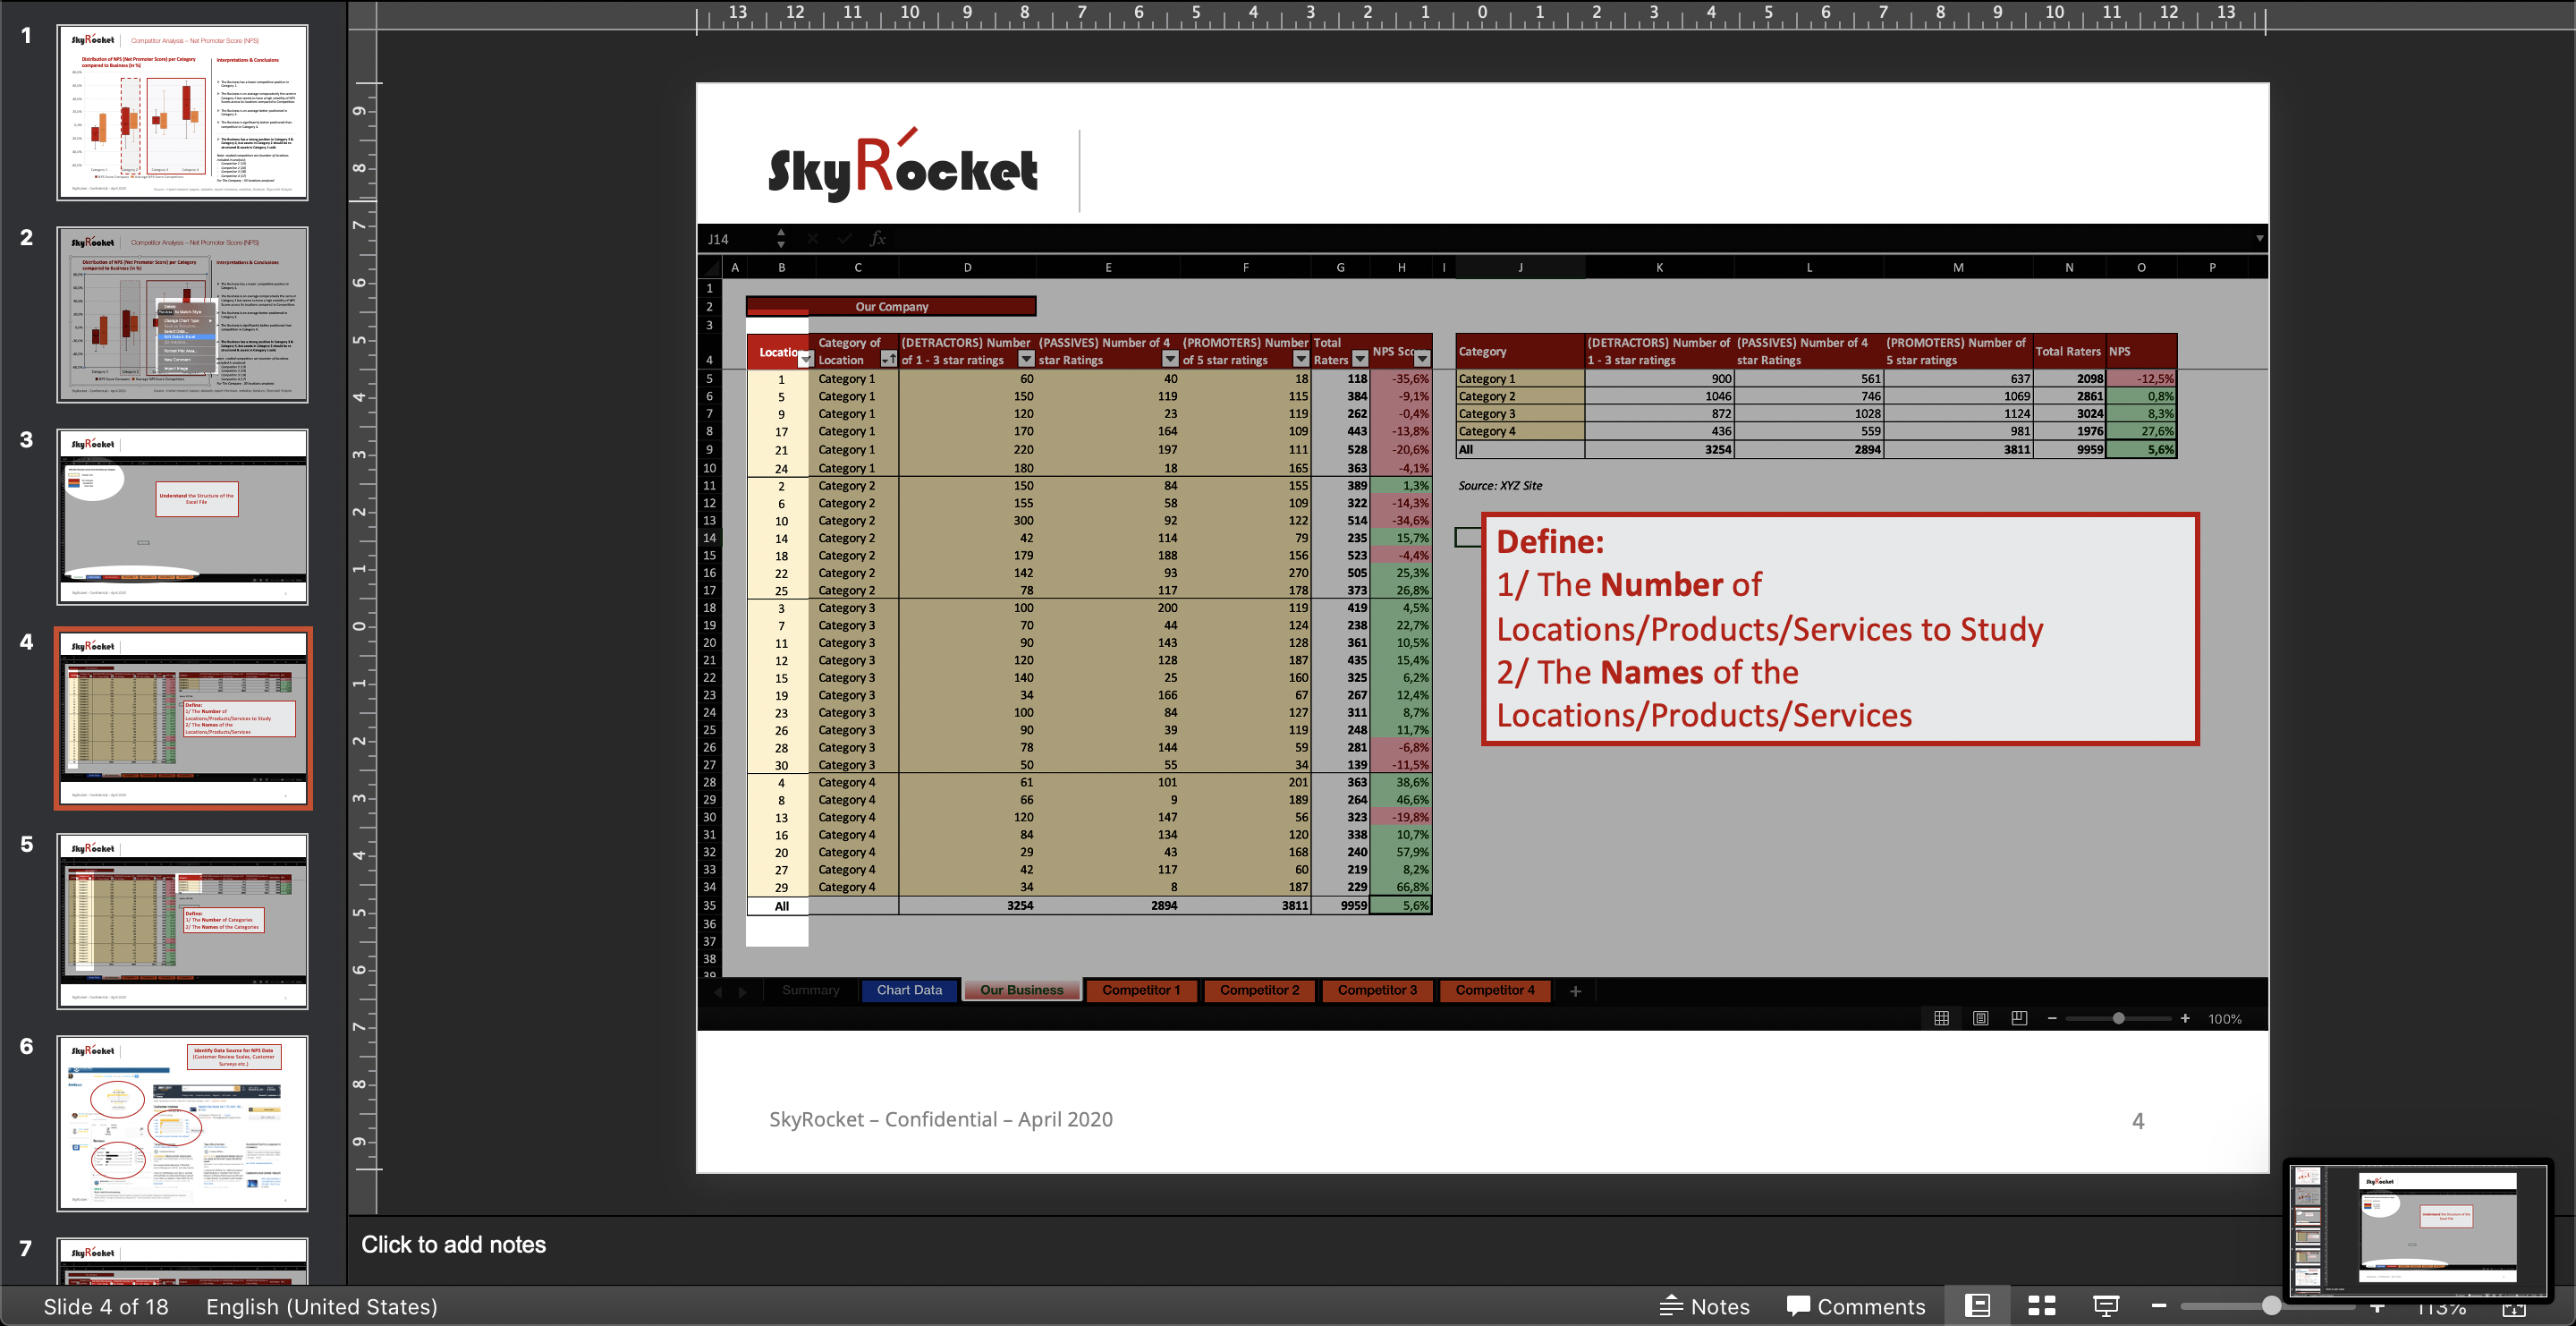
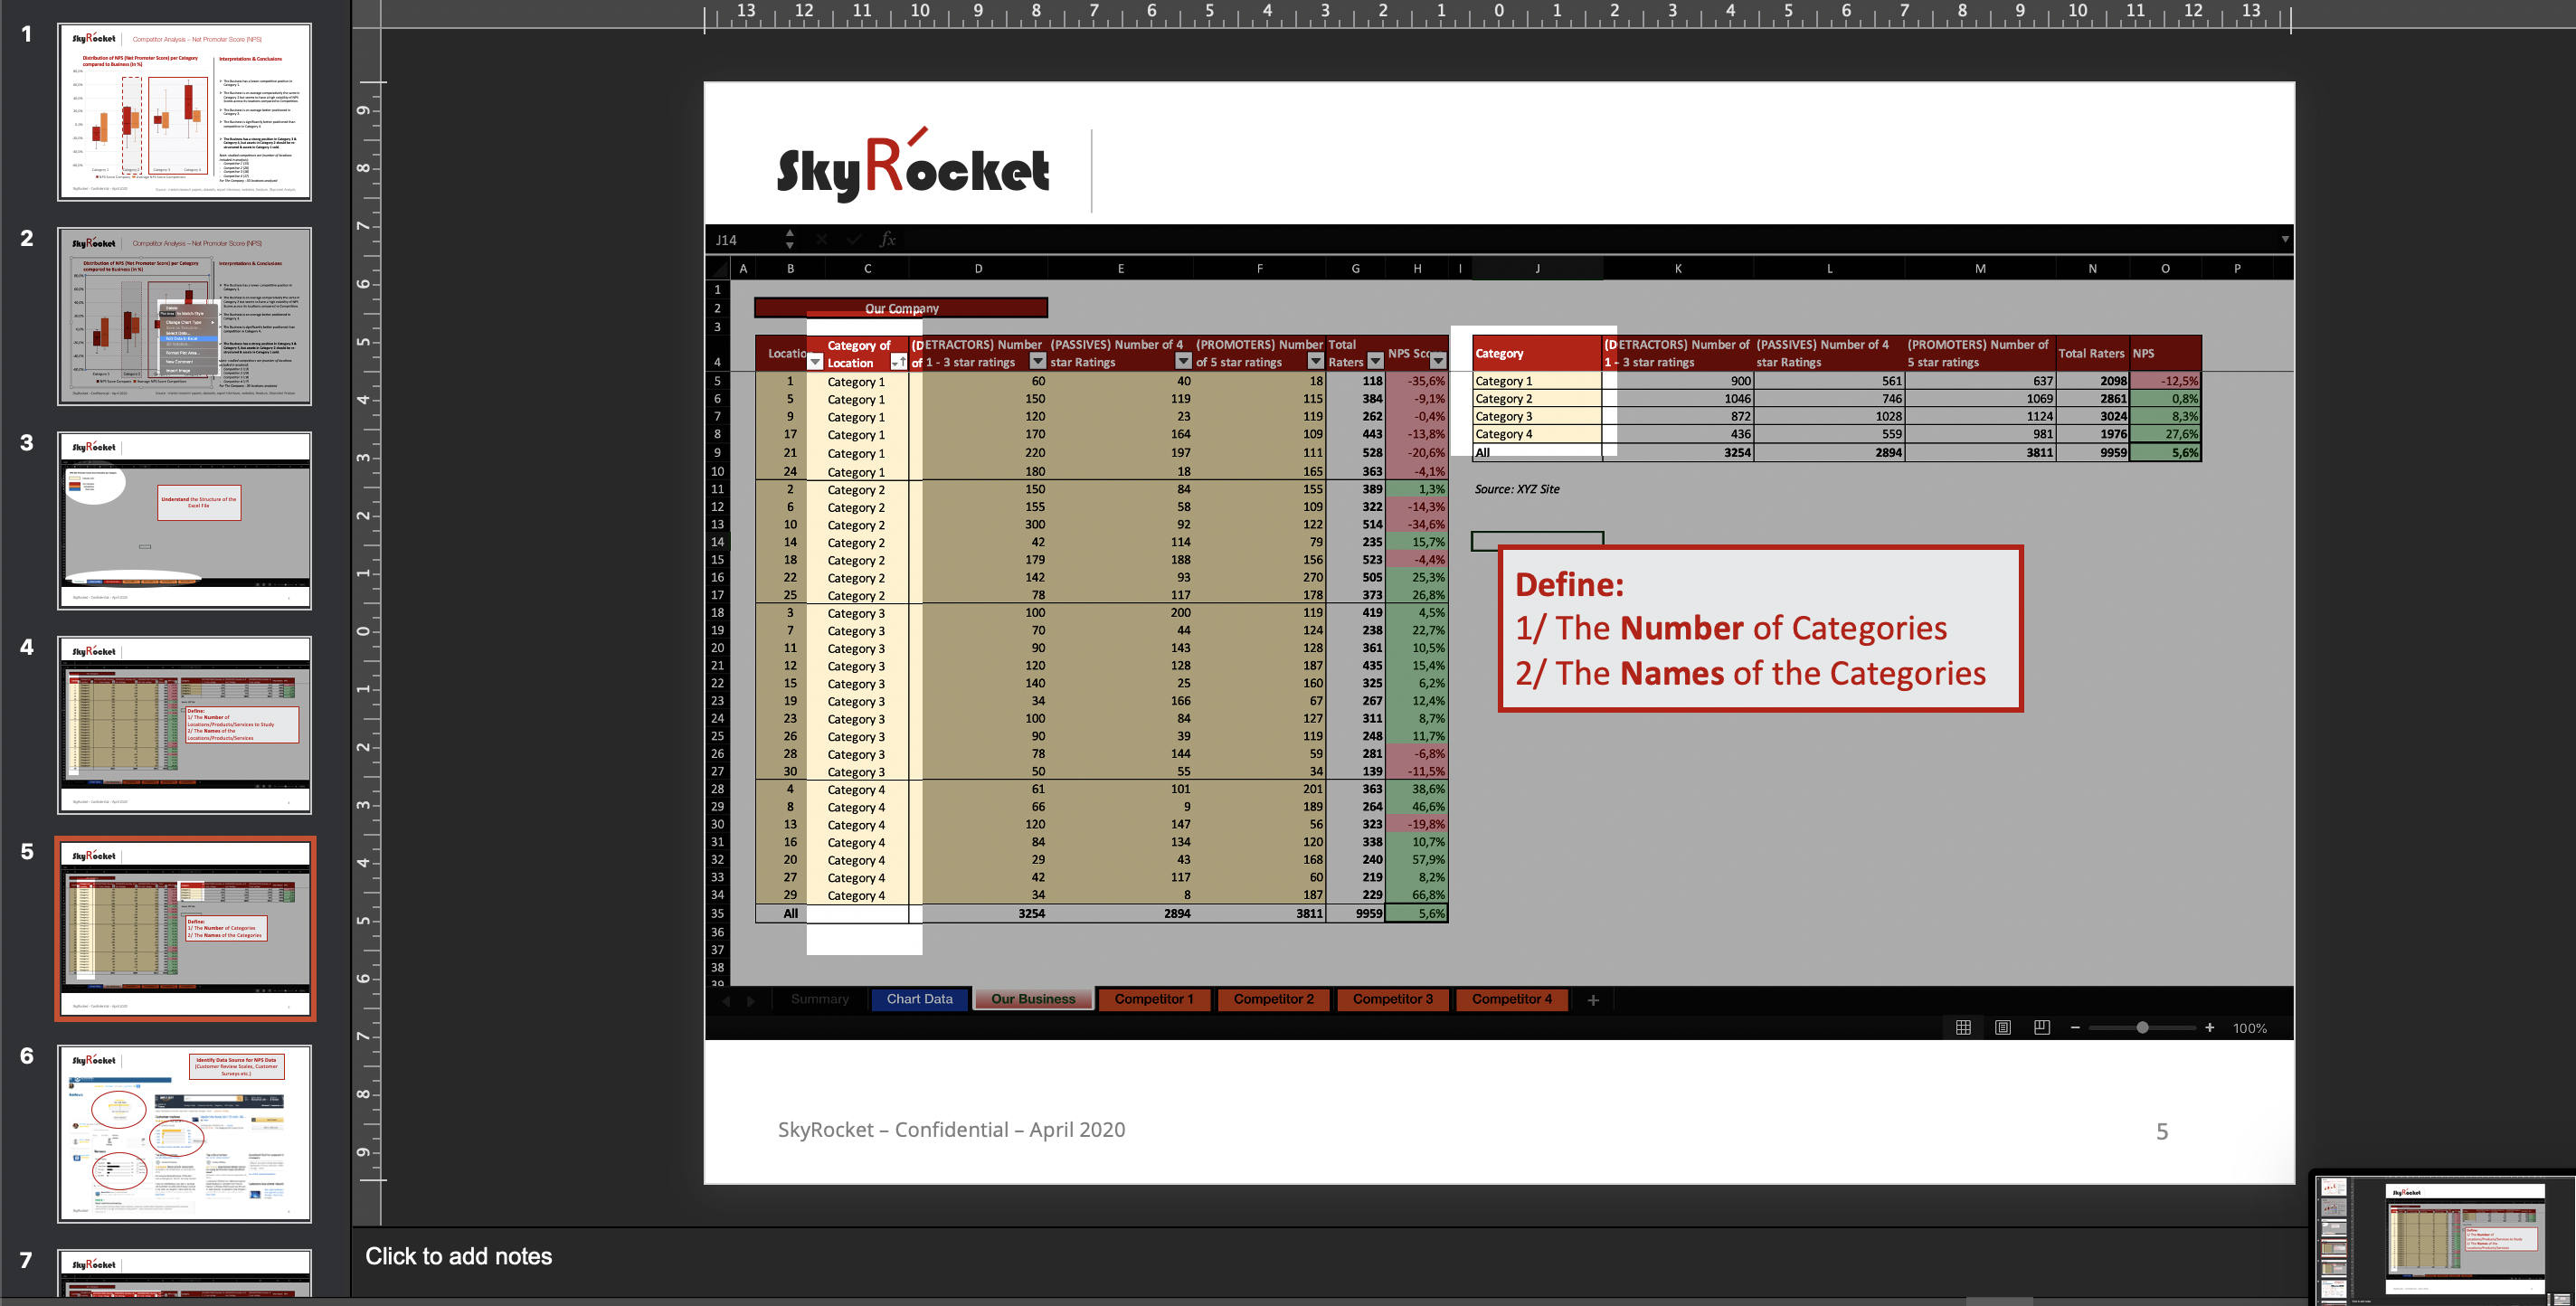
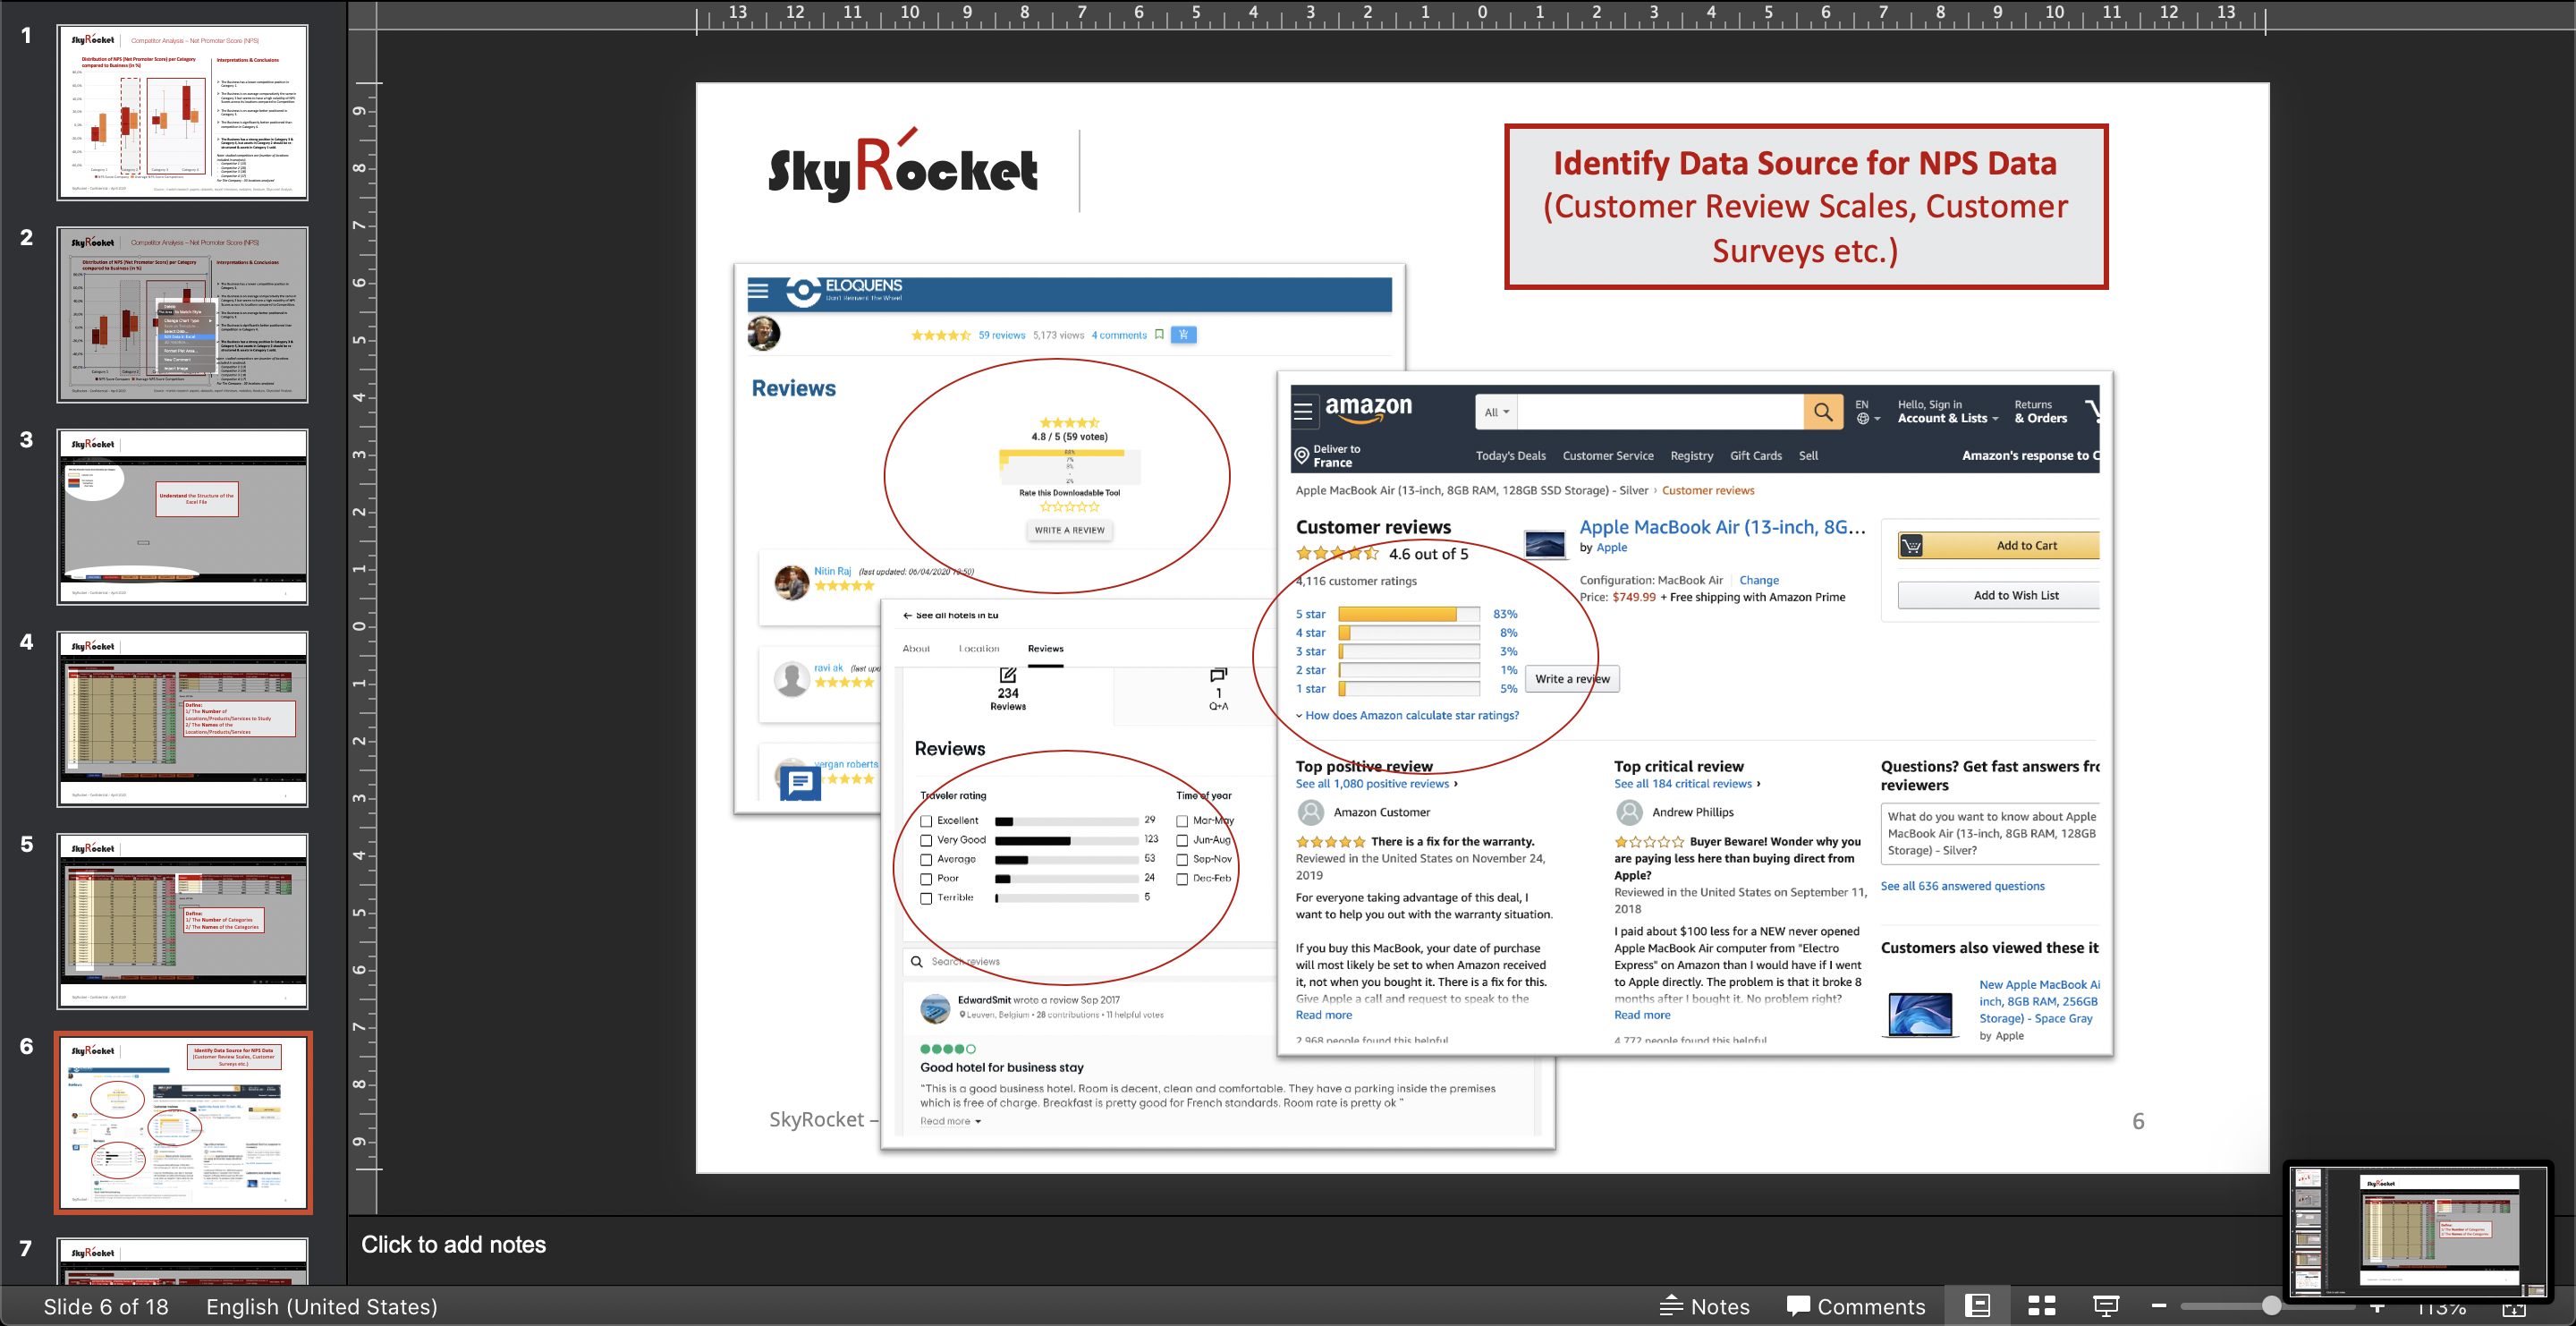
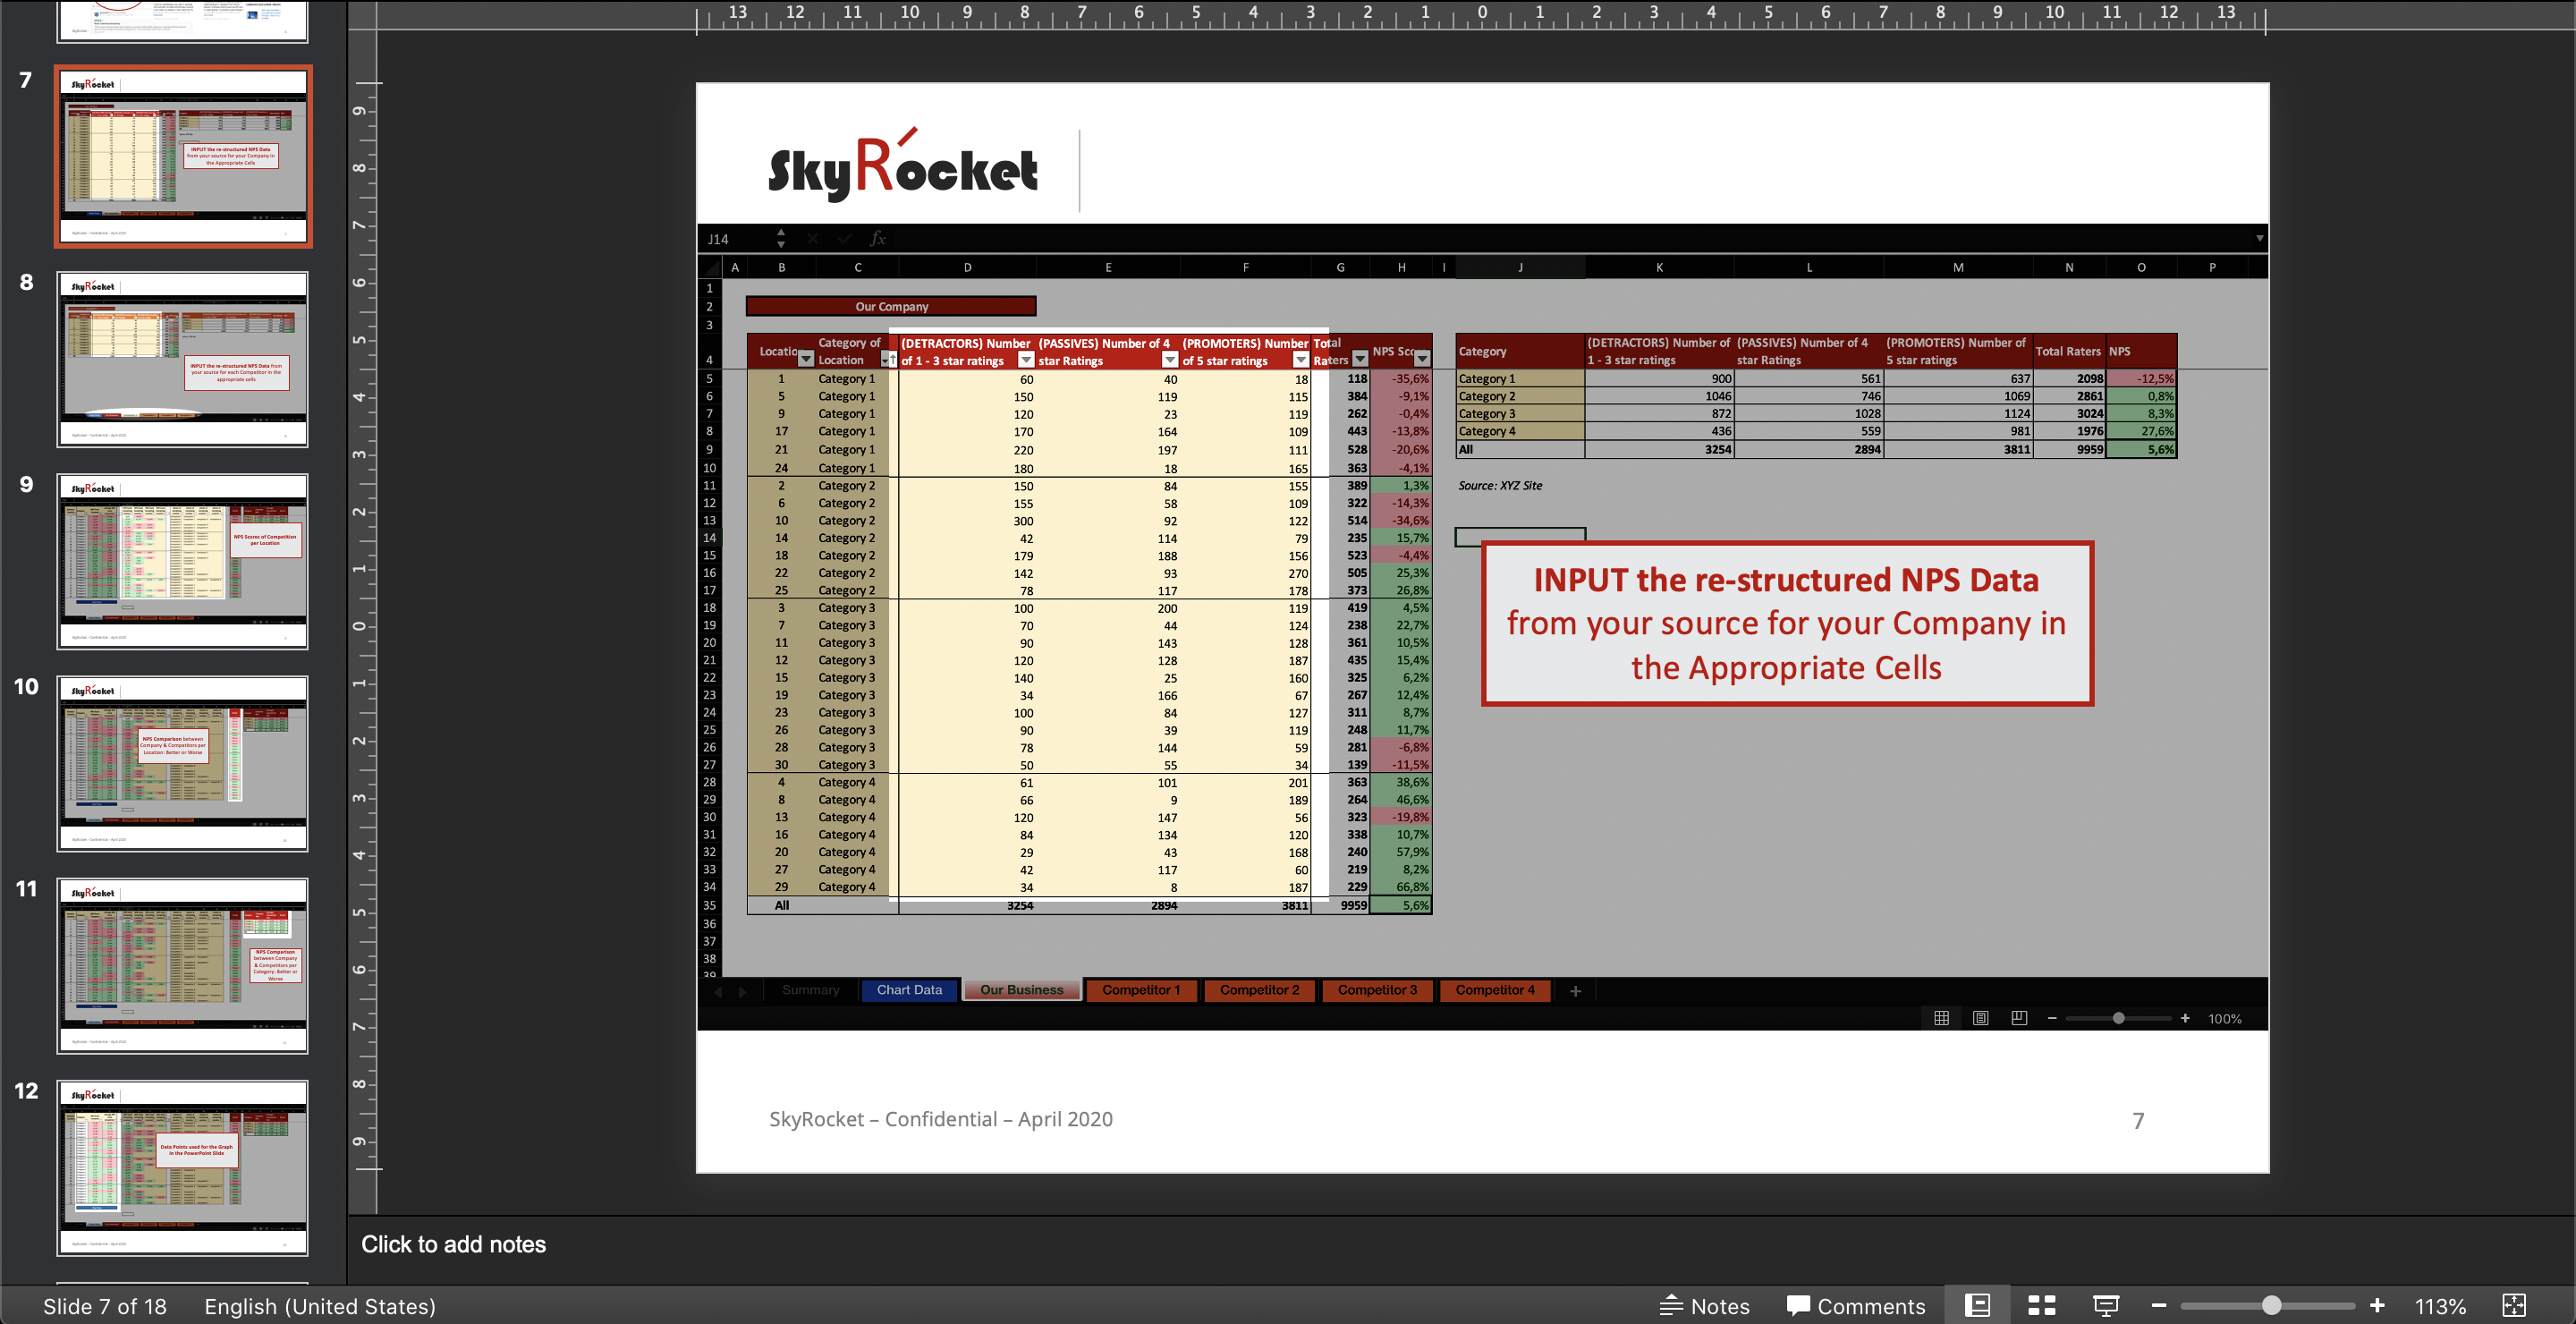
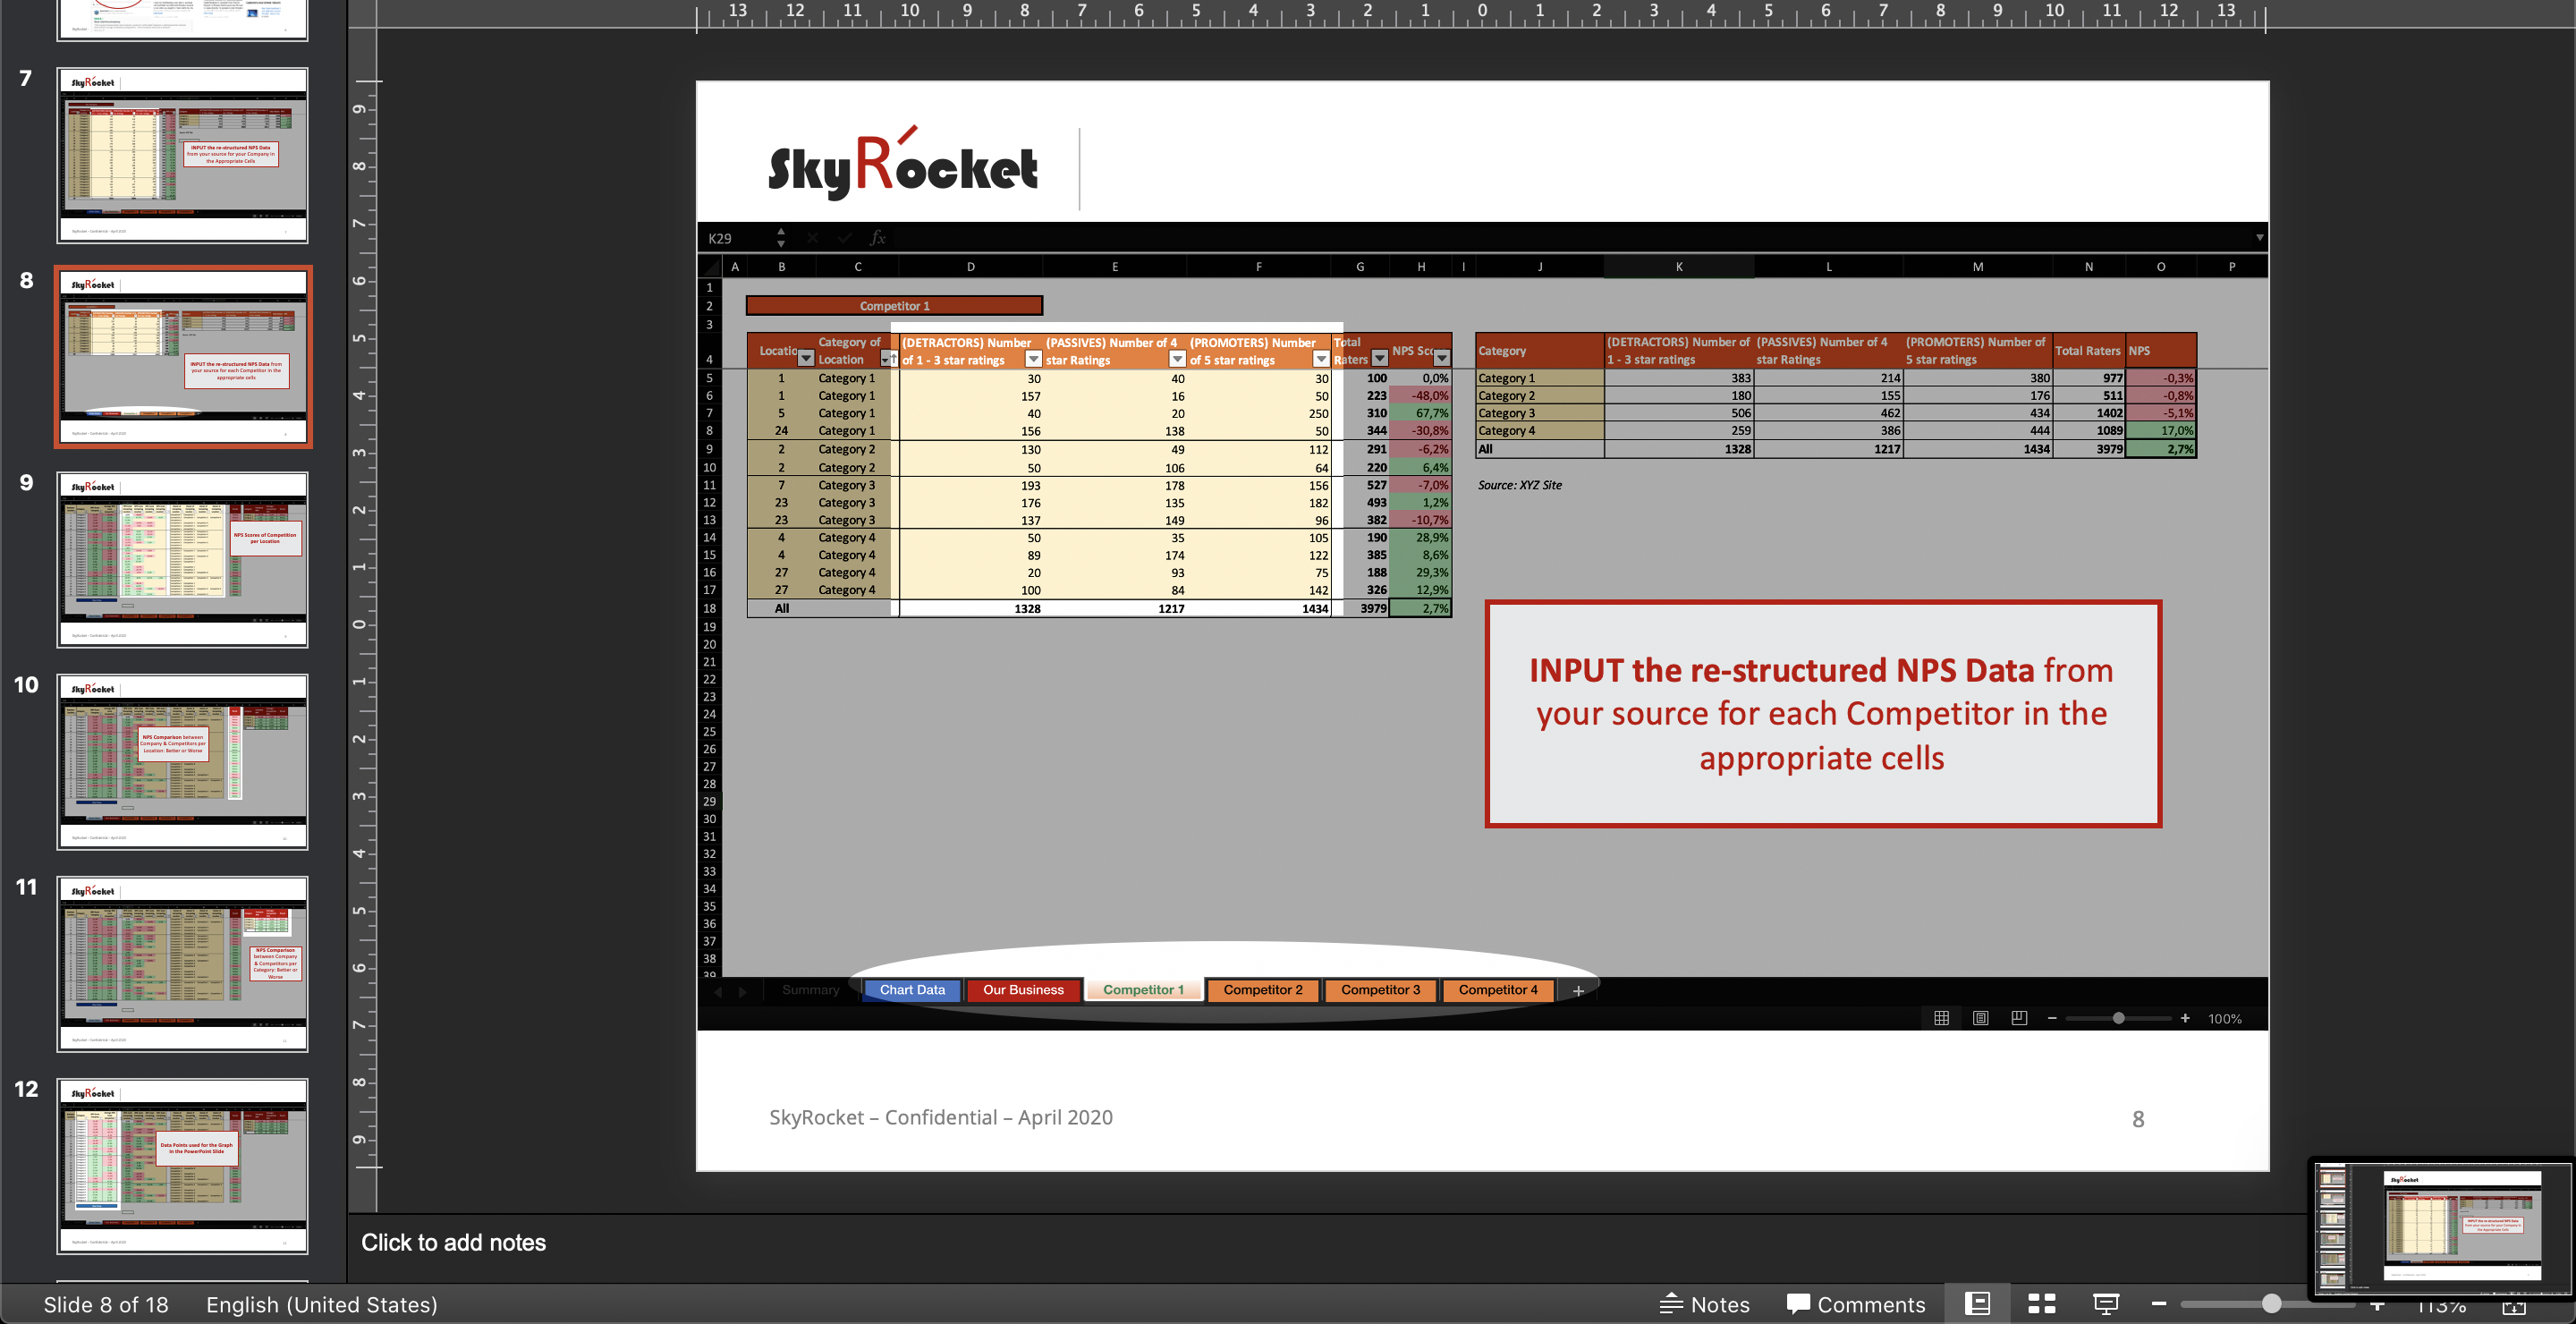
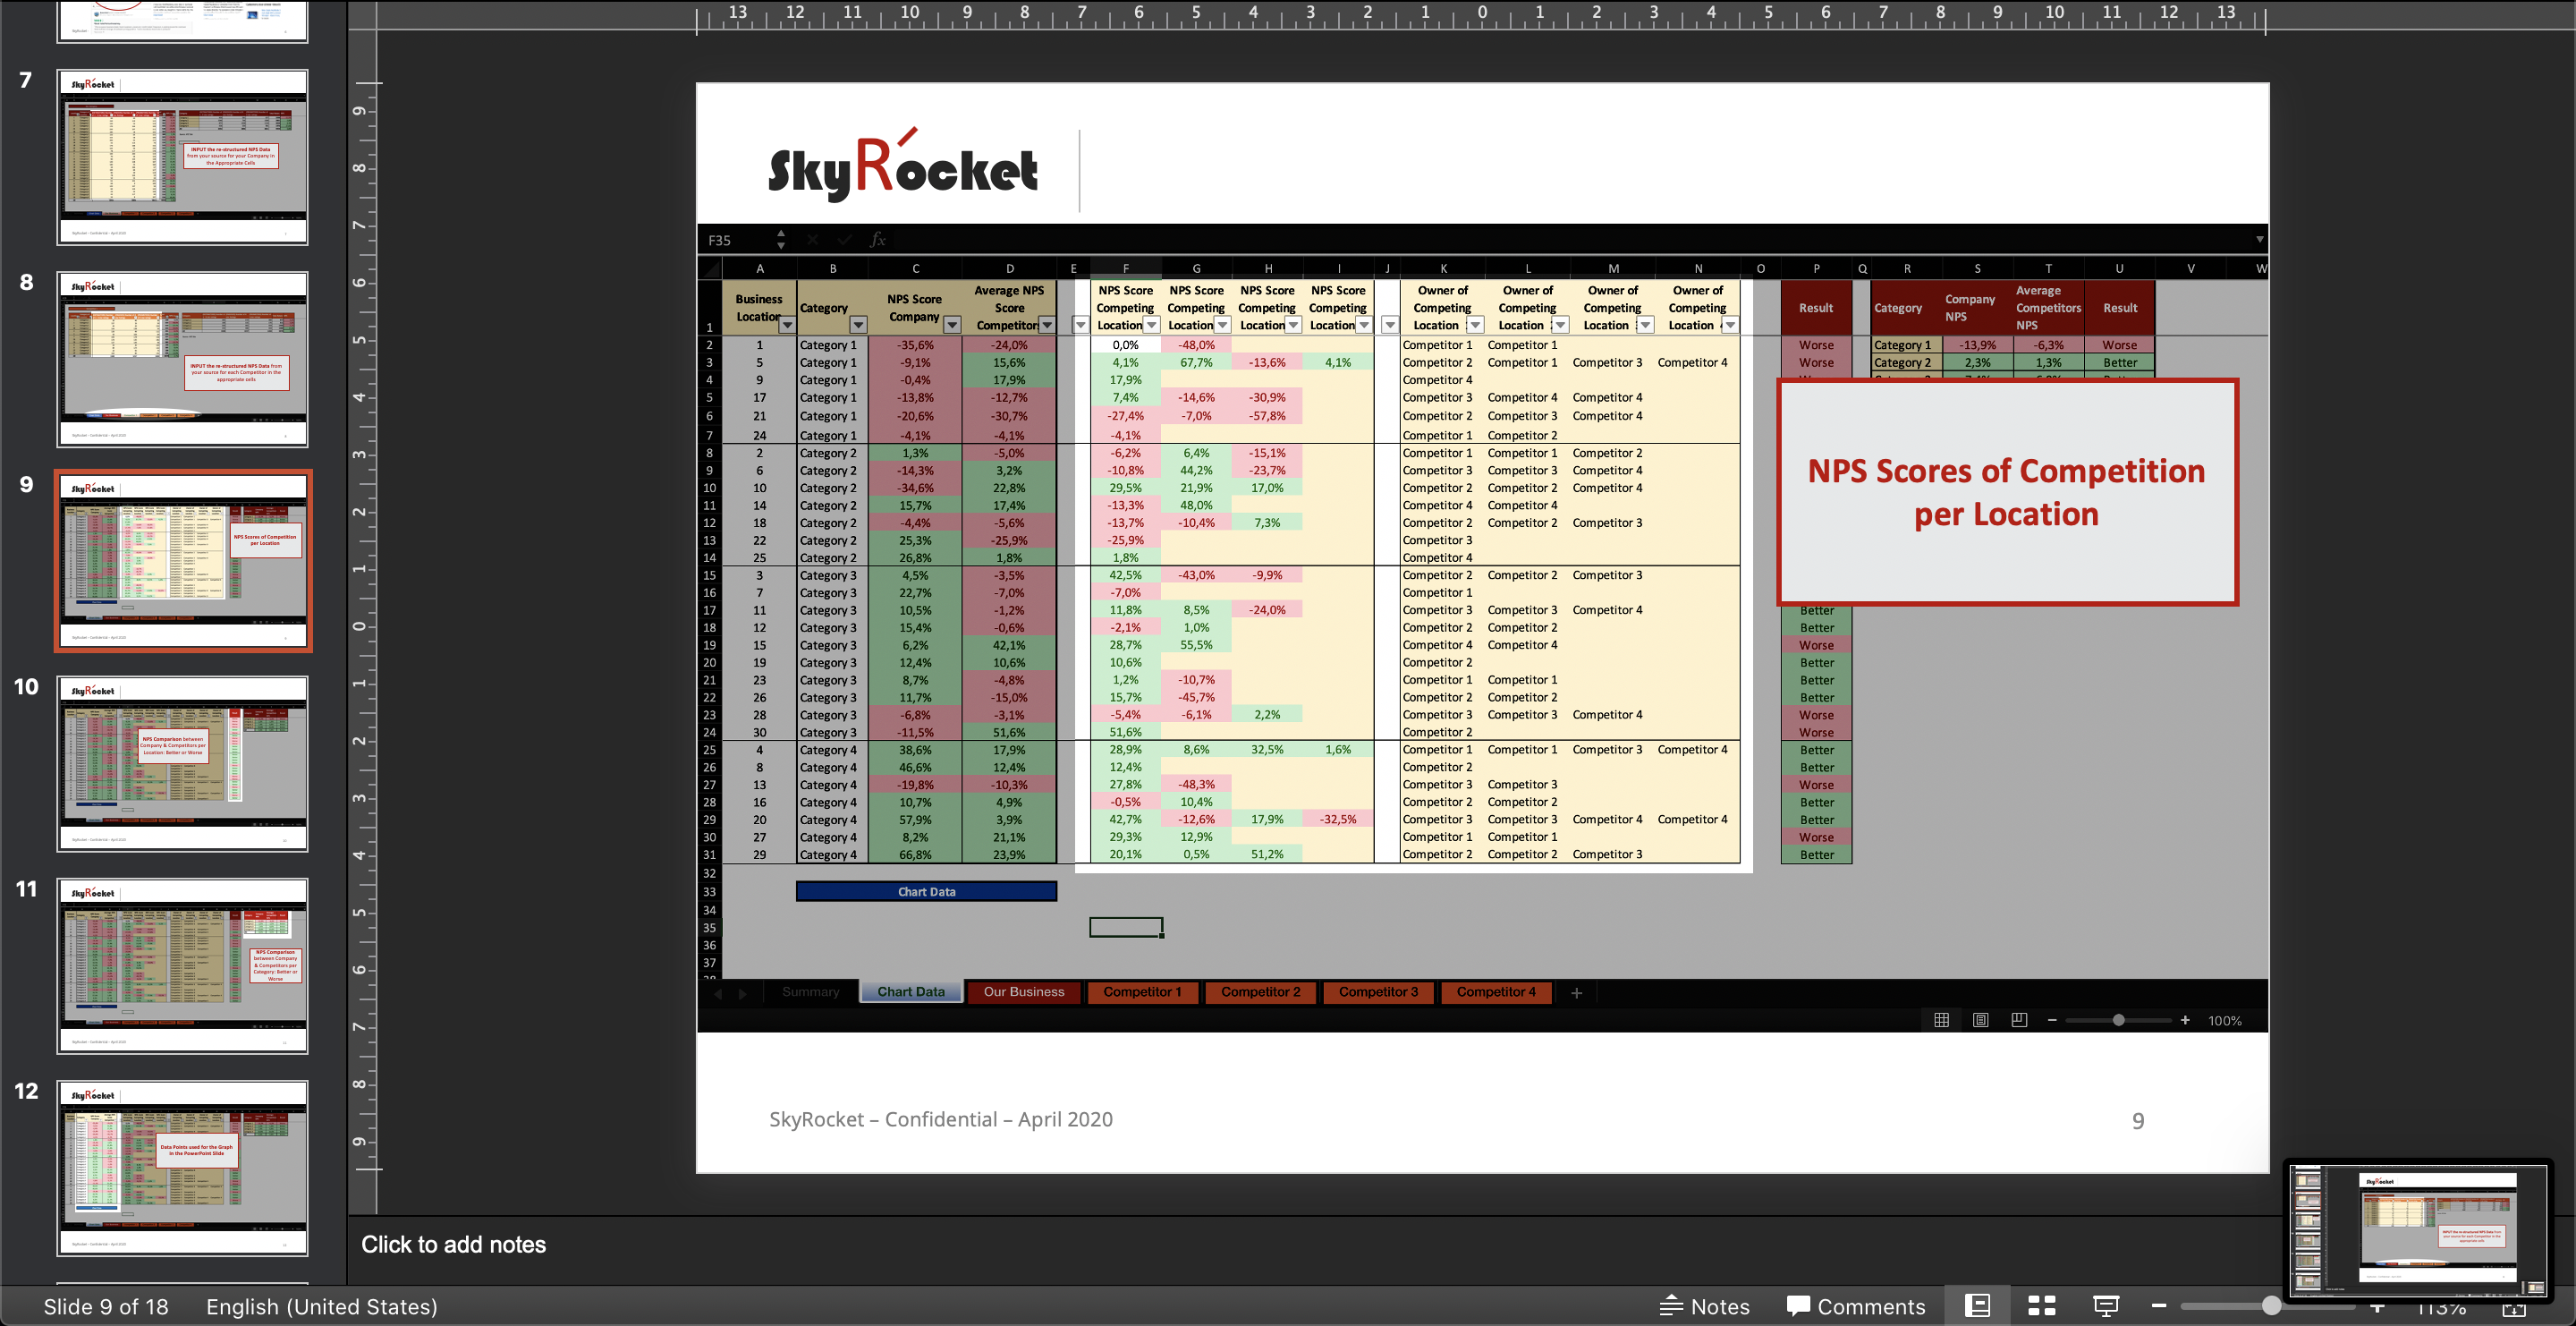
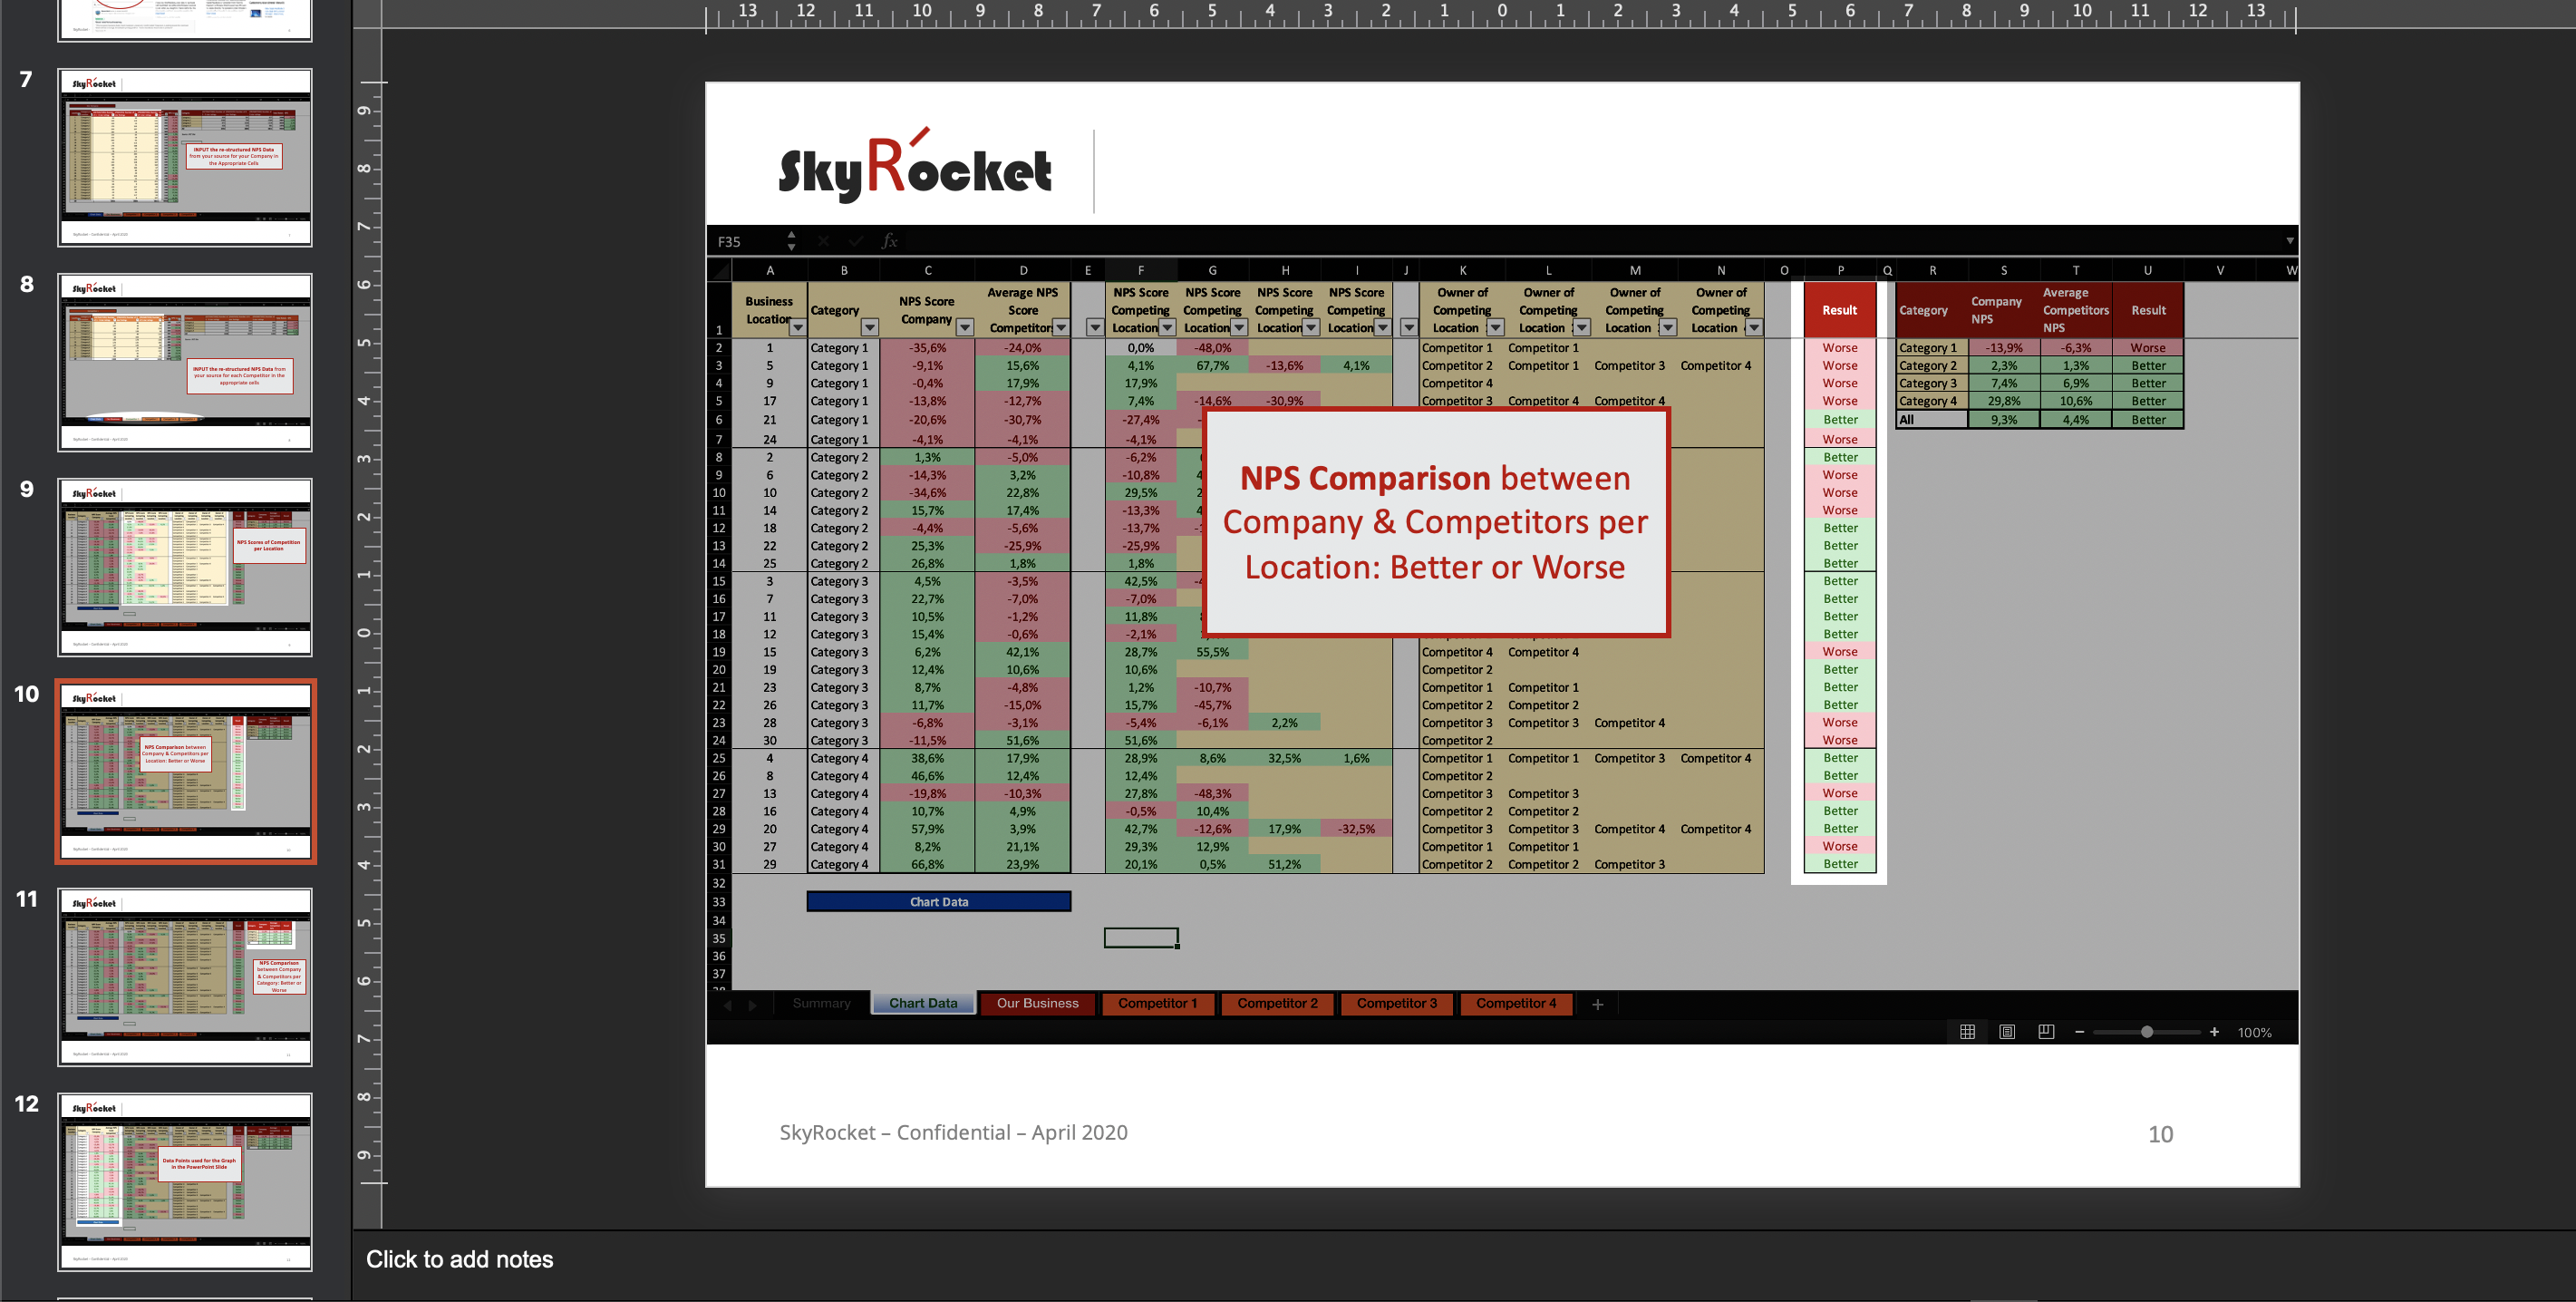
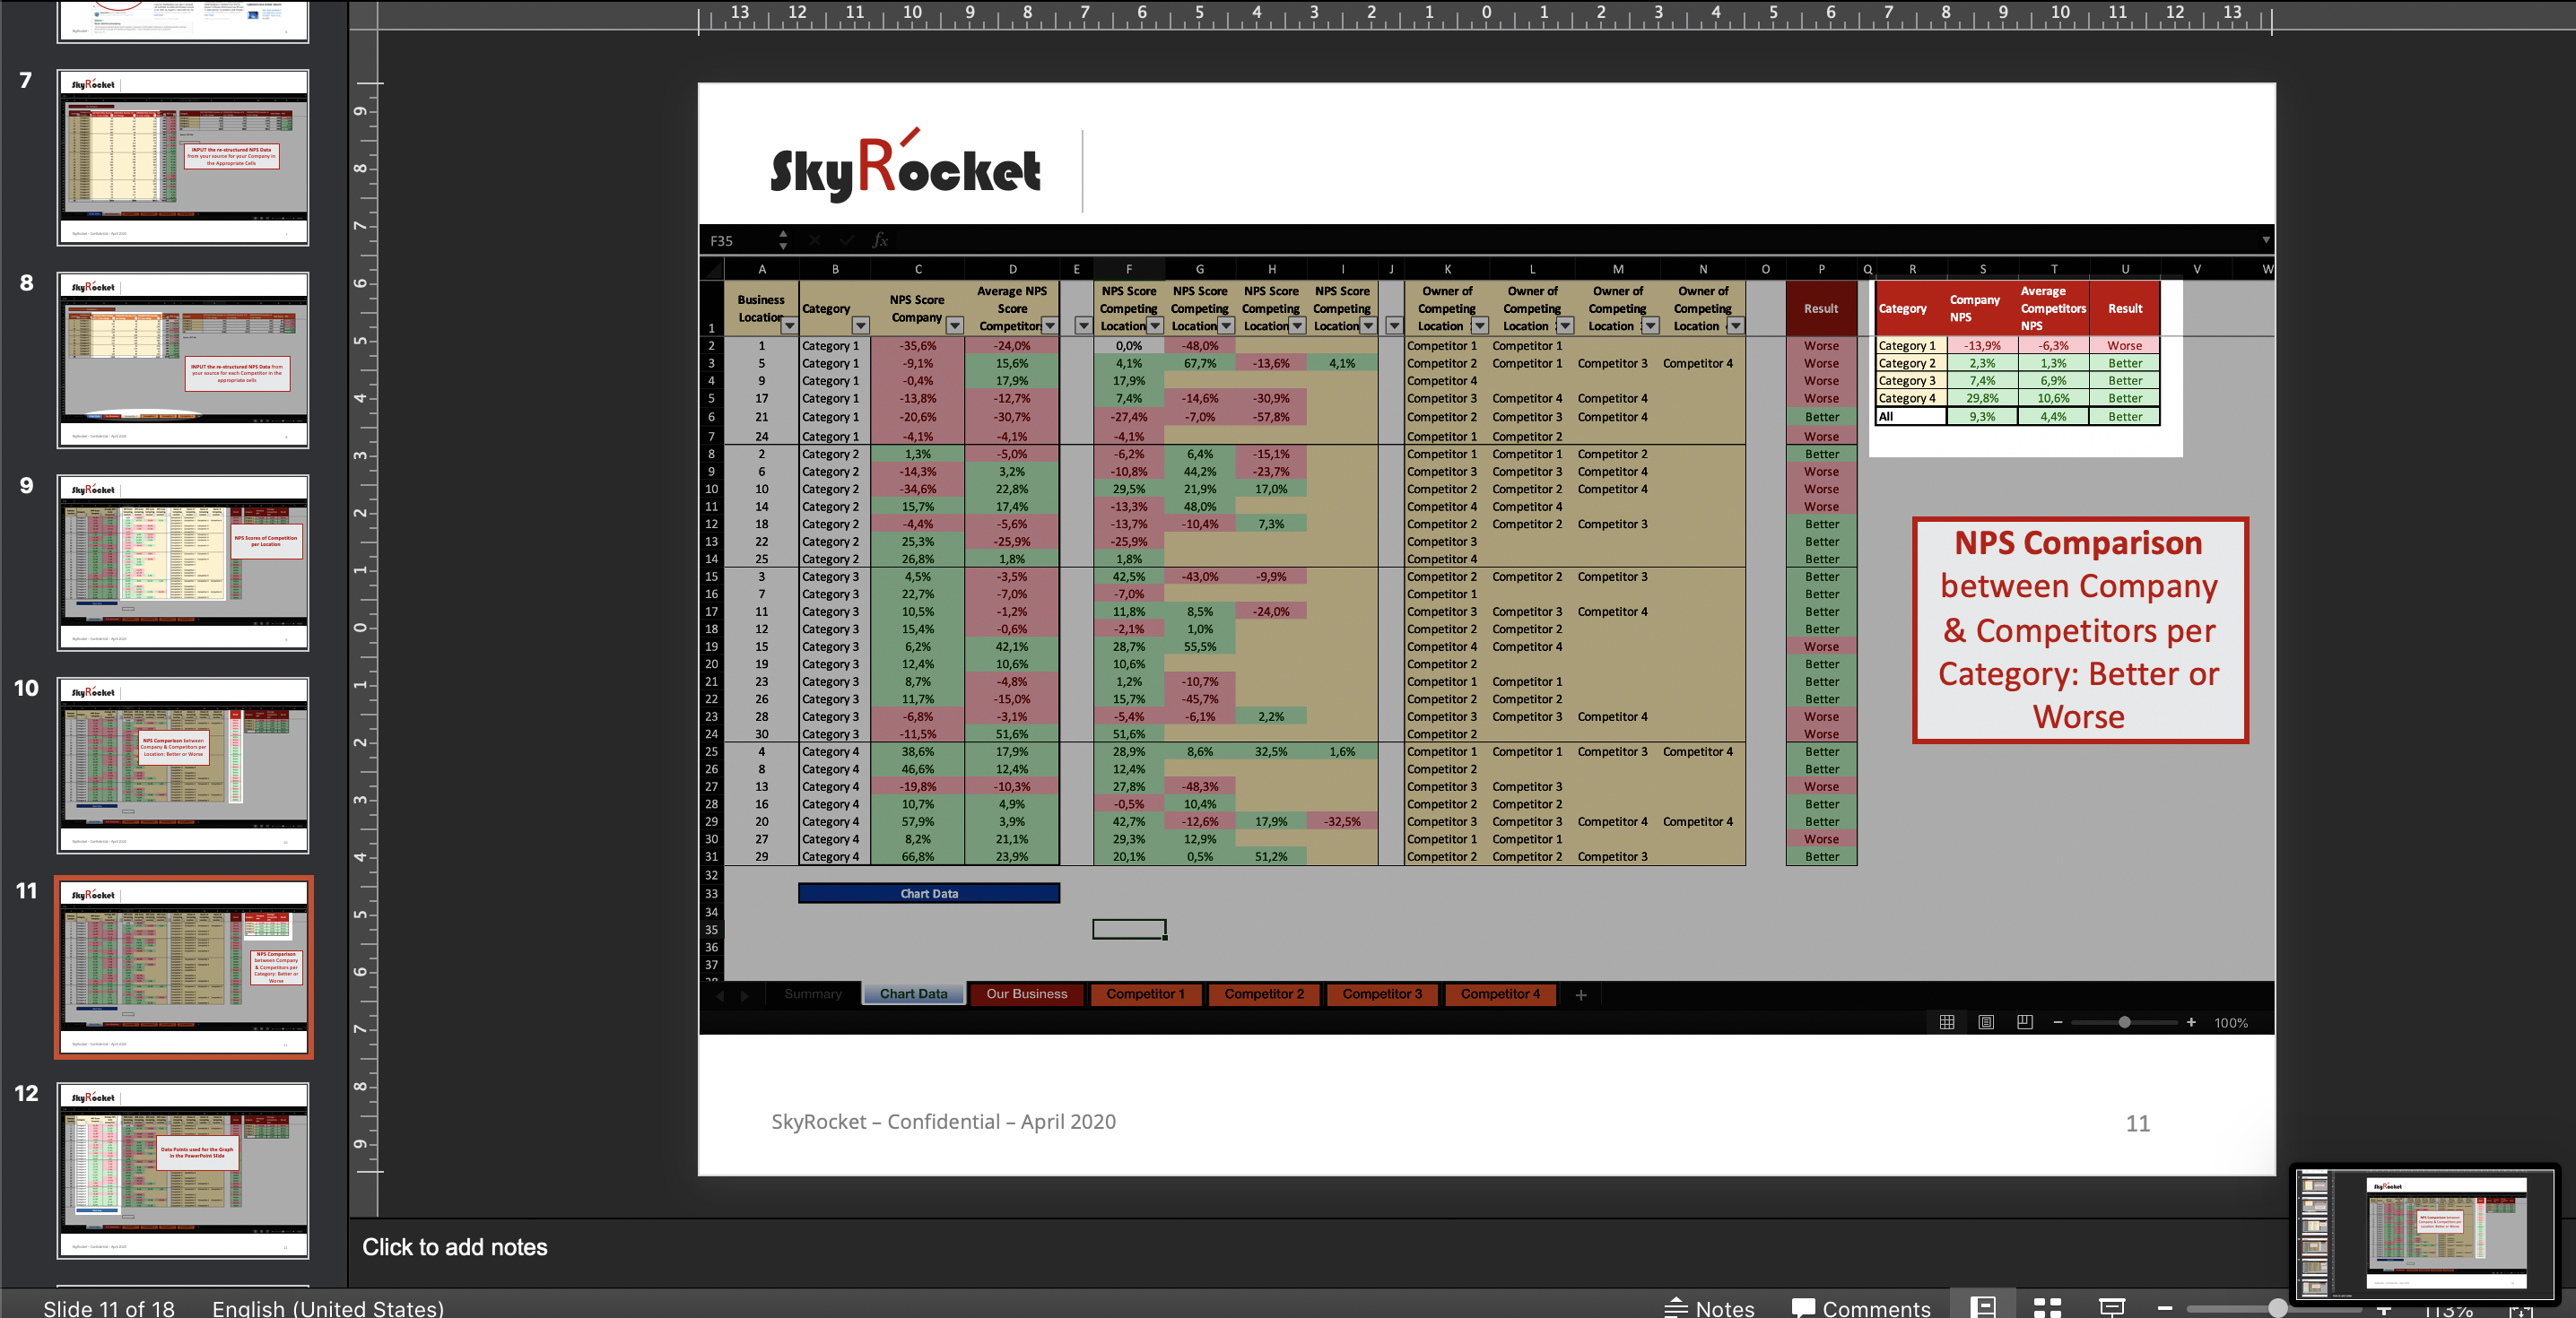
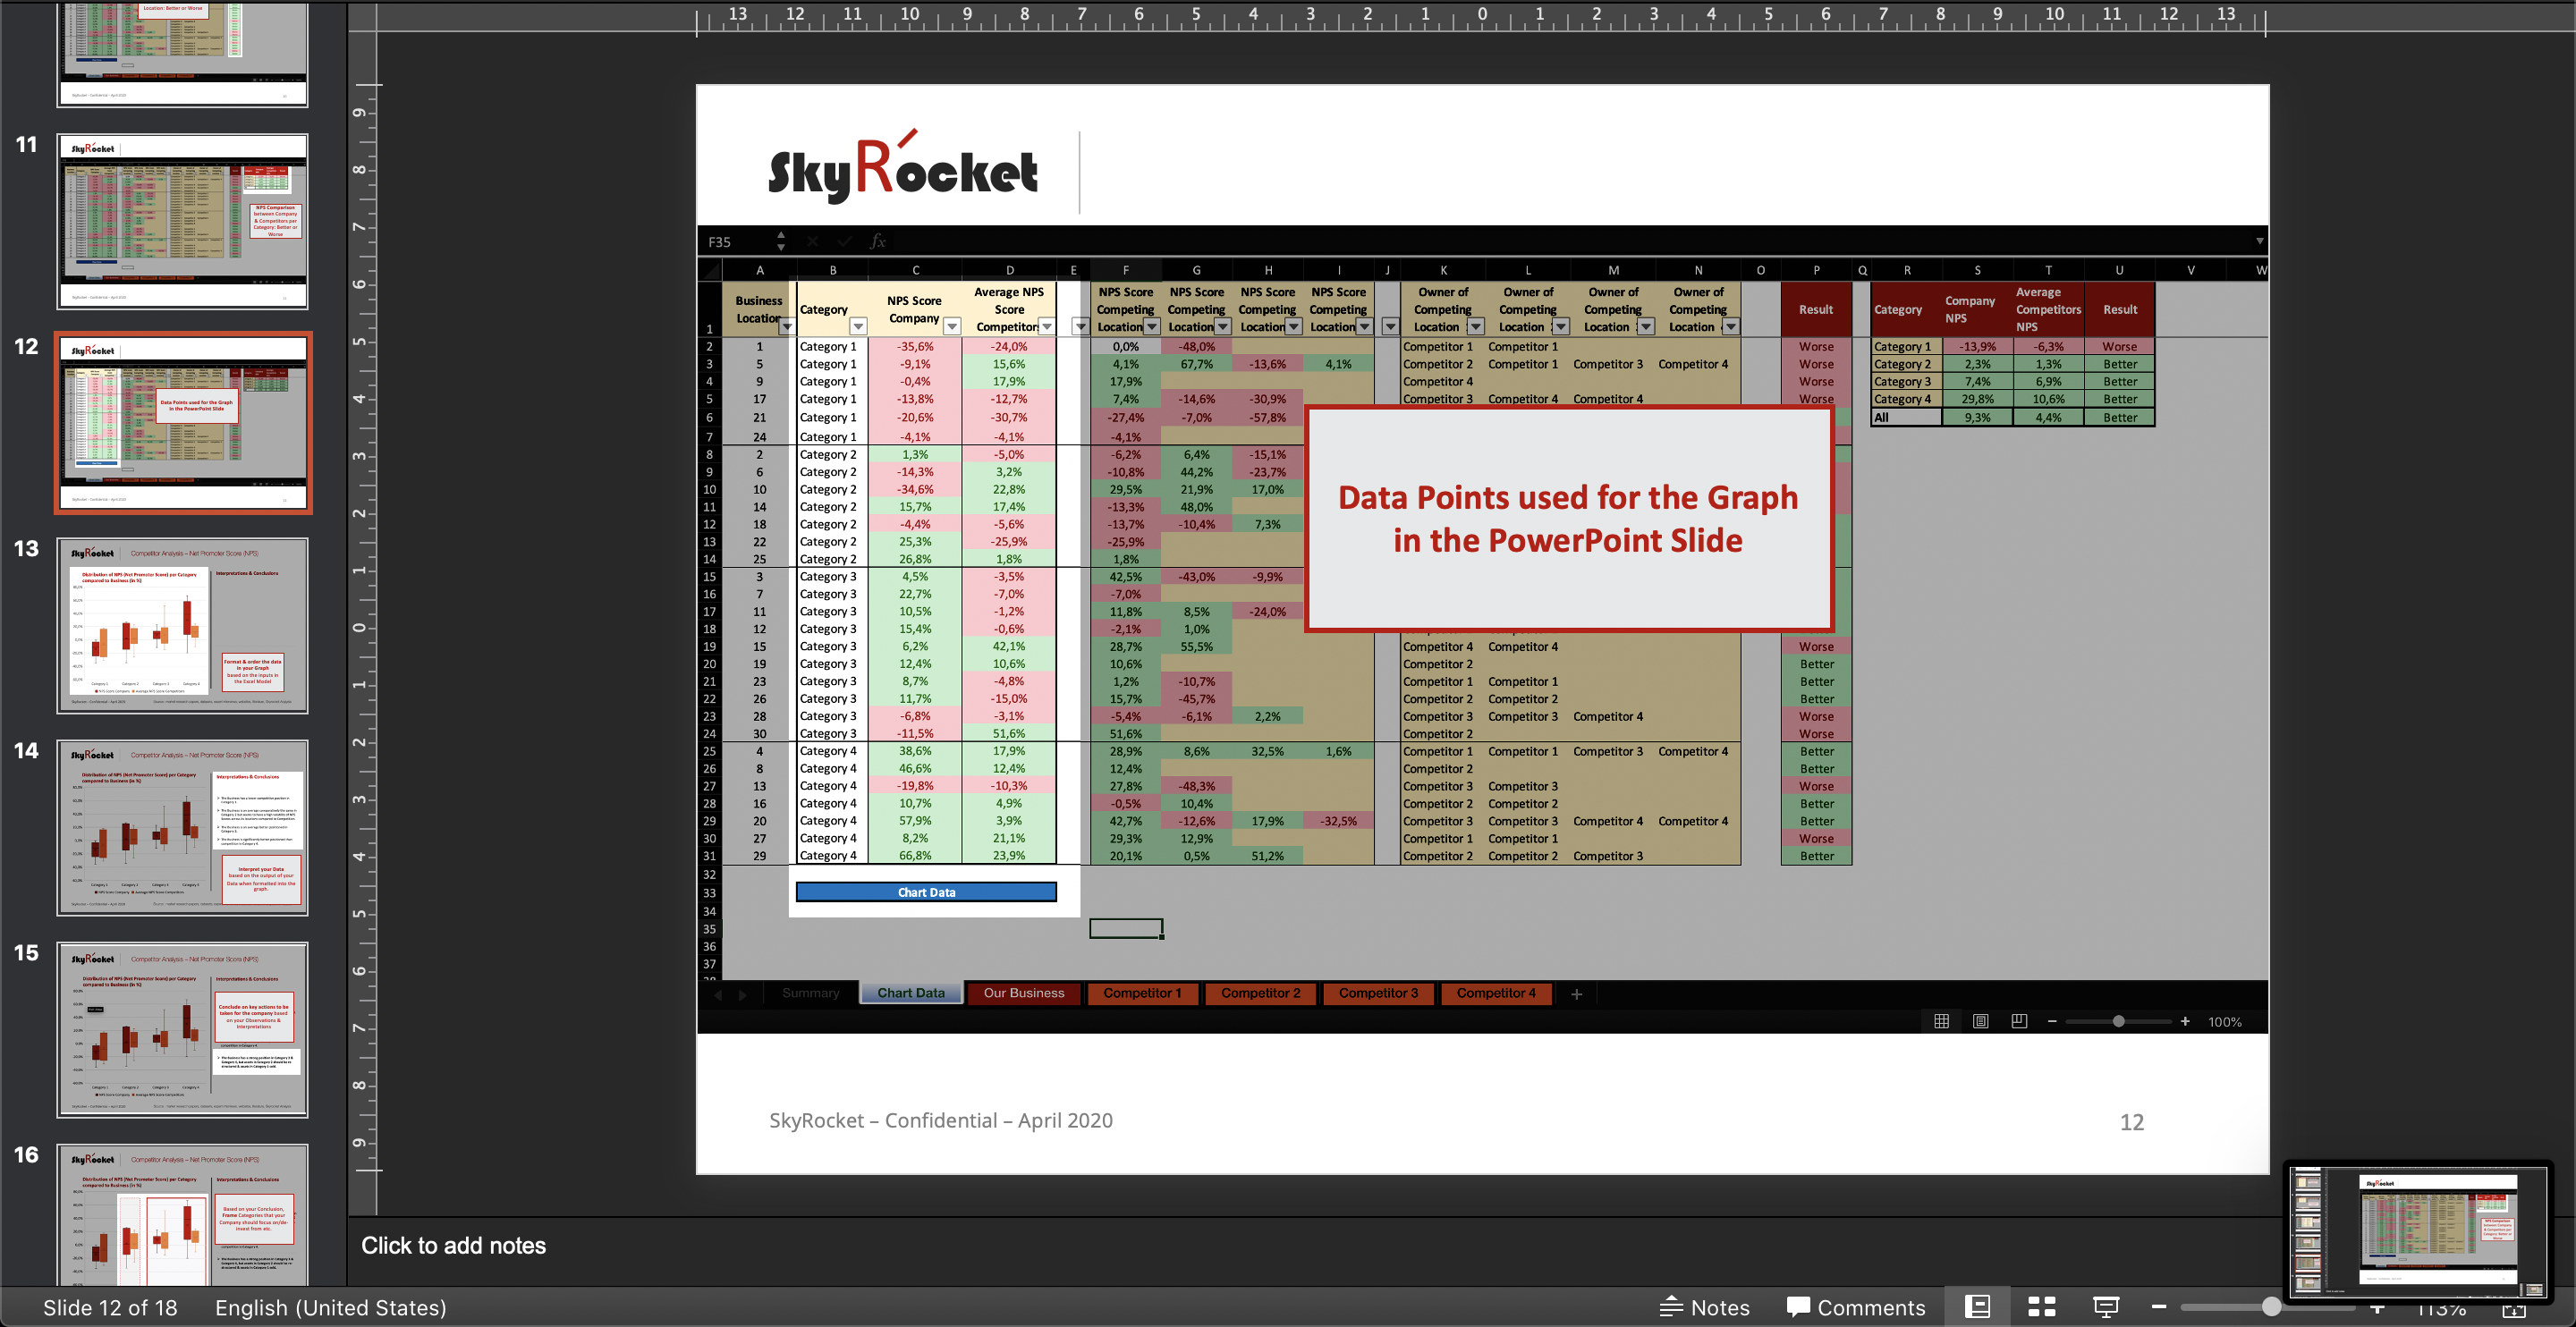
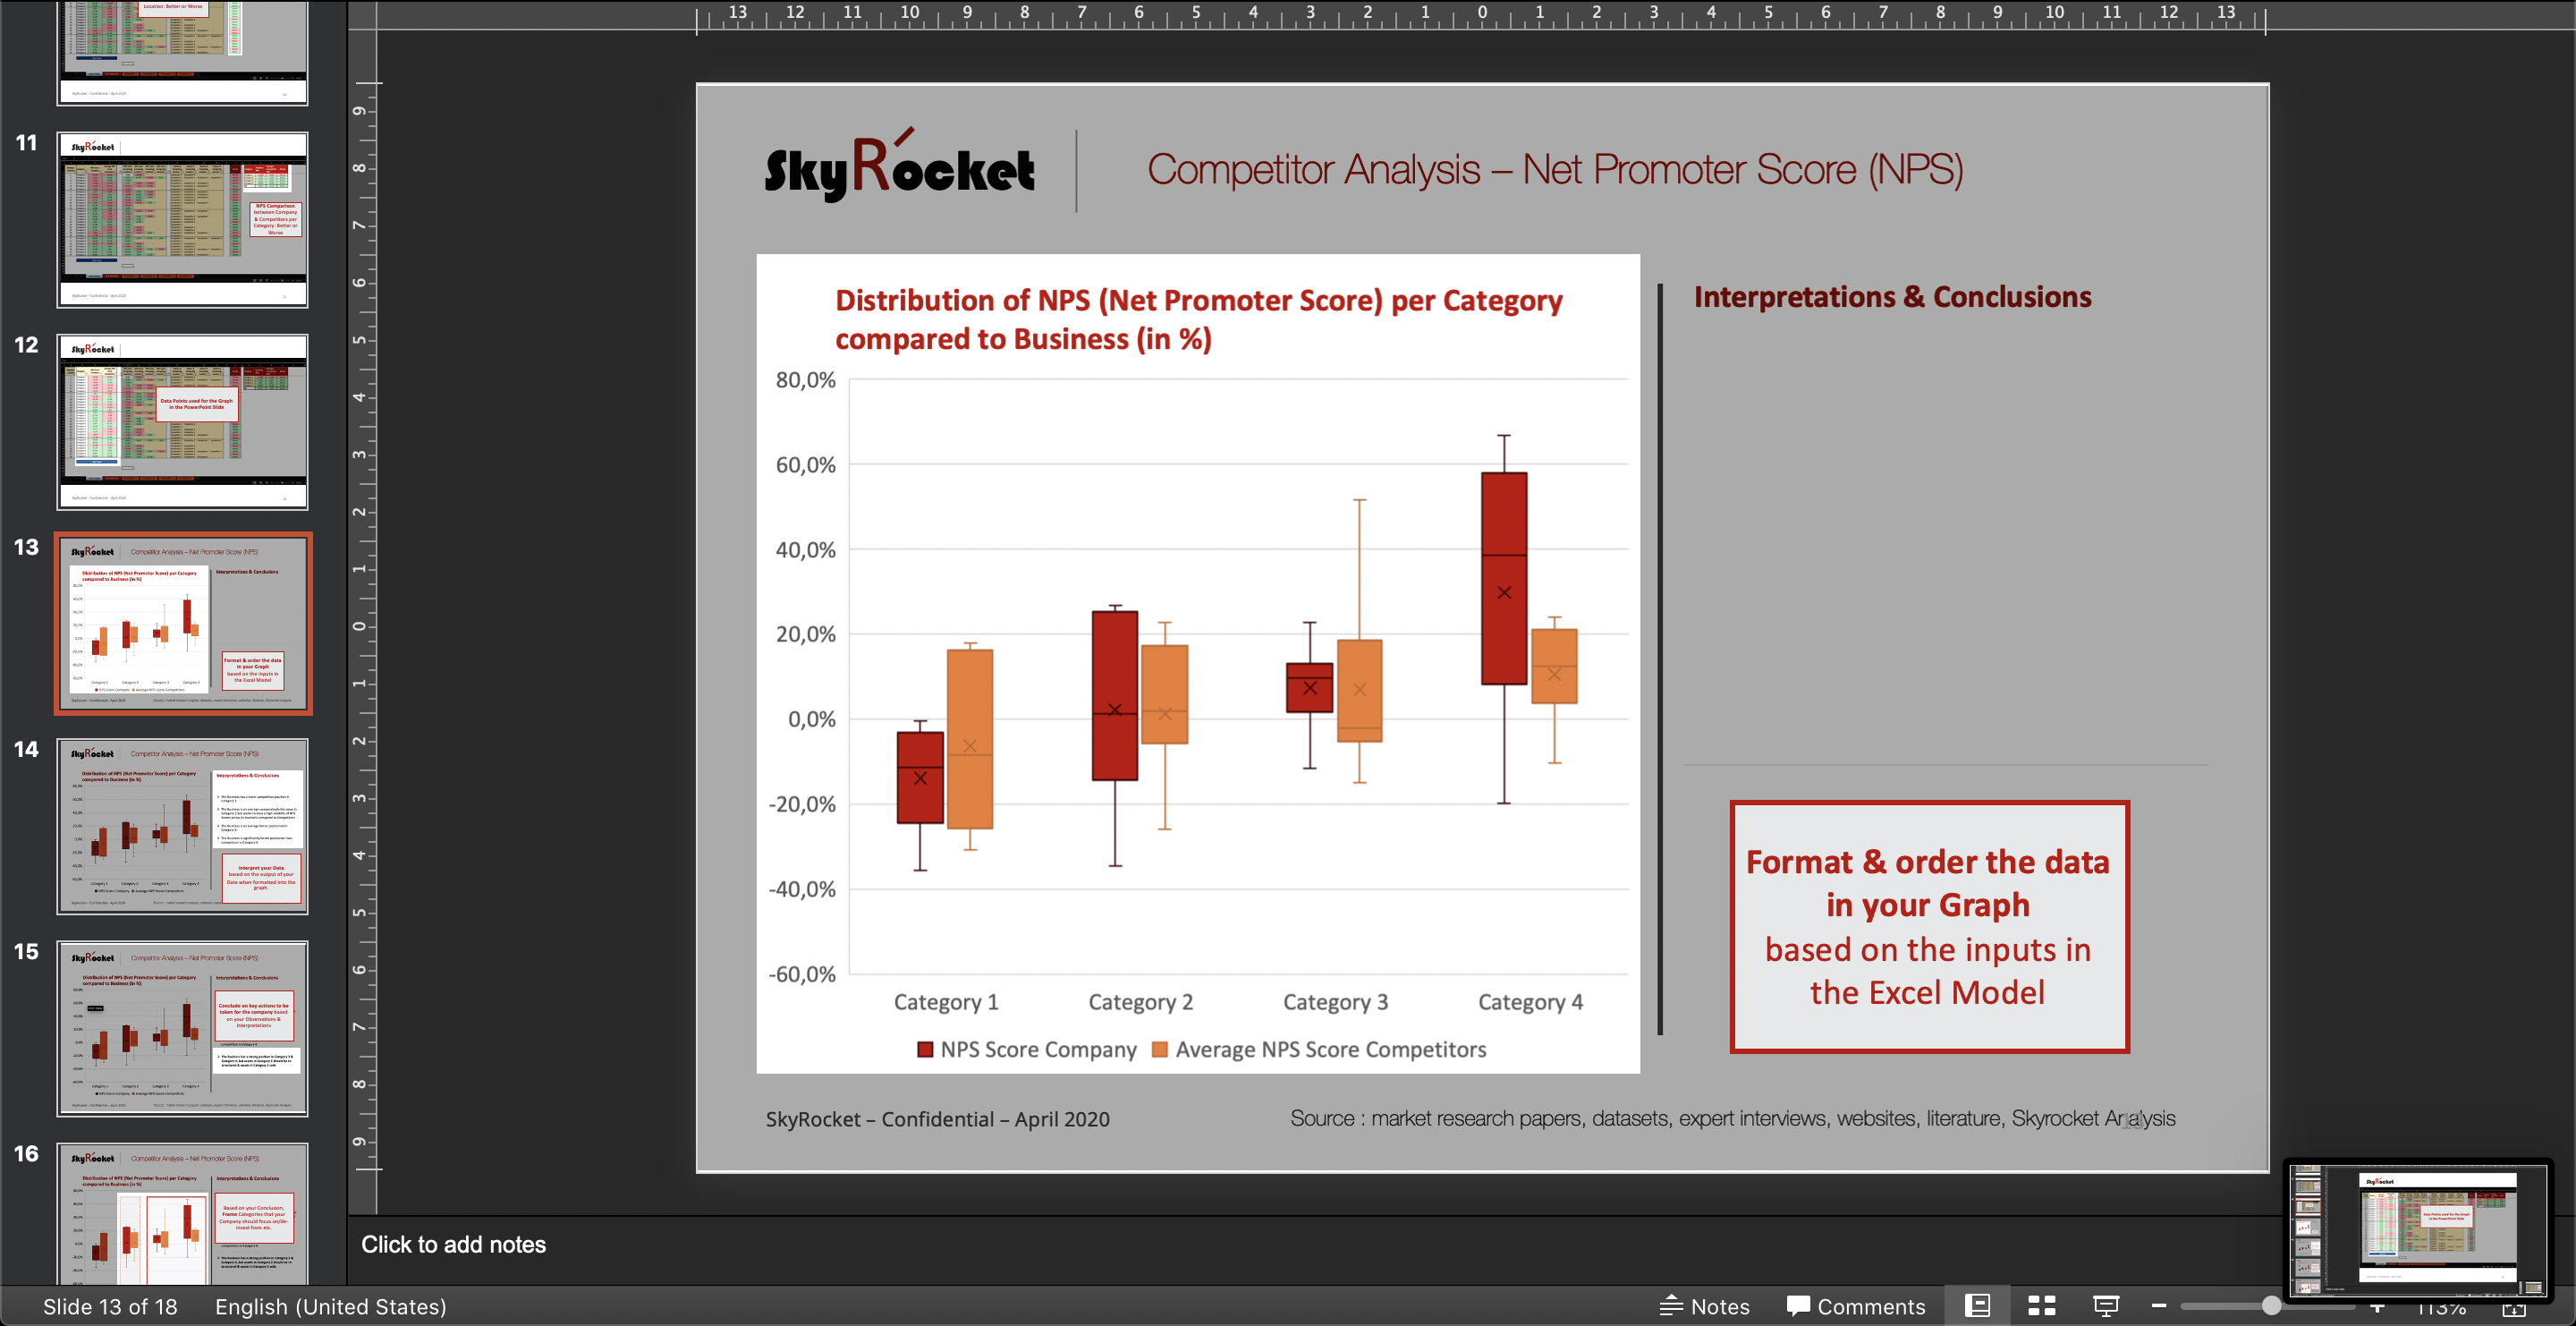
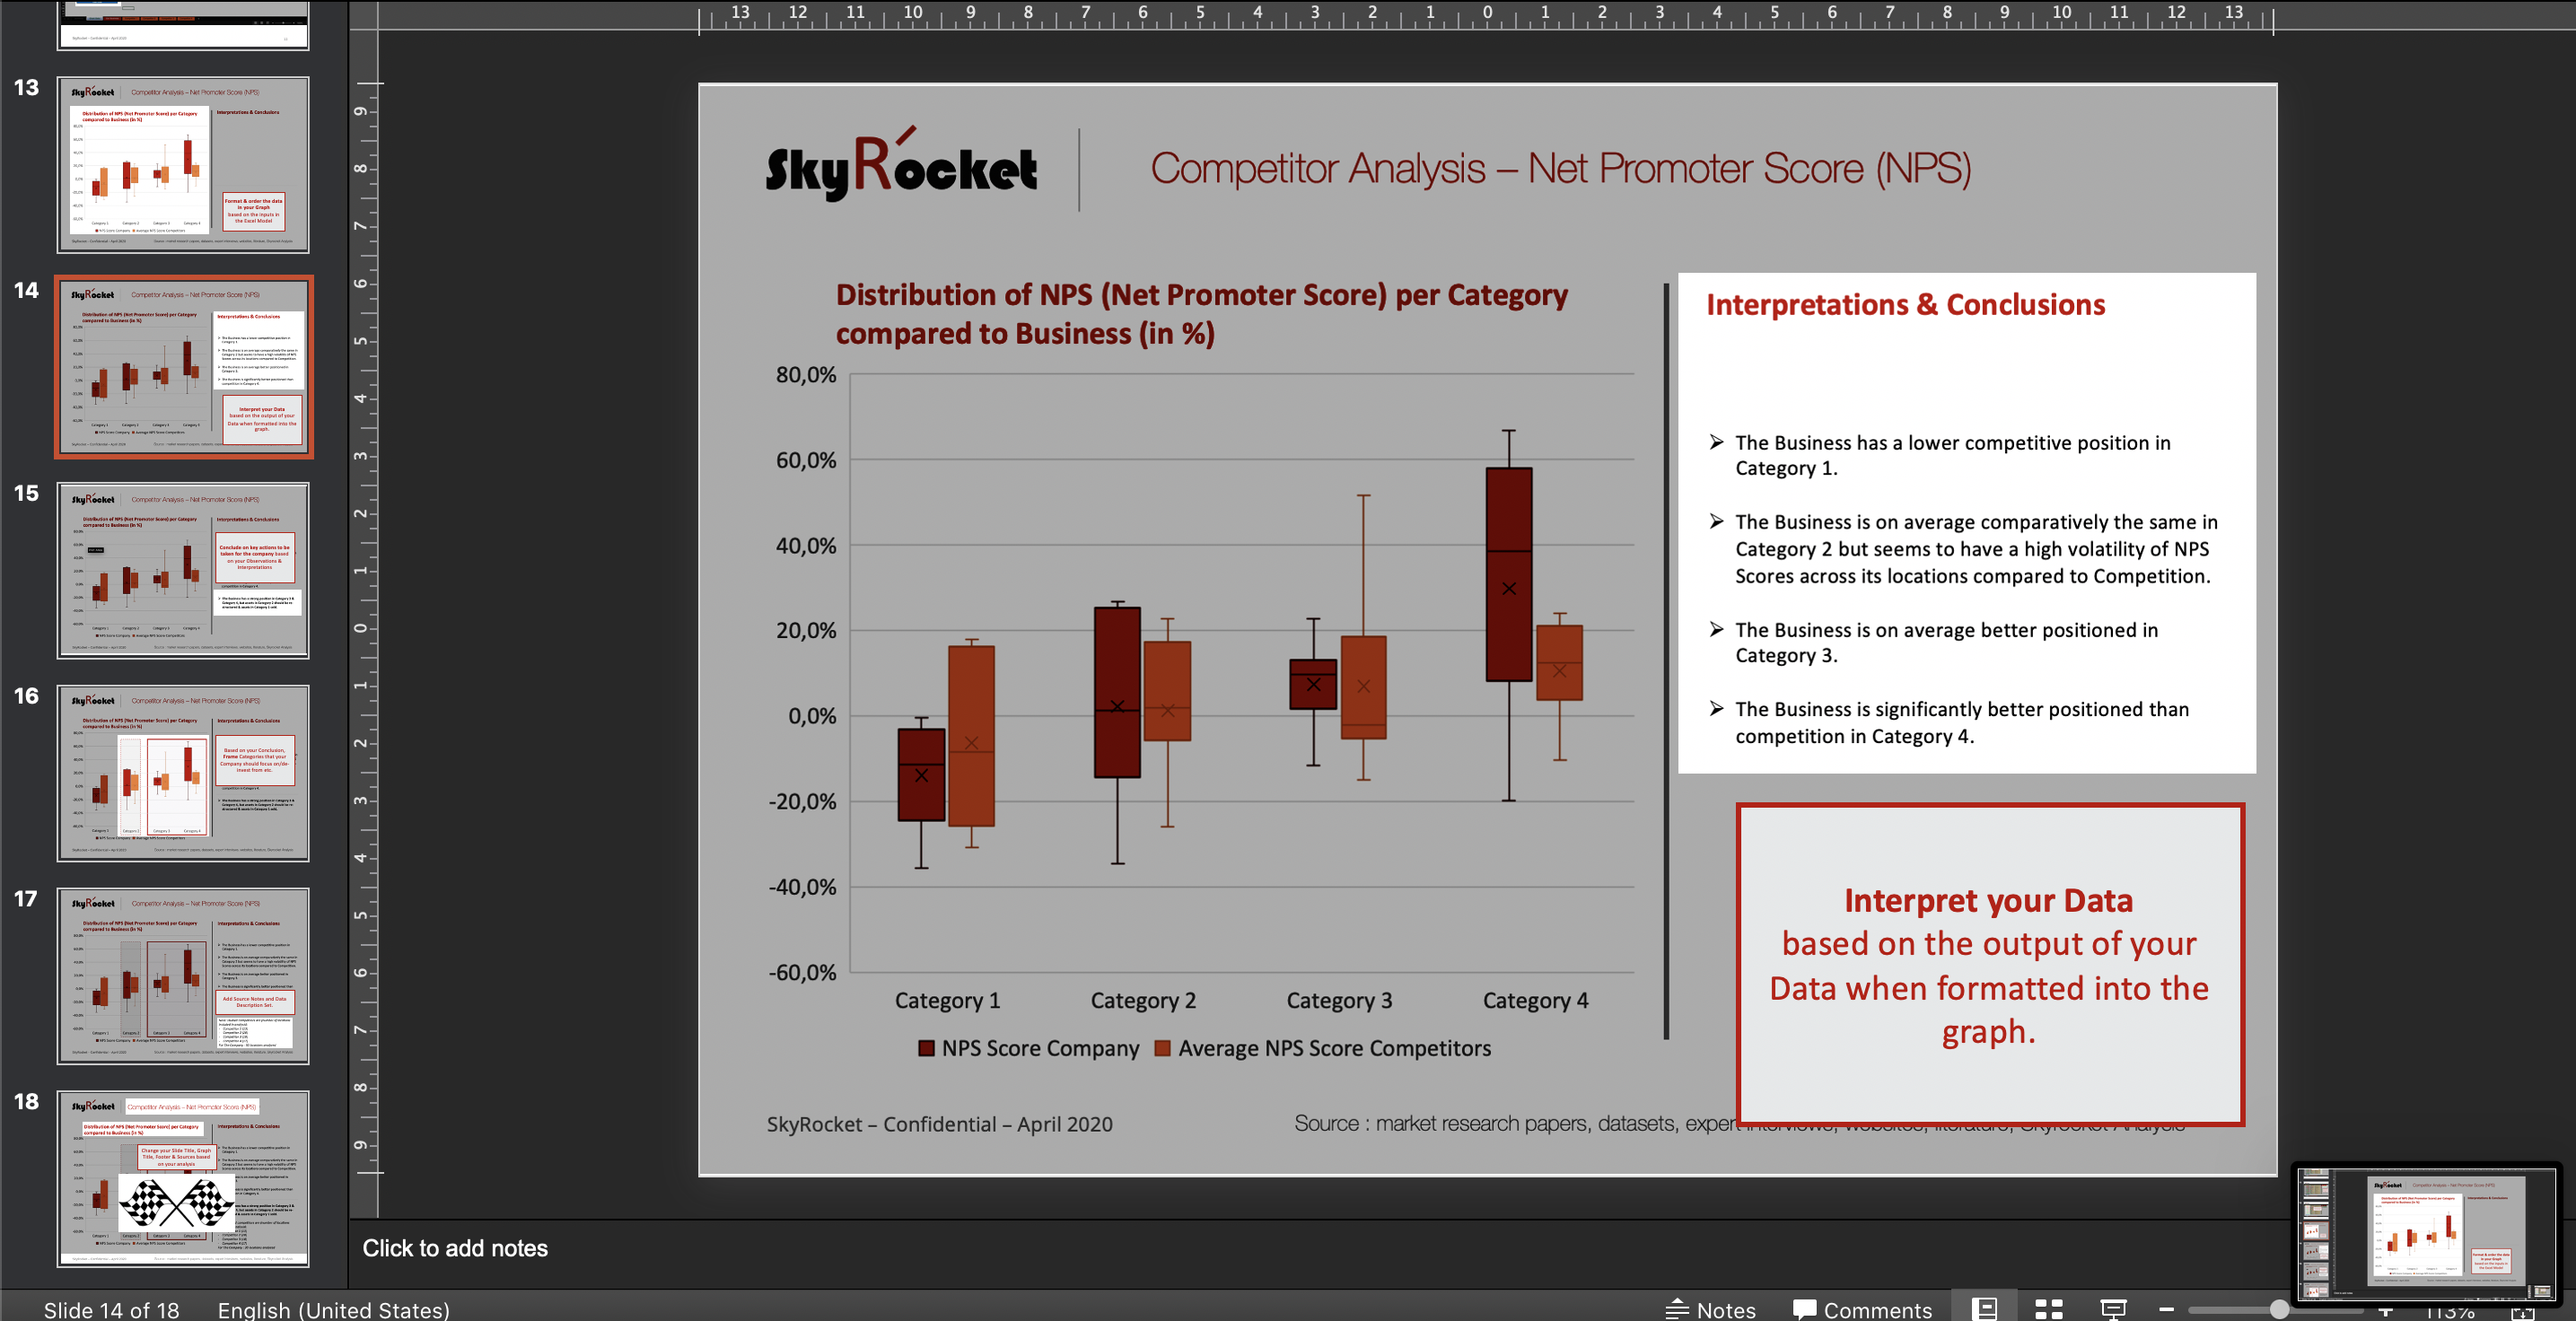
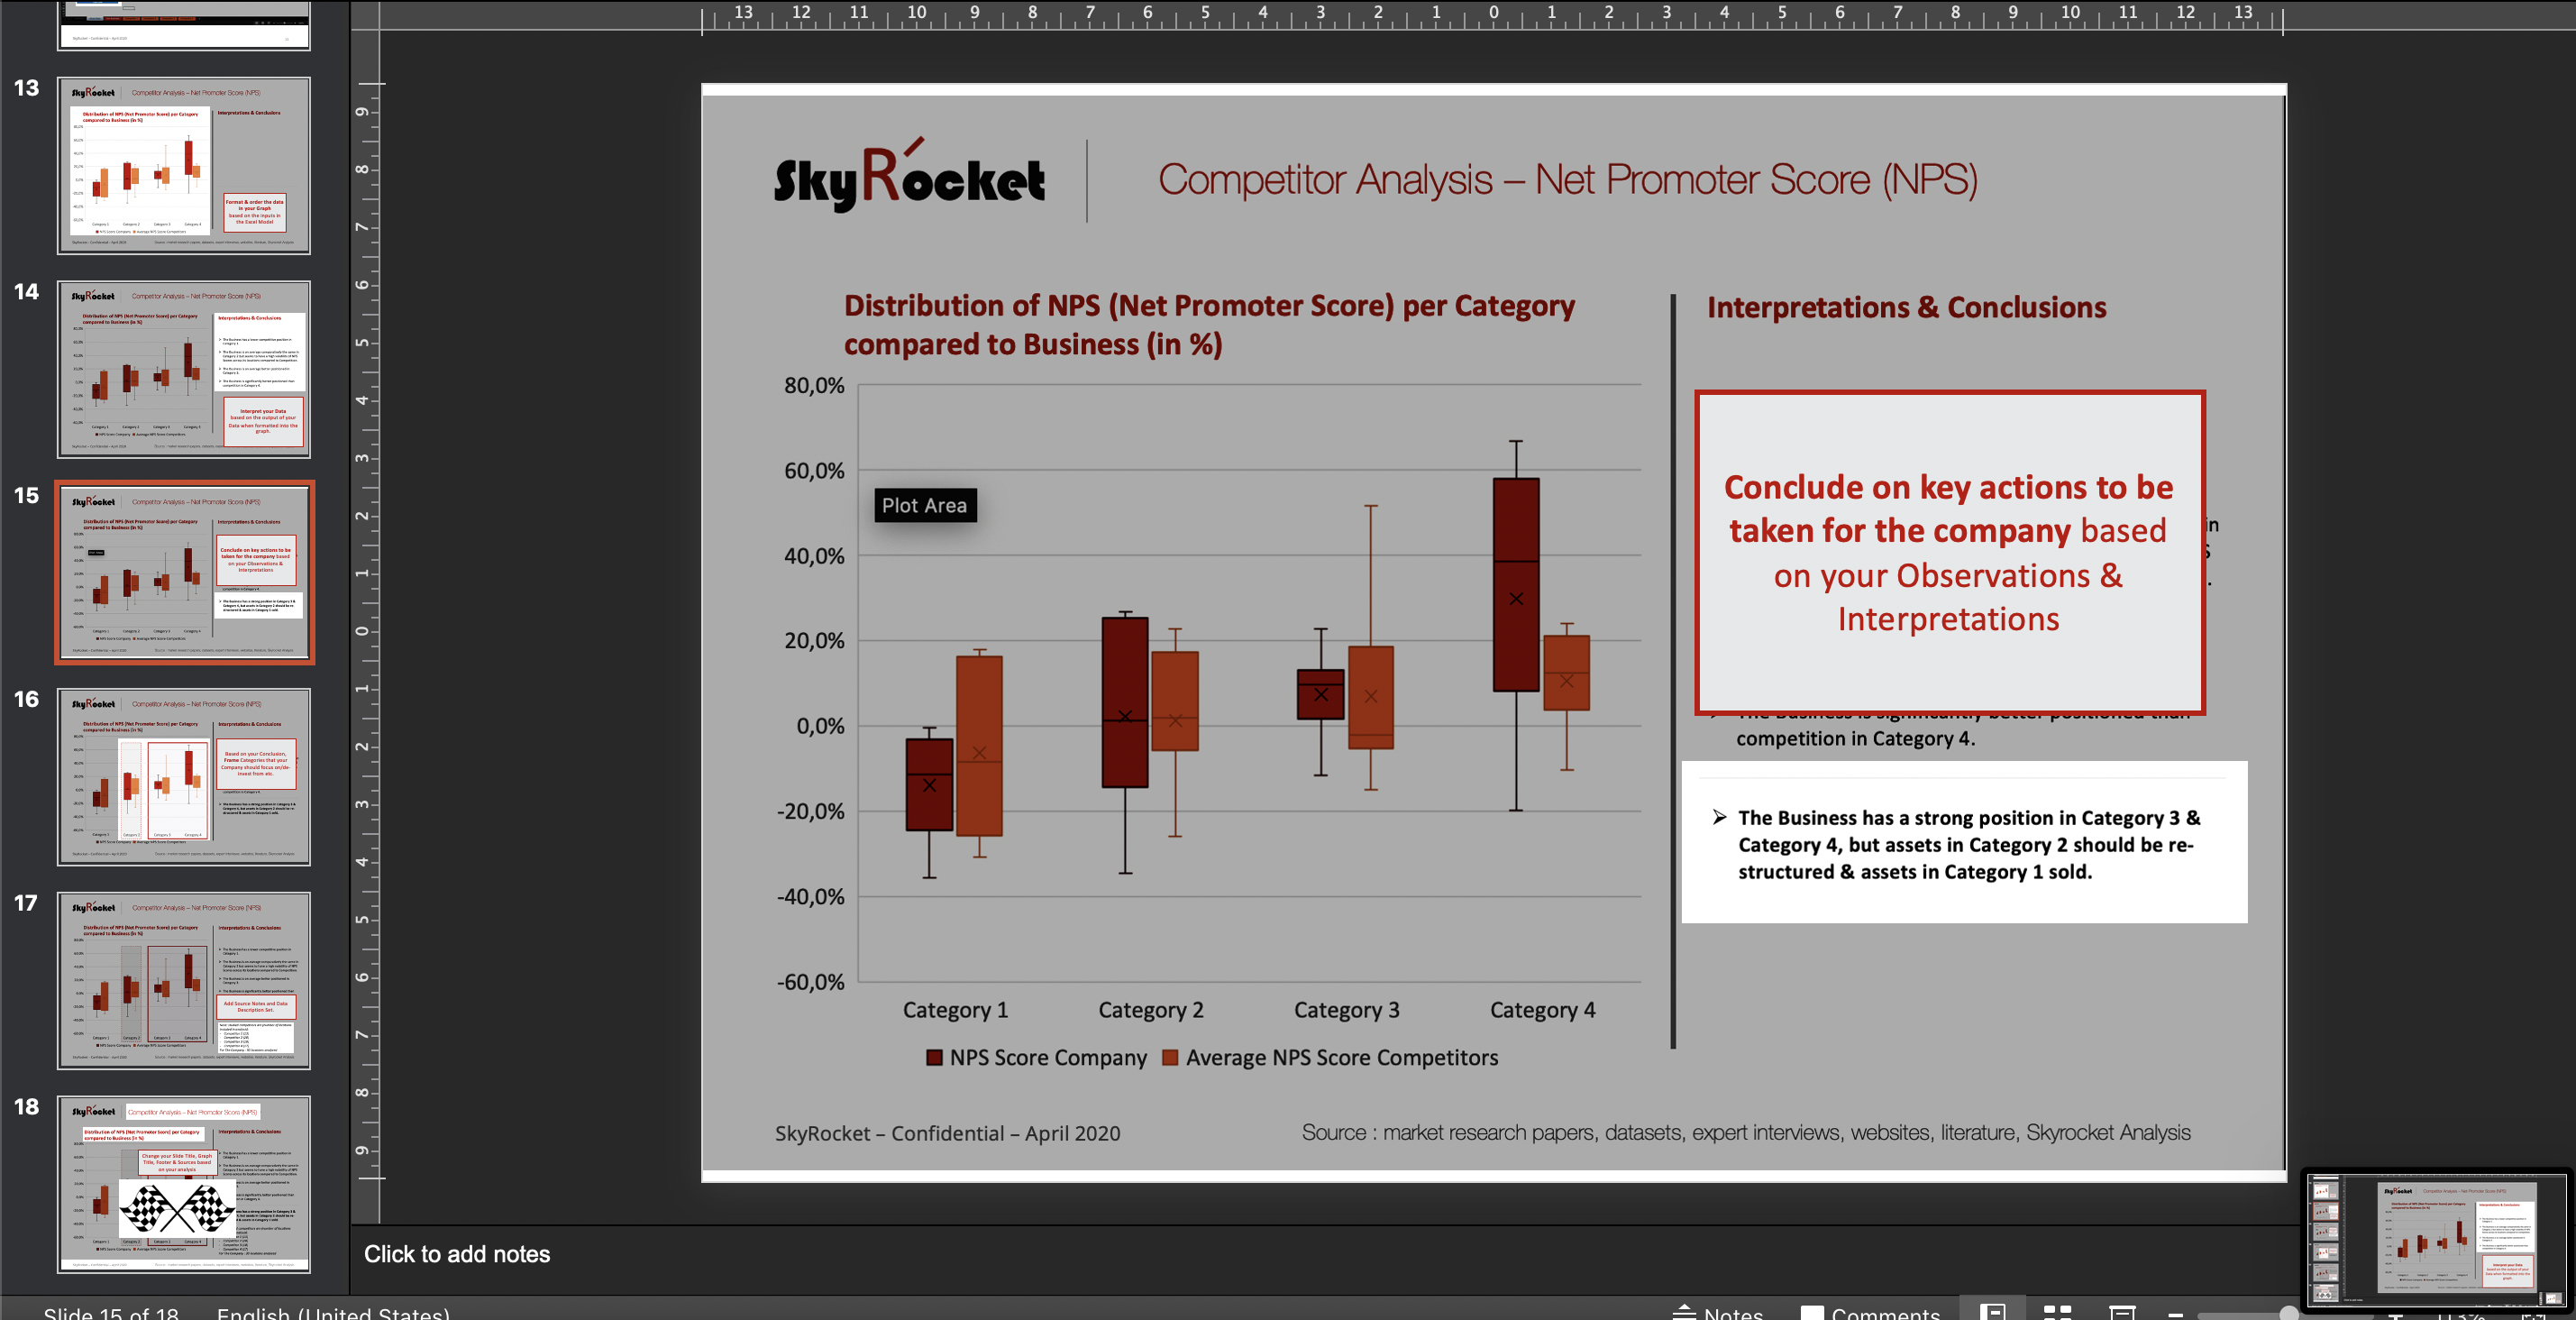
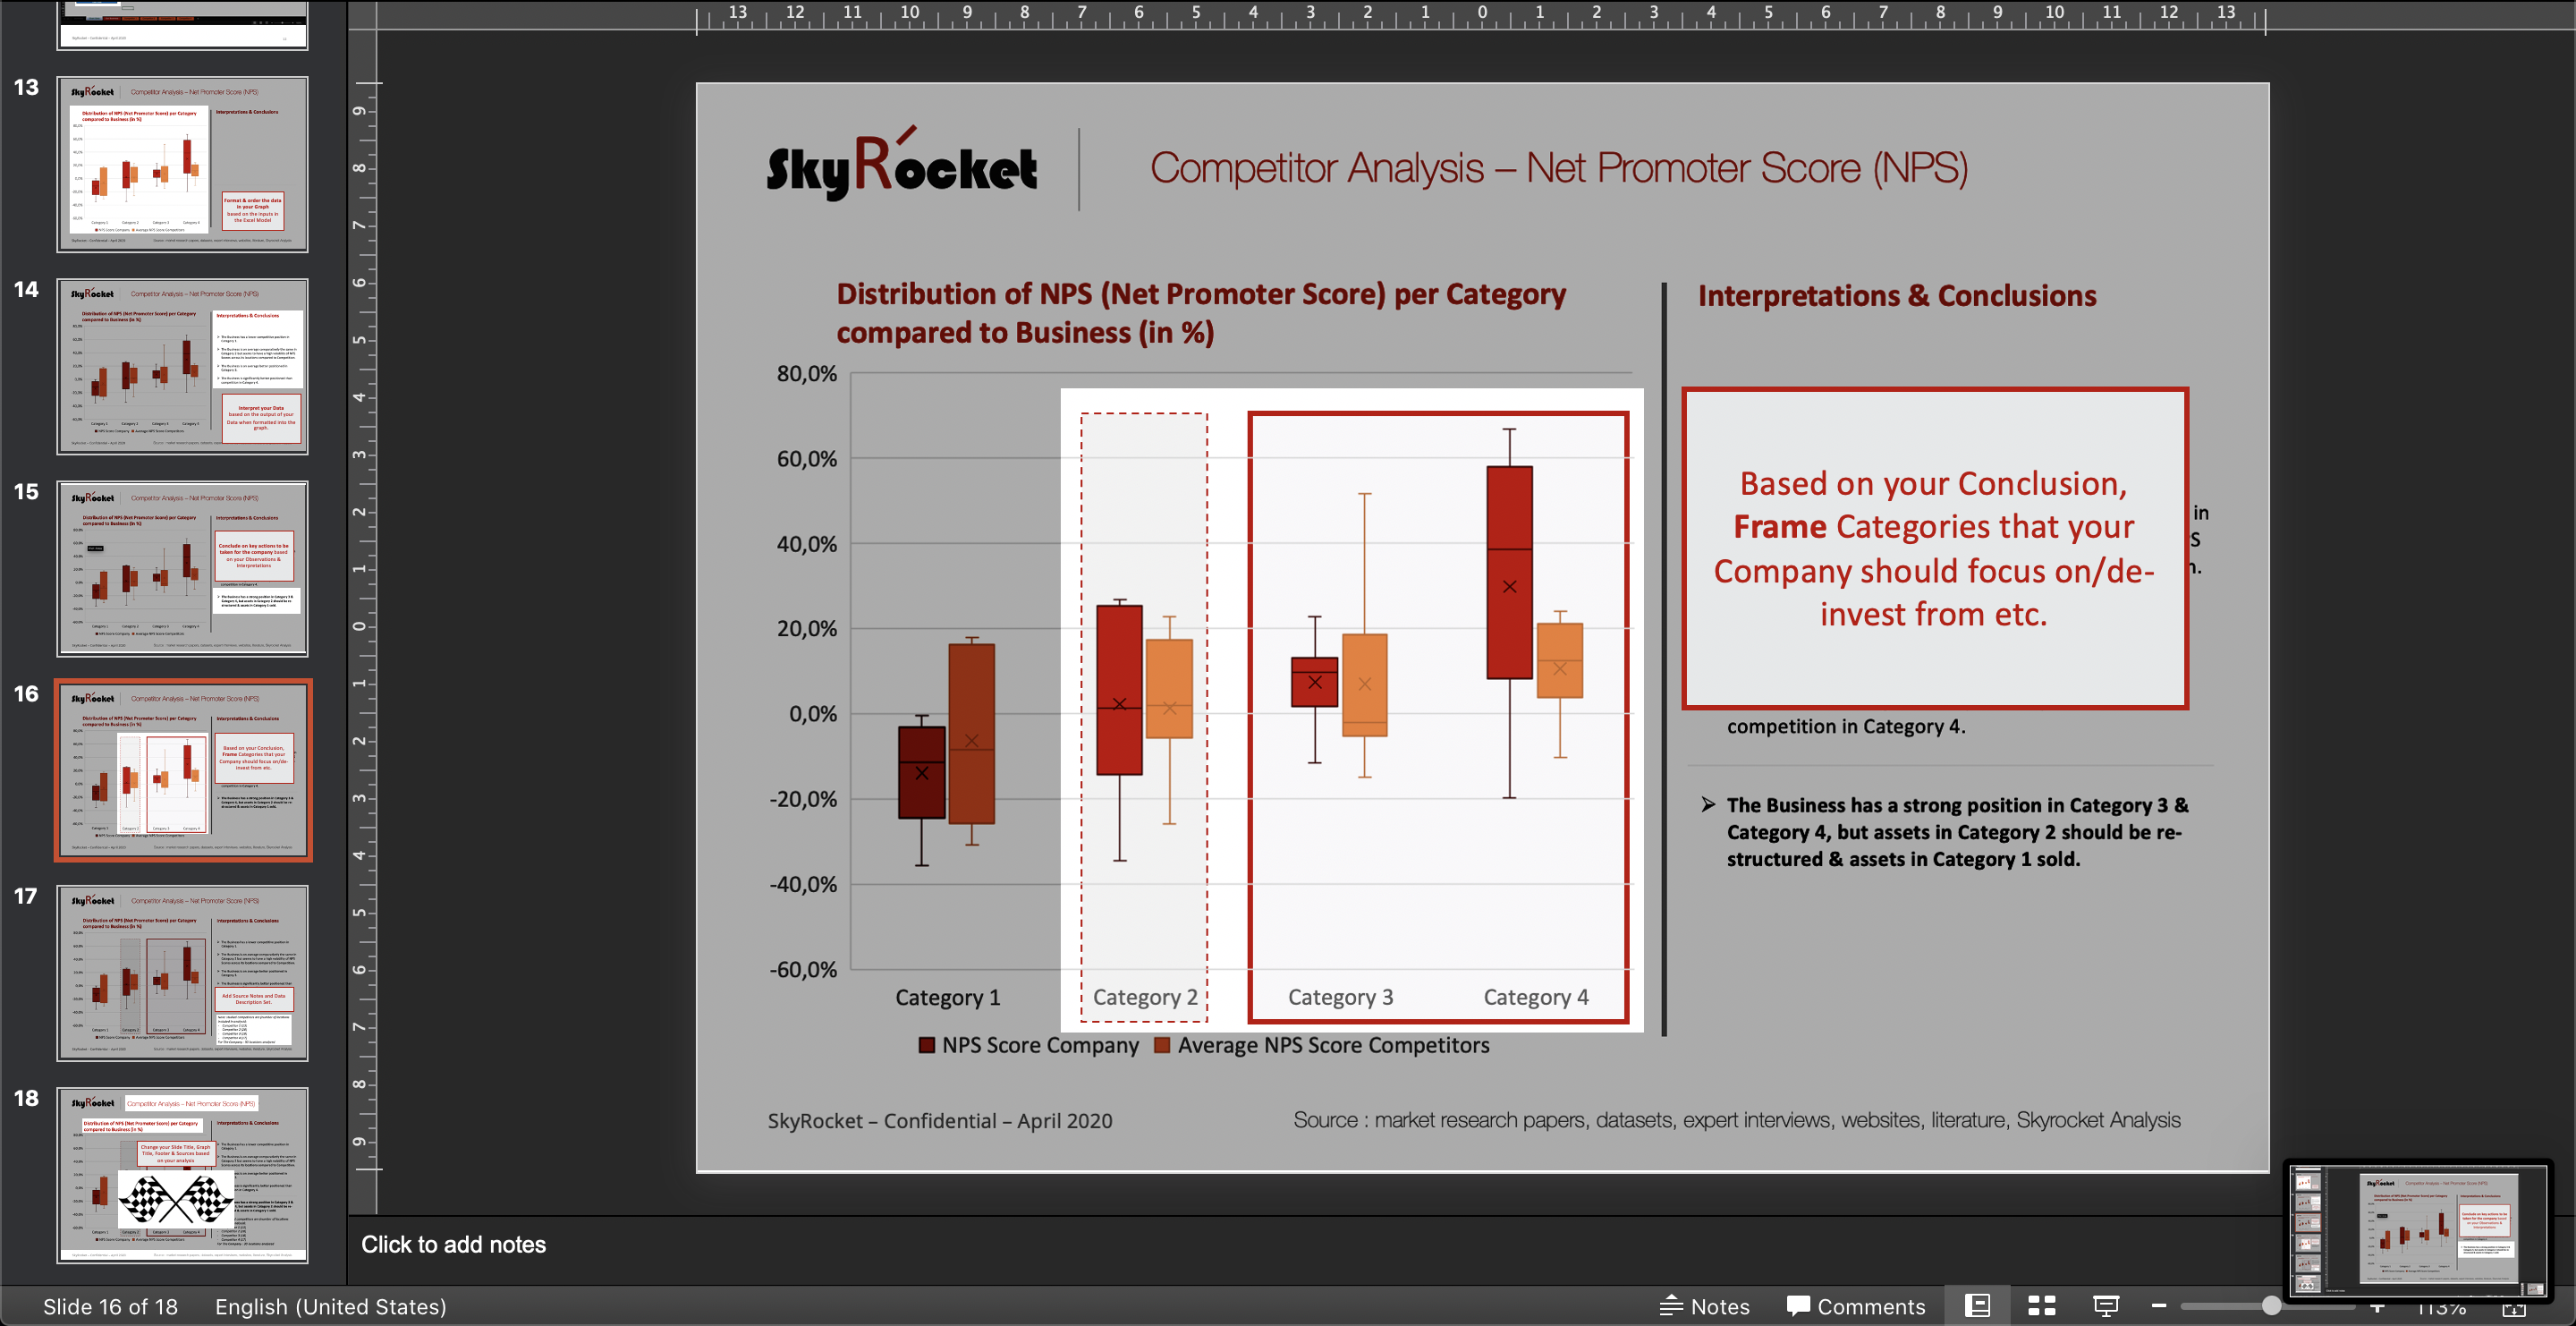
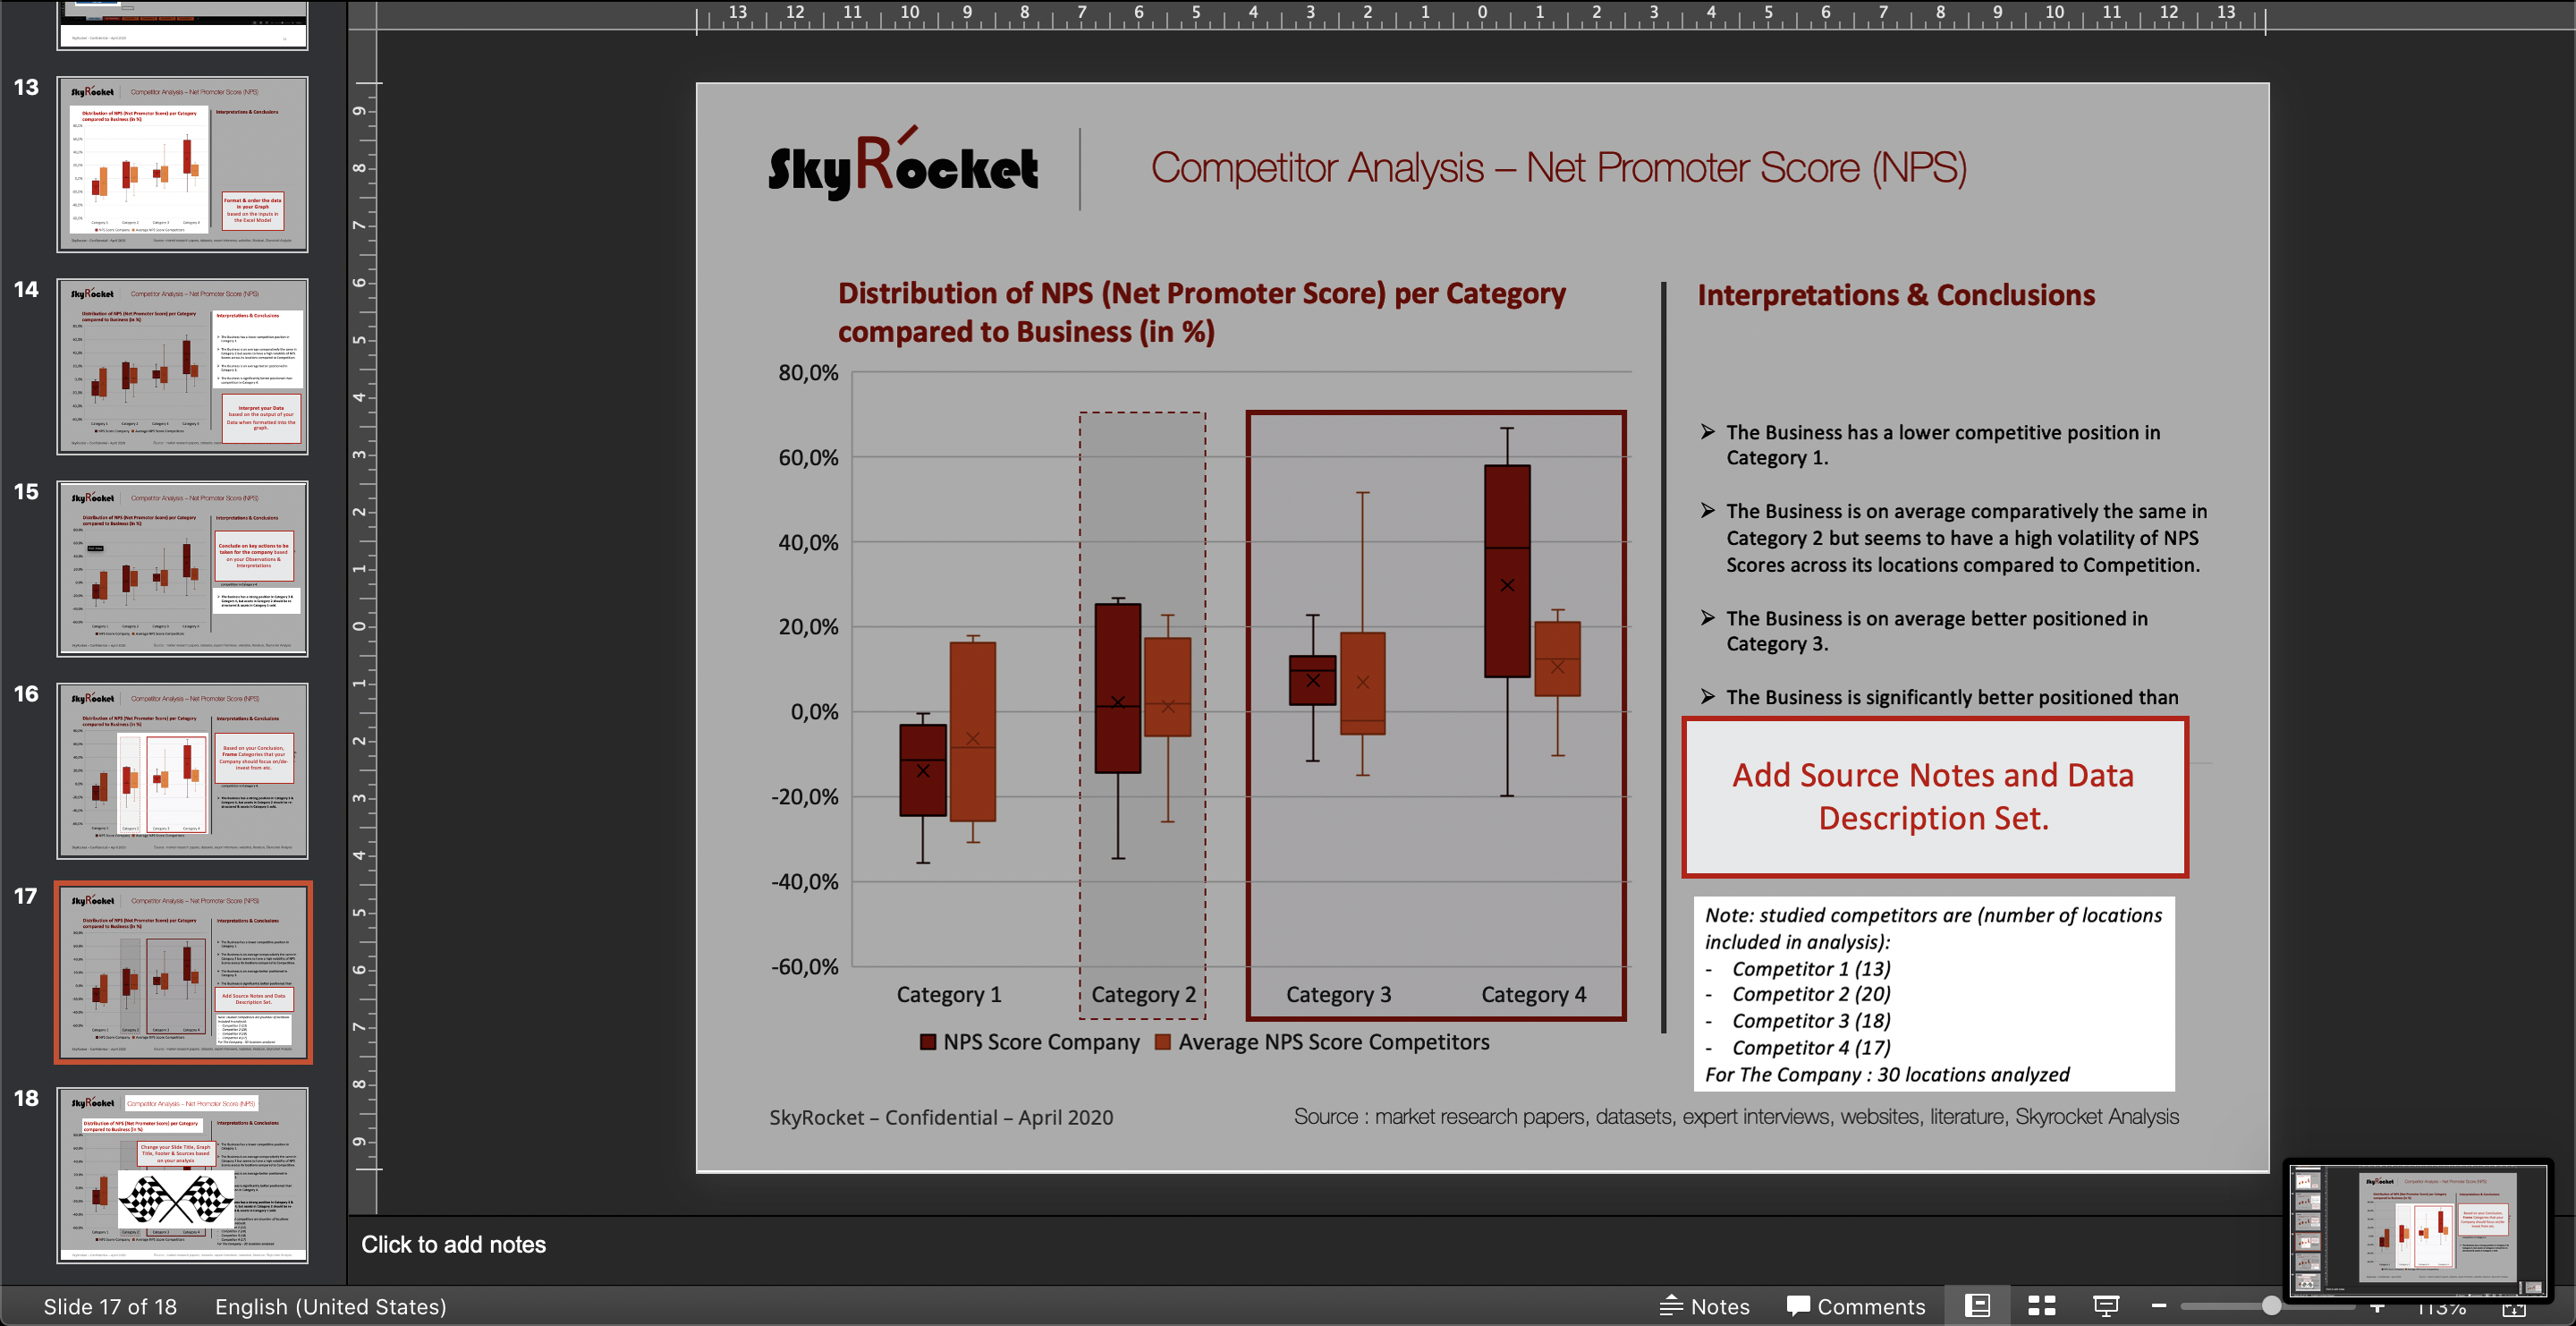
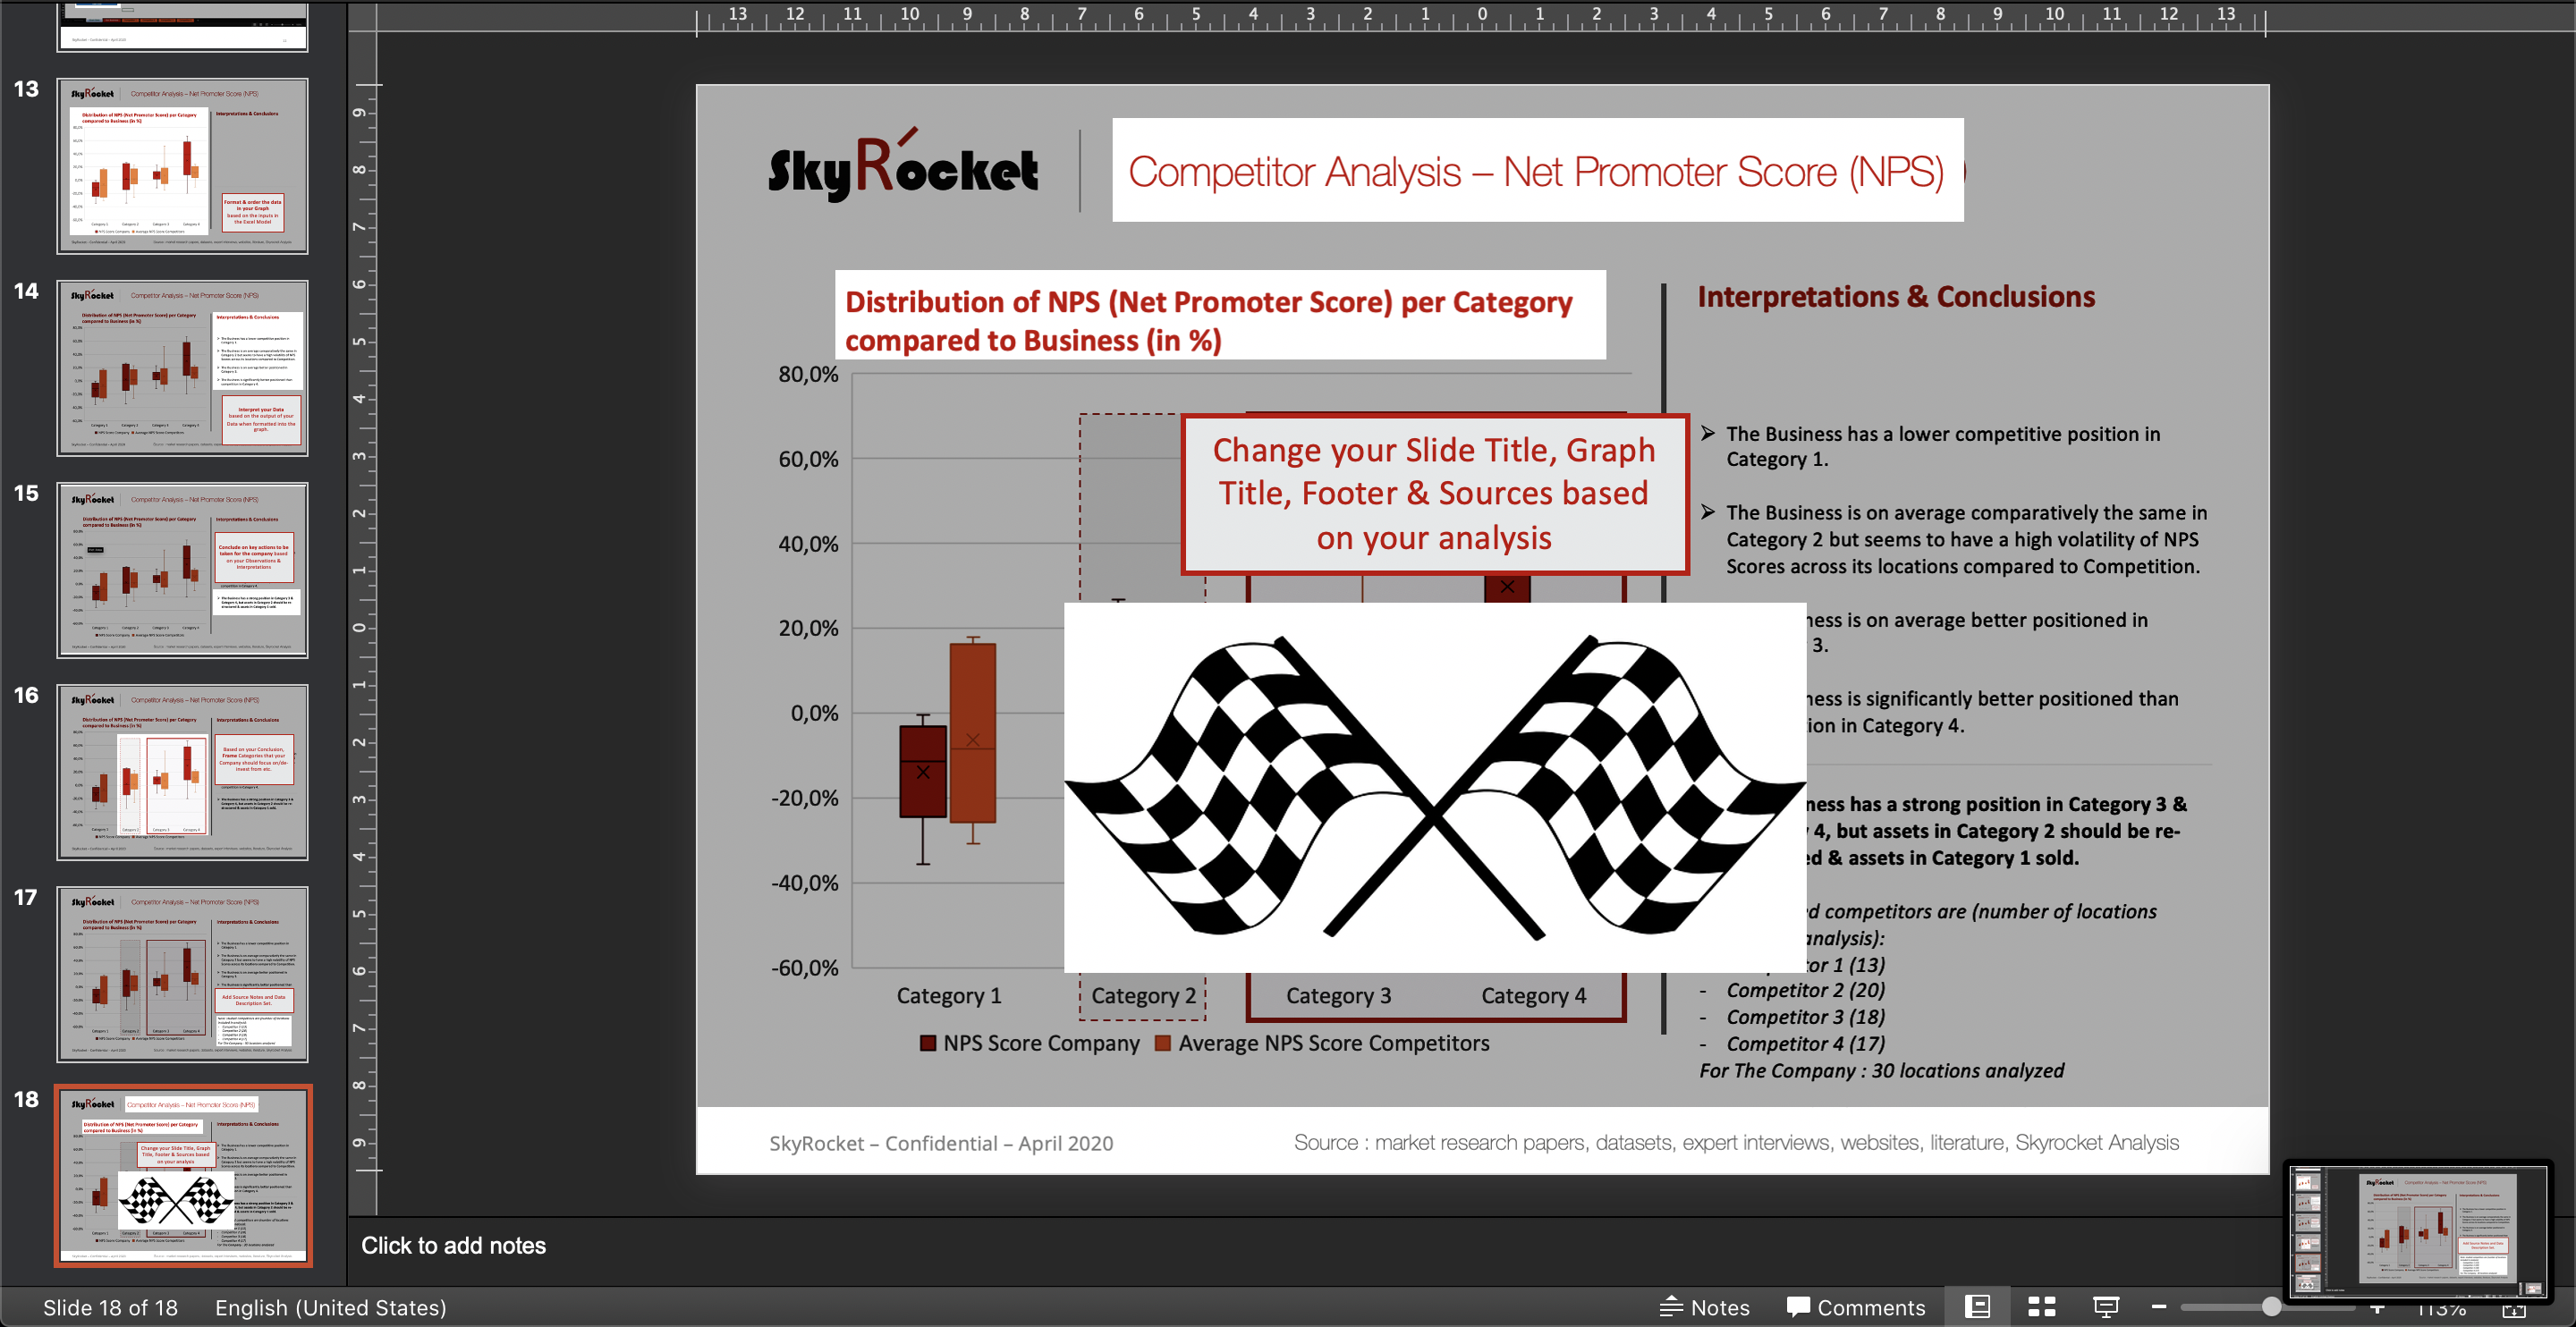
Competitor Analysis - Net Promoter Score (NPS) PowerPoint Slide Template & Excel Model
A PowerPoint Template Slide to show your business' NPS Score vs Competition to help strategic investment decisions.
