
Originally published: 28/11/2017 17:33
Publication number: ELQ-57050-1
View all versions & Certificate
Publication number: ELQ-57050-1
View all versions & Certificate

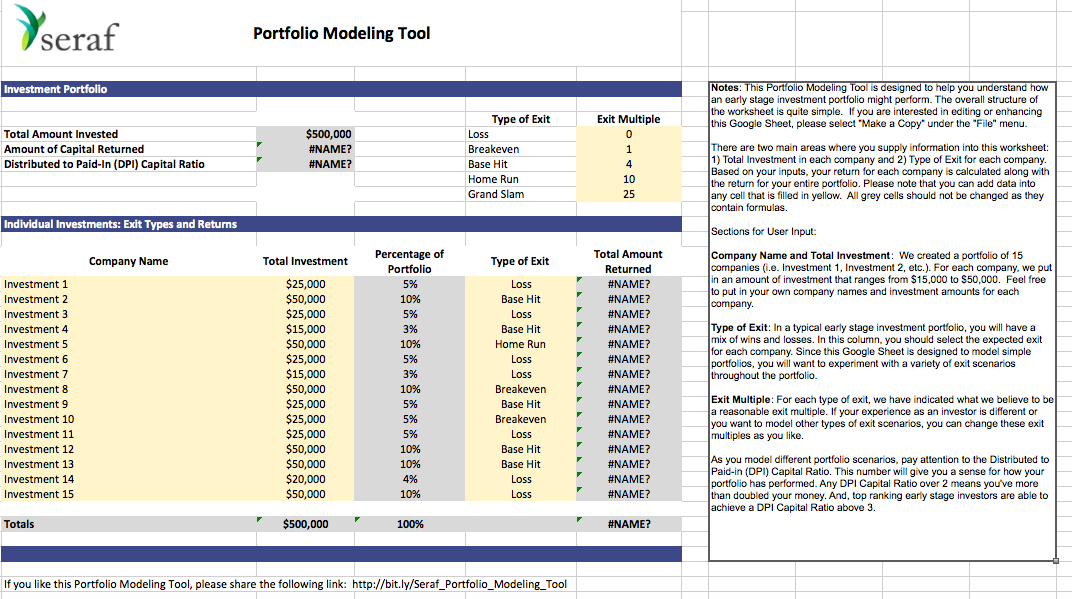
Excel Financial Model for an Early Stage Investment Portfolio
A comprehensive guide accompanied with explanations and examples to help you create an early stage portfolio
