

Last version published: 17/02/2020 10:31
Publication number: ELQ-41103-7
View all versions & Certificate

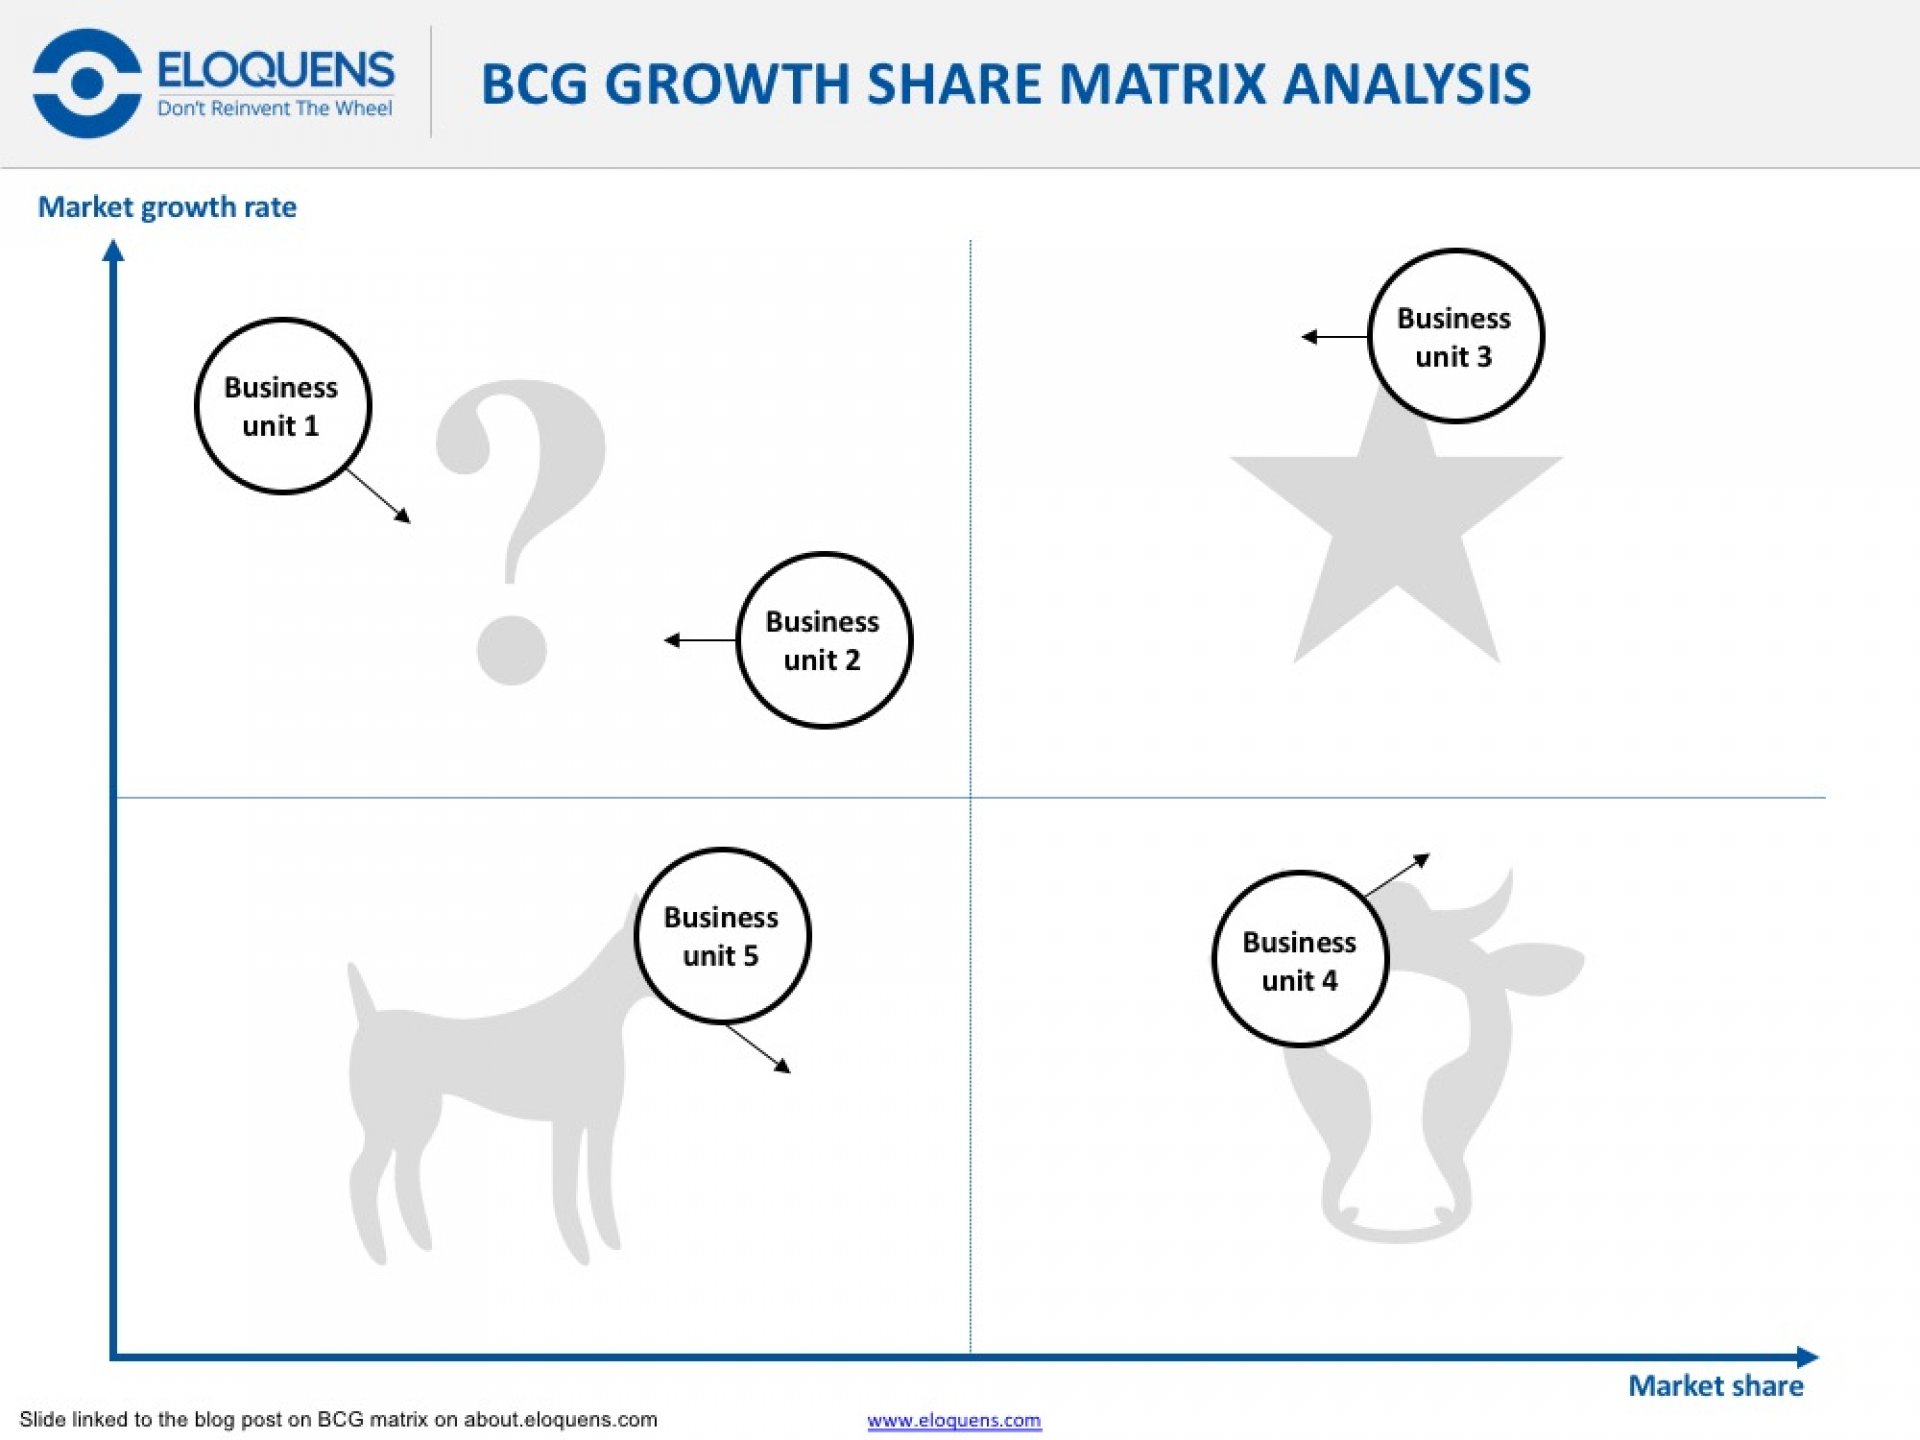
BCG Growth Share Matrix Template
A ready-to-use template for the BCG Growth Share Matrix! Qualify your dogs🐶, cash cows🐮, question marks❓and stars⭐️!
Deputy Director #MBADMB EFAP | Strategy consulting & marketing @AdVentures Startup Studio (incl. Wimi)Follow
Further information
Objectives:
- Map🗺 your business units or product lines on a single page to qualify your positioning and spot opportunities to boost your business growth and strengthen your cash position.🤑
- Give a structured overview of your portfolio of activities and the relative positions of your chosen activites within it.🏄♀️
- Have a tool to take a decision on where to push your ressources/budget to increase your bottom line results📊
Expected Impact:
• Present your portfolio of activities at a glance👀
• Display a structured understanding of your businesses key components🔑
• Provide intelligence on the main components and their relative positions within your business mapping
• Use a clear visual set-up to convince your audience
Main Sources:
• Existing reliable market studies giving your market share for each business unit, product line (Markess, Xerfi, Reuters, MarketResearch, HBR…)
• Business press 🗞
• Competitors’ publications: press releases, annual reports, corporate websites contents...
• Your own market watch tools🛠
• Your own dashboard internal tools and KPIs
• You want to highlight business opportunities in a multiple markets and decide were to disinvest🤔
• You want to illustrate your business positions in a single structure🏗
• You want a tool to help you conduct an evaluatory study
Insert in:
• Market studies
• Benchmarks
• Due Diligence
• Strategic plans
• Marketing plans
• You want to present your business units or product line key🔑 features or descriptions (or the ones of your competitors).
• You have no business status to evaluate - no mergers, investments, new ventures probability / feasibility to analyze🙅♂️
