Salesperson Commission Sensitivity Analysis
Originally published: 07/01/2021 09:04
Last version published: 22/12/2023 09:12
Publication number: ELQ-12851-5
View all versions & Certificate
certified

Salesperson Commission Sensitivity Analysis

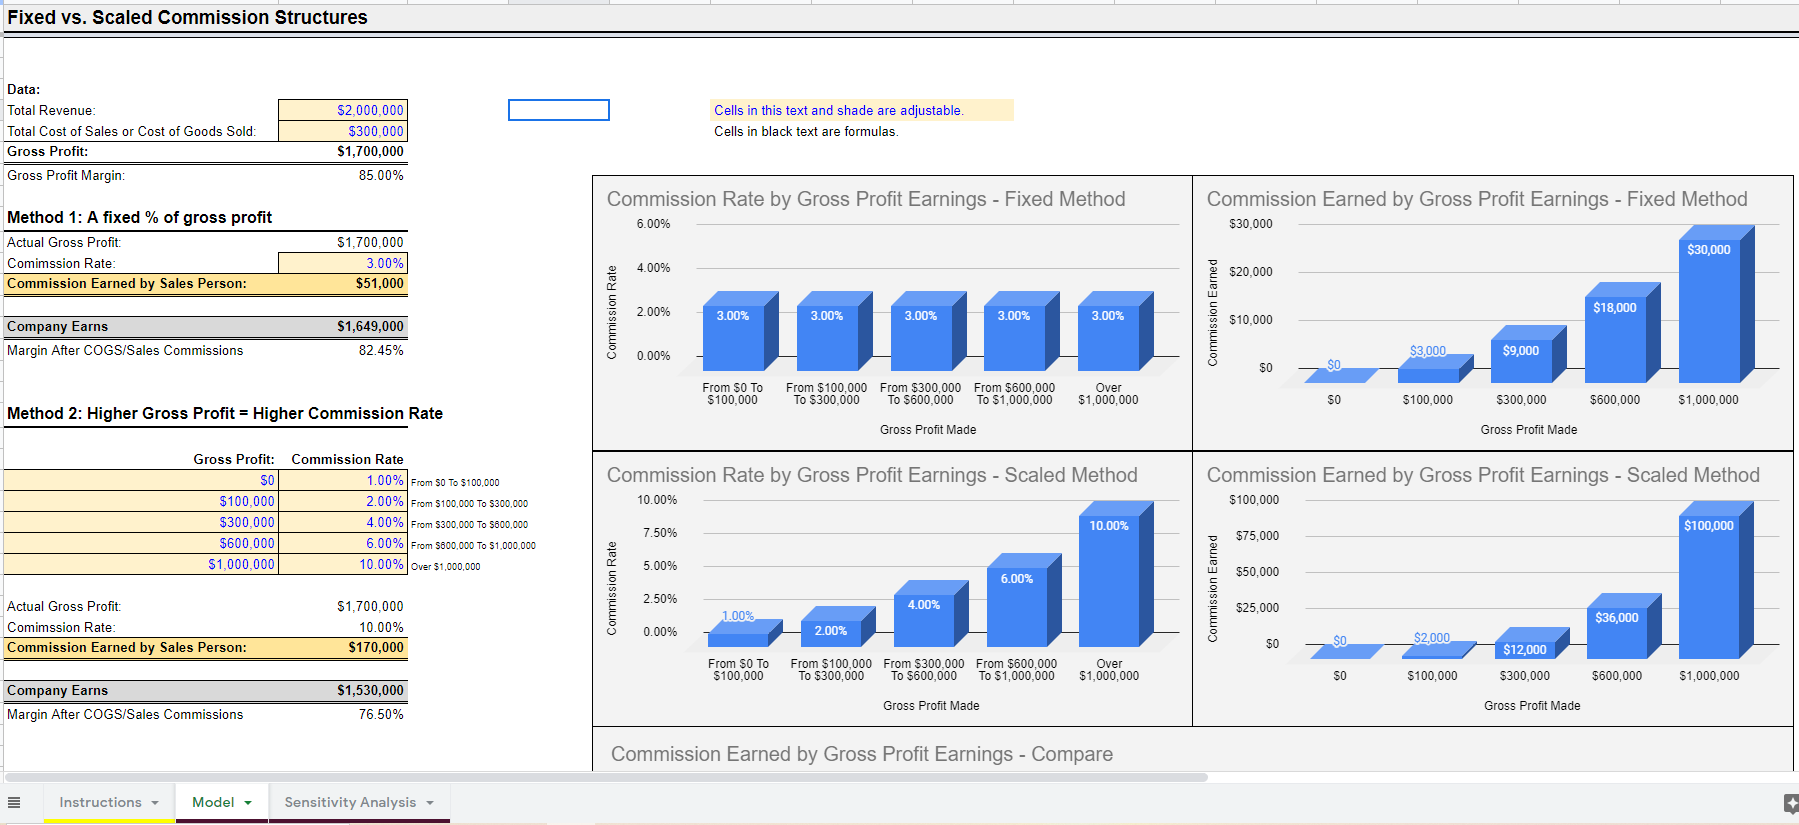
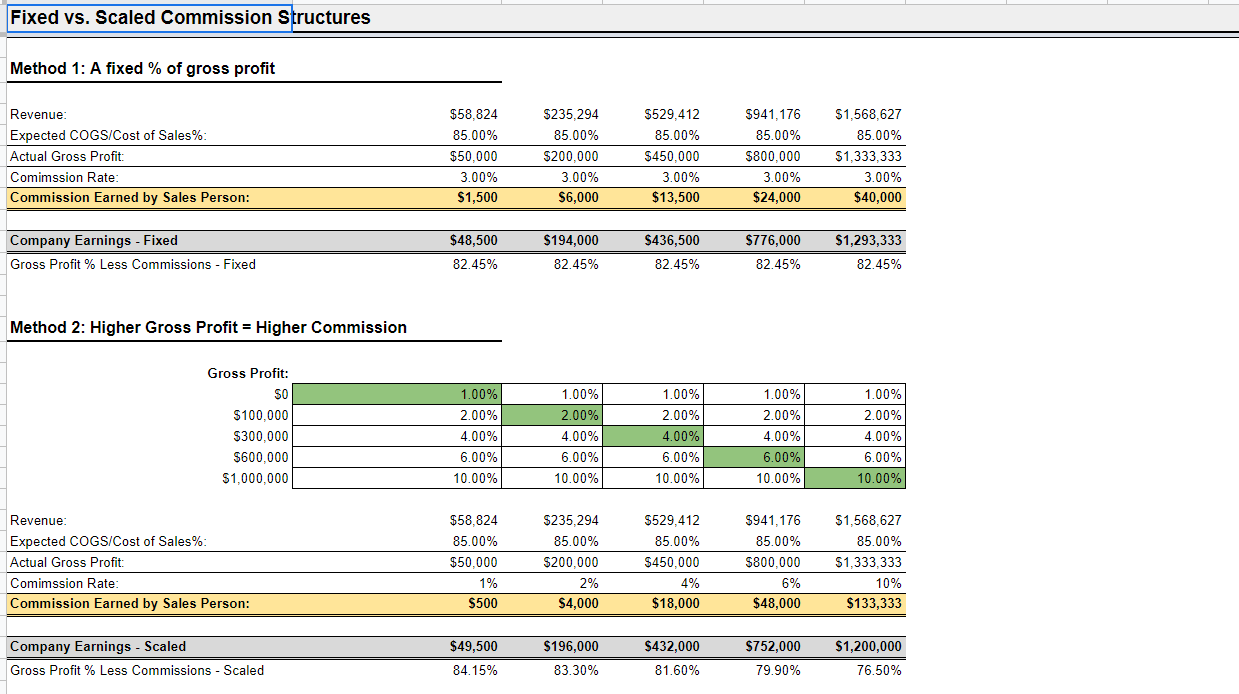
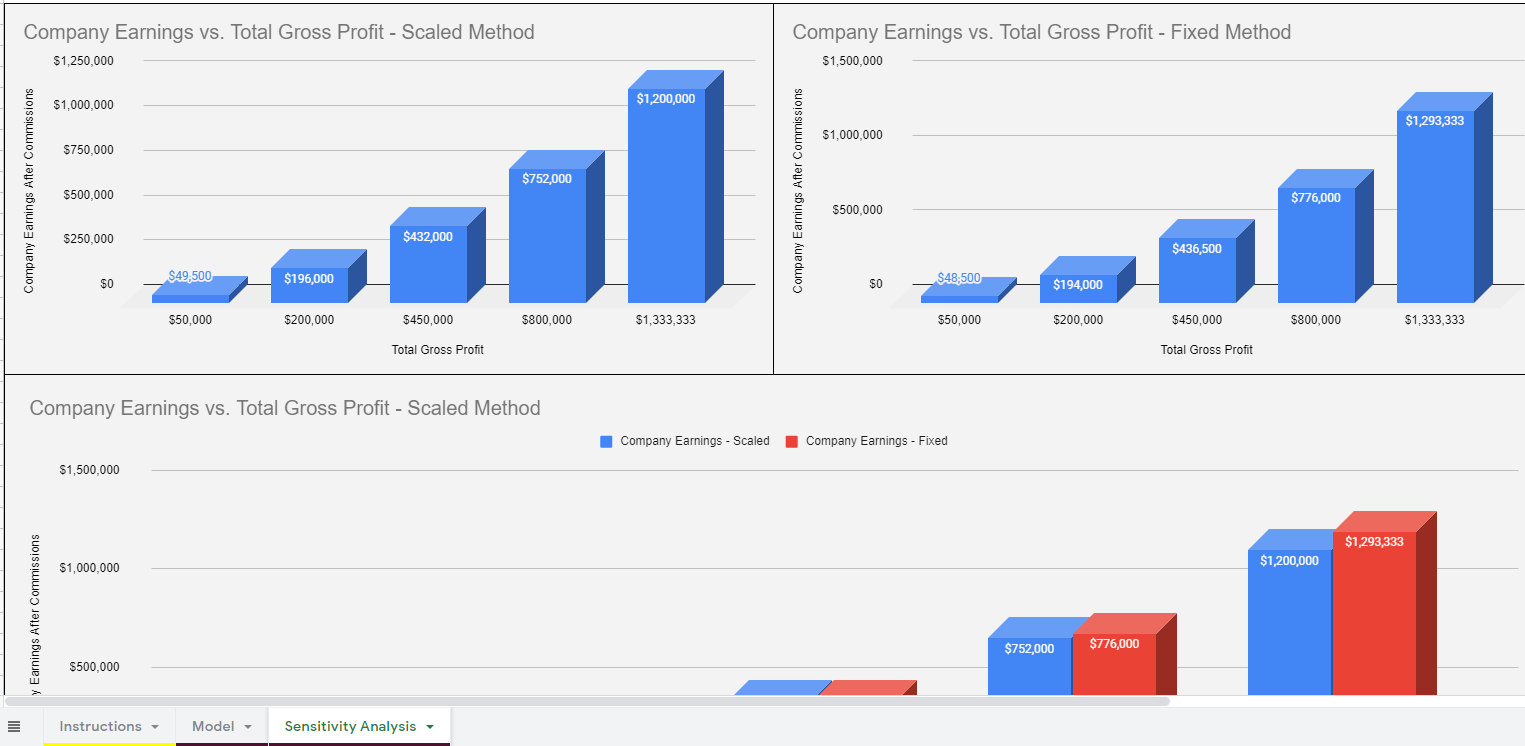
Visualize the impact for salesperson and company when using fixed rate commission vs. tiered rate commission structure.

Description
Determining a fair way to pay sales representatives can be difficult. Often, the motivator is money and as a company you are trying to make the most amount of gross profit and as a sales representative you are trying to make the most money possible. The salesperson commission model helps figure this out by comparing two primary compensation strategies. 

Note, these calculations don't look at base salary. Both types of commission methods are based on the amount of gross profit the salesperson earns for the company. I feel like that puts everyone's incentives in line. If you are unable to calculate the gross profit for your representative activities, that is ok and you would just make the gross profit rate 100% of revenue in order to make the calculations make sense.

The two types of structures included here are:

1) giving the sales representatives a fixed commission rate on all gross profit generated. This is pretty straight forward as you just multiply the rate by the gross profit for the given period and the result is commissions paid out.

2) Giving the sales representatives a variable commission rate that goes up as the gross profit goes up. This method is definitely more of a carrot, even though in both methods the salesperson is making more money as they generate more gross profit. 

In method 2, the rate of commission may start lower and then grow in tiers. The idea here is to motivate the salesperson to make more gross profit and in return they earn a greater share of generated profits.

Rationally, a company should be willing to give up more in commissions if it means making more money overall. For example, if a company makes 100,000 in gross profit and has to pay 2,000 (2%) out in commissions or a company makes 500,000 in gross profit and pay out 25,000 (5%), then scenario two rationally makes more sense because making 475,000 is better than making 98,000) even though the commissions being paid out are greater.

This model lets the user test all kinds of rate levels across up to 5 tiers and shows the impact on gross profit. Visuals have been done for both the salesperson and the company so both parties can see how choosing one method over the other would result based on various gross profit generation.

Note: This model is in the form of a google sheet. So the purchased produce is a word document that contains the link to the google sheet. The user just needs a free google account in order to use this template fully. After purchase, go to the link in the word doc and then hit File > Make a Copy for your own editable version.


This template is also included in one bundle:
- All Models Bundle: https://www.eloquens.com/tool/P8Y4TX4v/finance/financial-forecasting-models/financial-models-120-useful-and-usable-logic

This Best Practice includes
Google Sheet Access, Video Tutorial

Acquire business license for $45.00

Add to cart

Add to bookmarks

Discuss

Further information

Any company that pays commissions to salespeople.

When gross profit is quantifiable per salesperson activity.

If your salespeople are not incentivized based on gross profit generation.


0.0 / 5 (0 votes)

please wait...