
Originally published: 08/03/2018 13:34
Last version published: 18/05/2018 12:16
Publication number: ELQ-25024-2
View all versions & Certificate
Last version published: 18/05/2018 12:16
Publication number: ELQ-25024-2
View all versions & Certificate

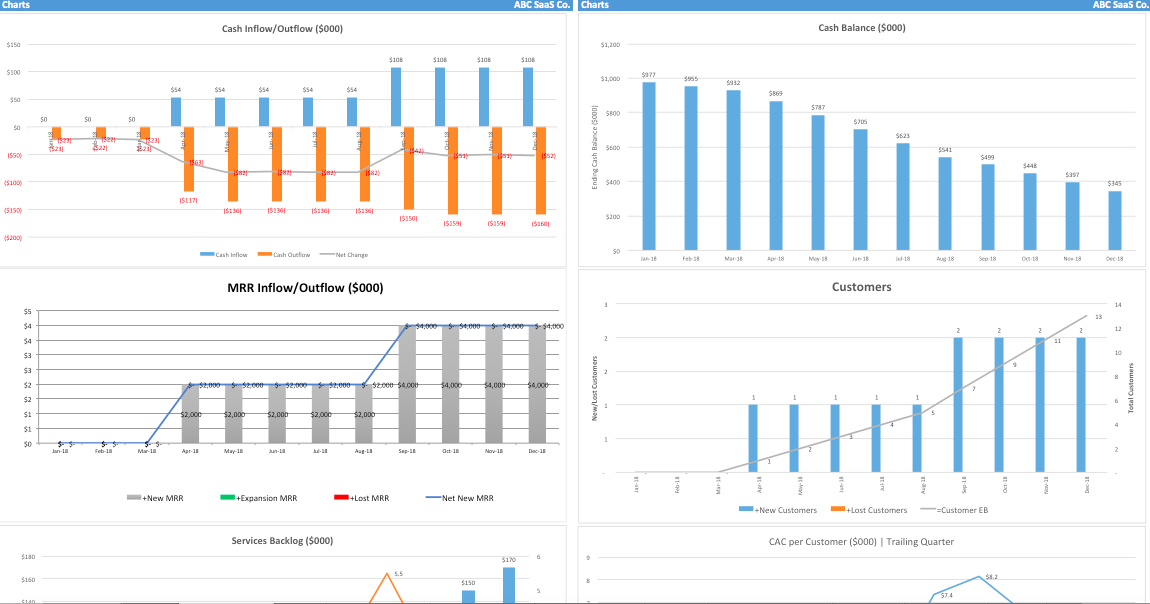
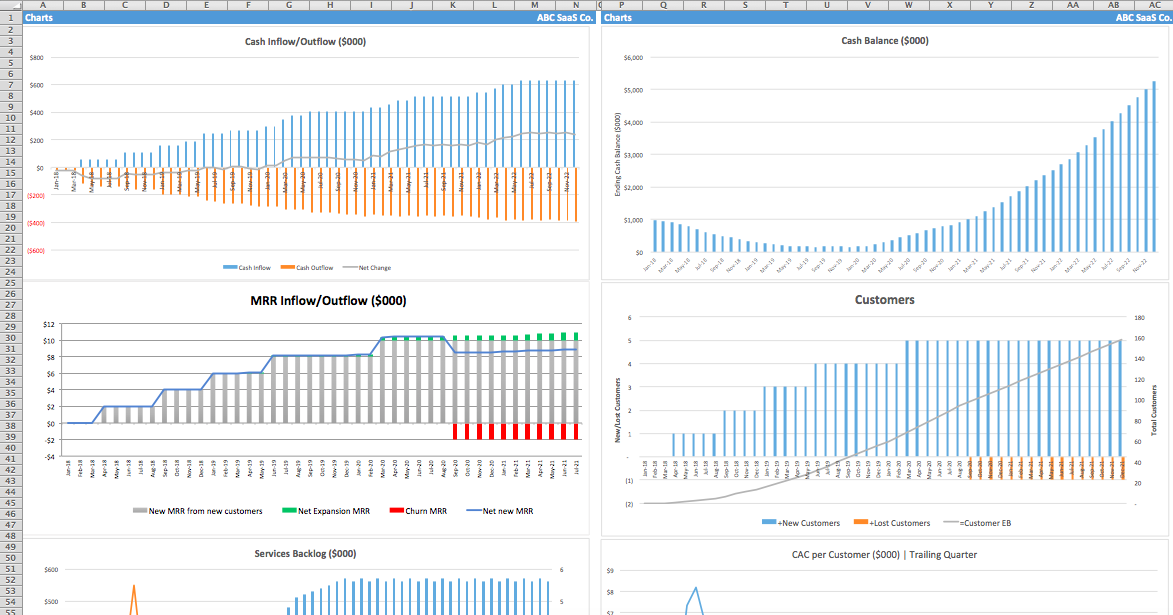
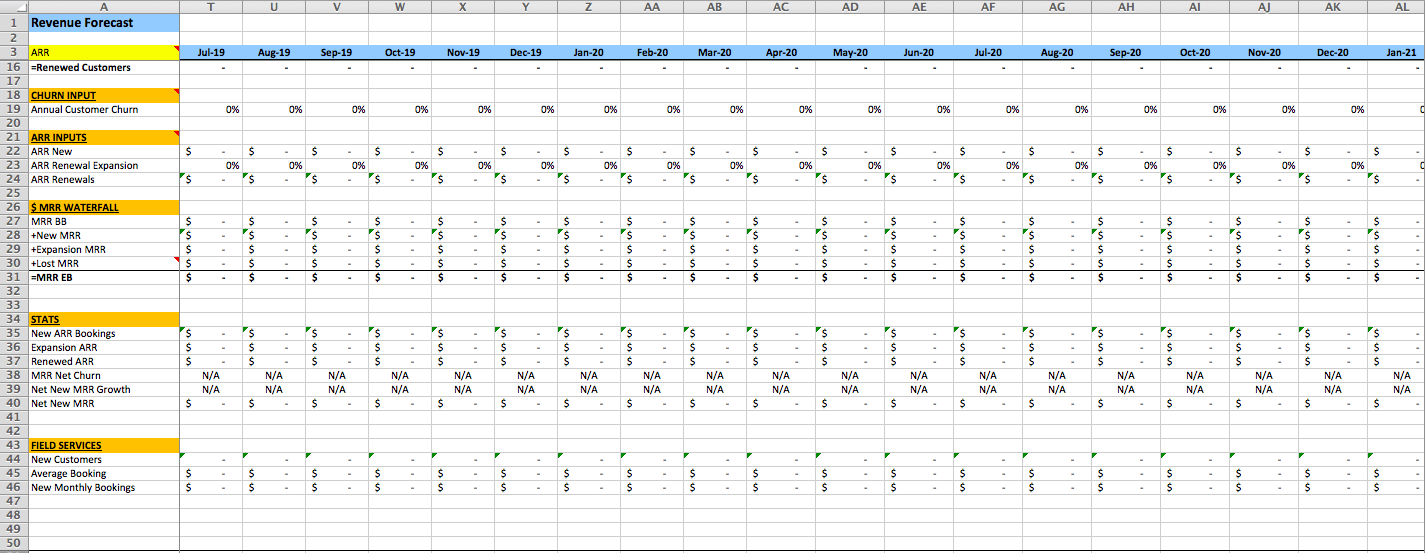
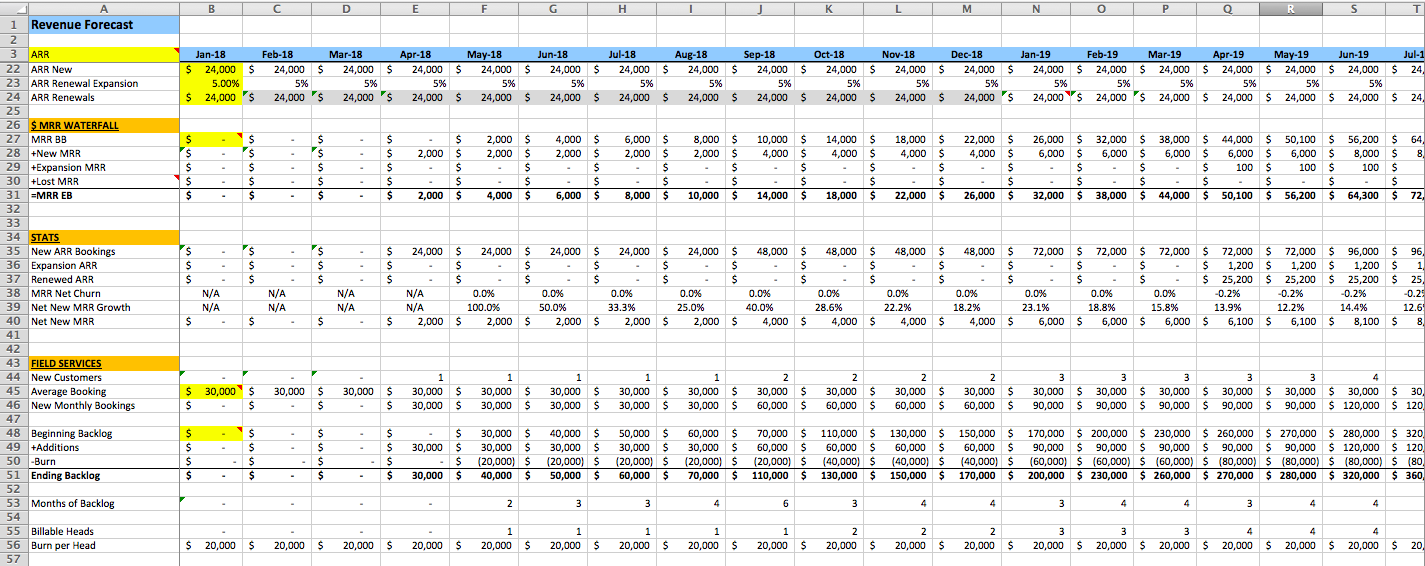
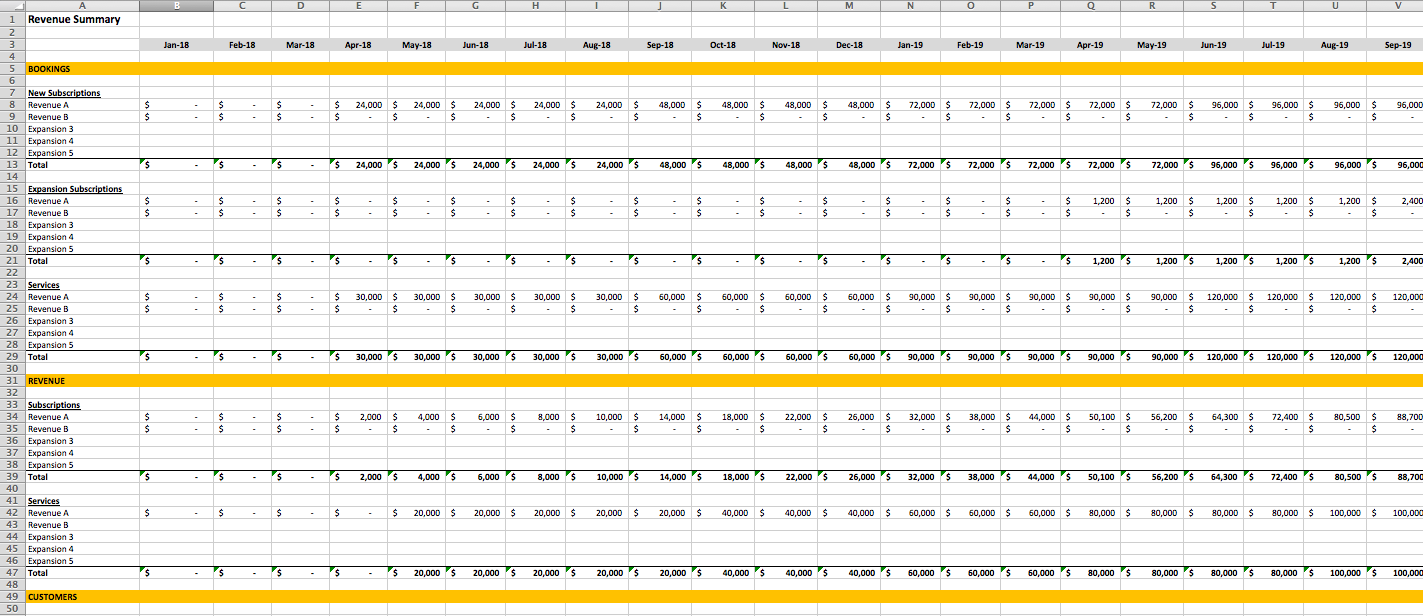
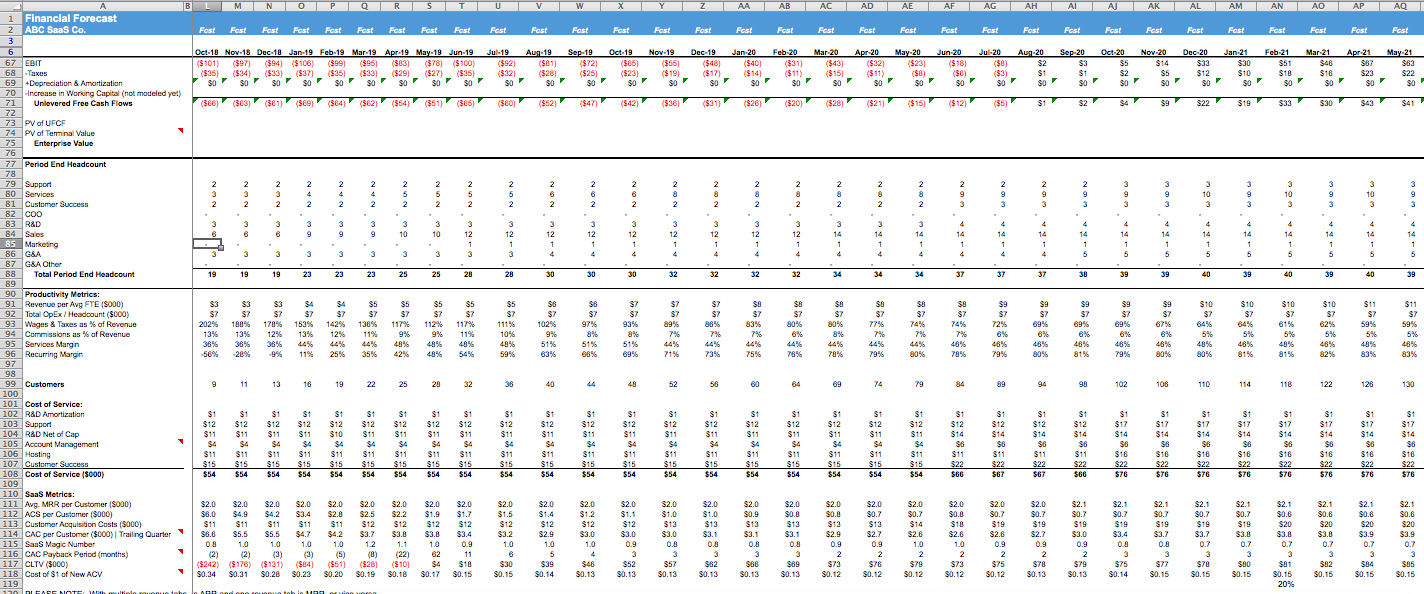
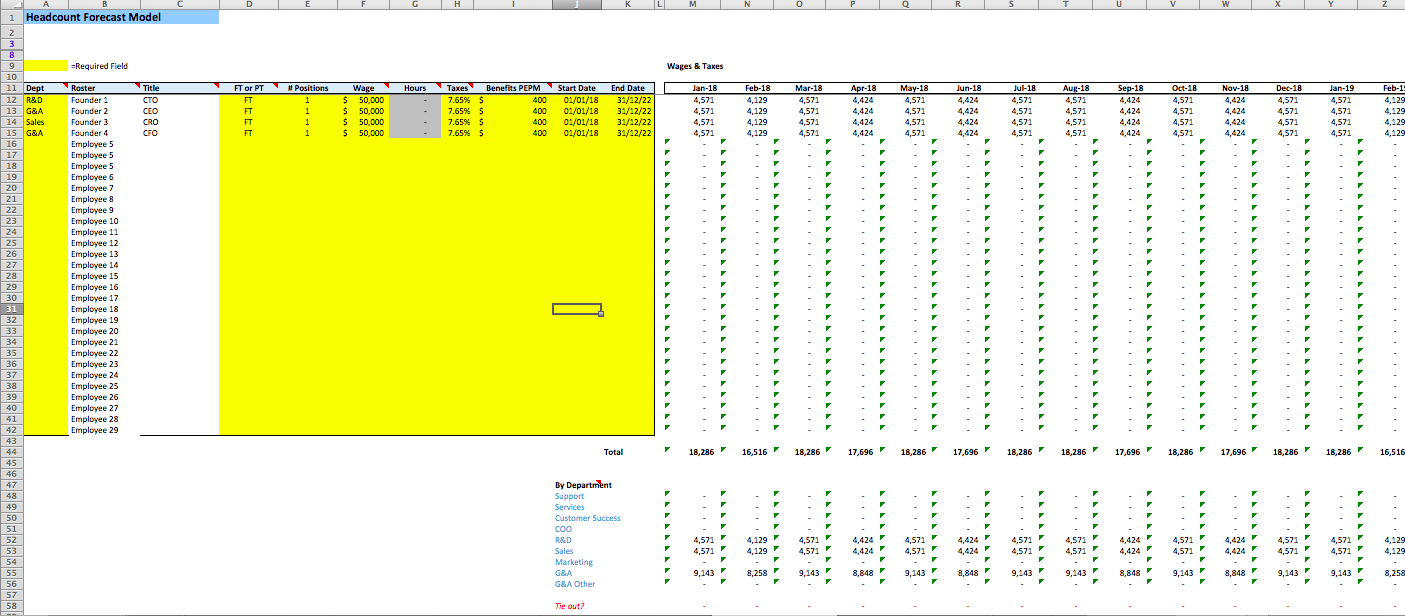
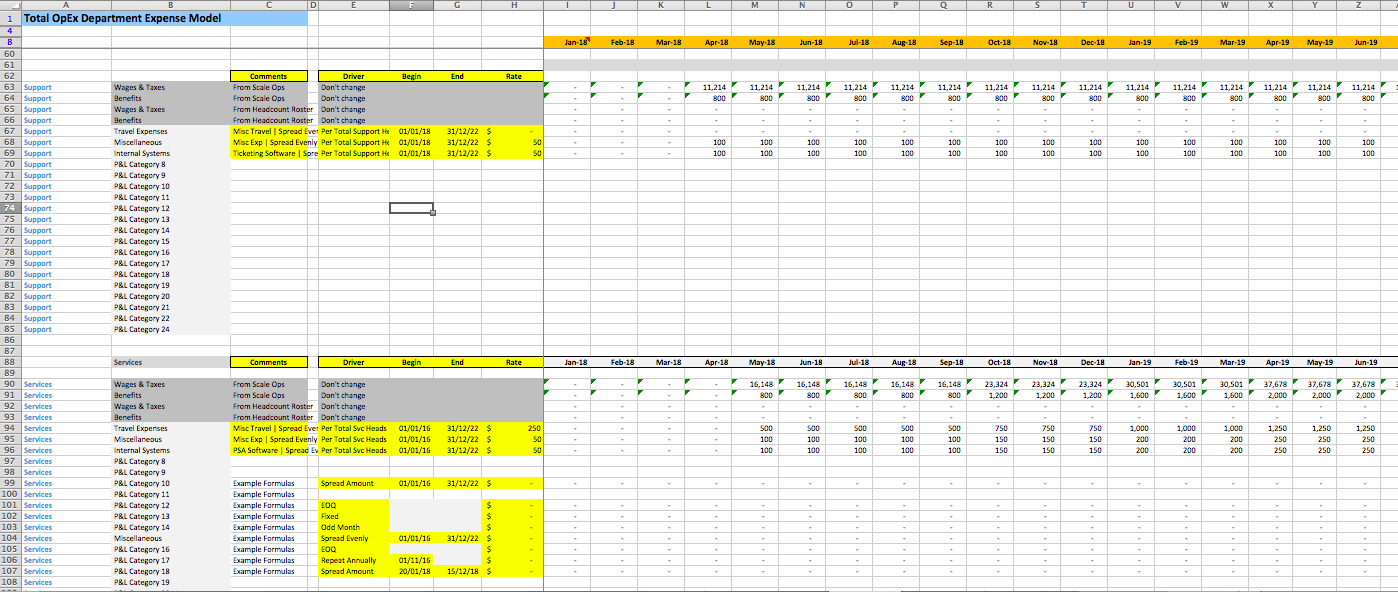
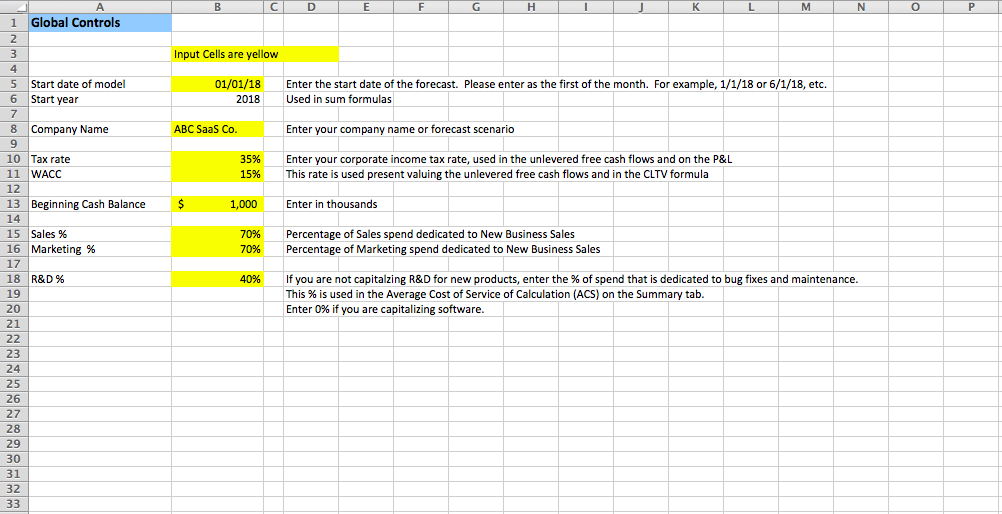
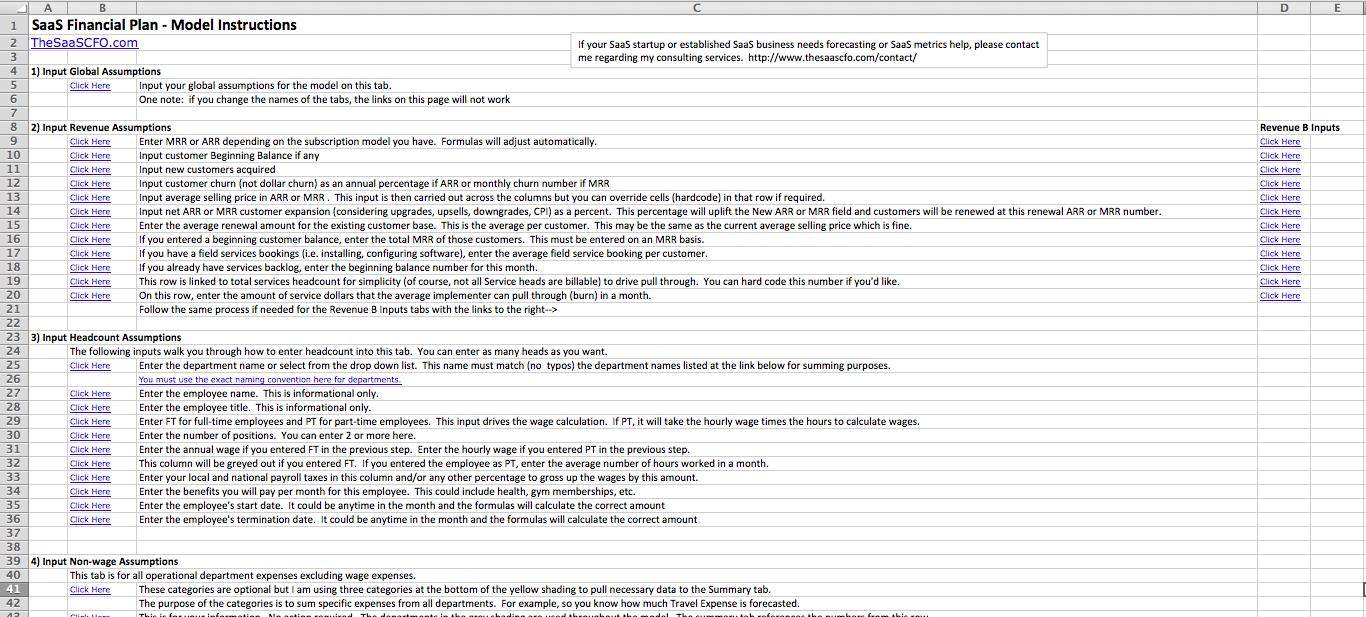
SaaS Five Year Financial Projection Excel Template
Save valuable time and use this pre-made Excel Five-Year Financial Projection template for your SaaS business.
