
Originally published: 21/12/2020 08:51
Publication number: ELQ-86880-1
View all versions & Certificate
Publication number: ELQ-86880-1
View all versions & Certificate

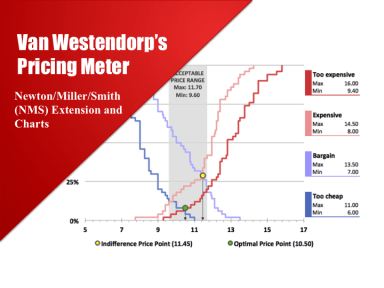
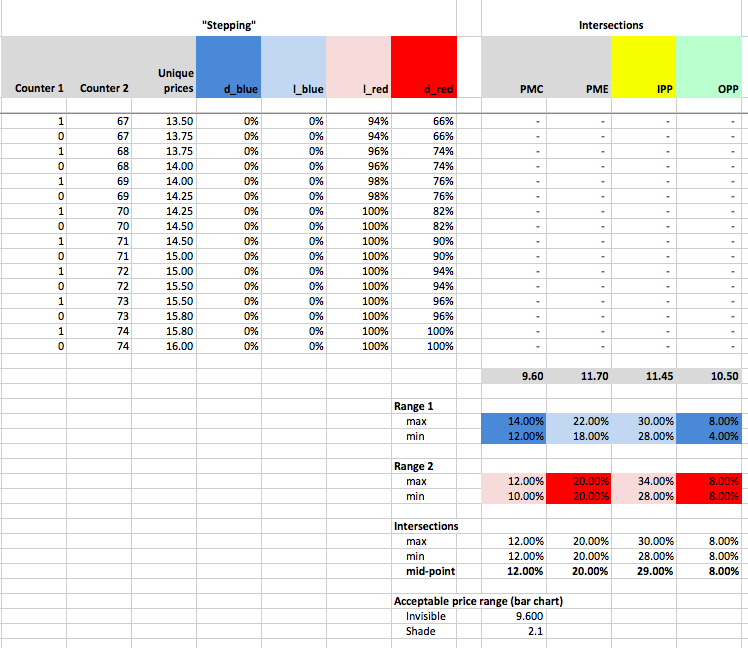
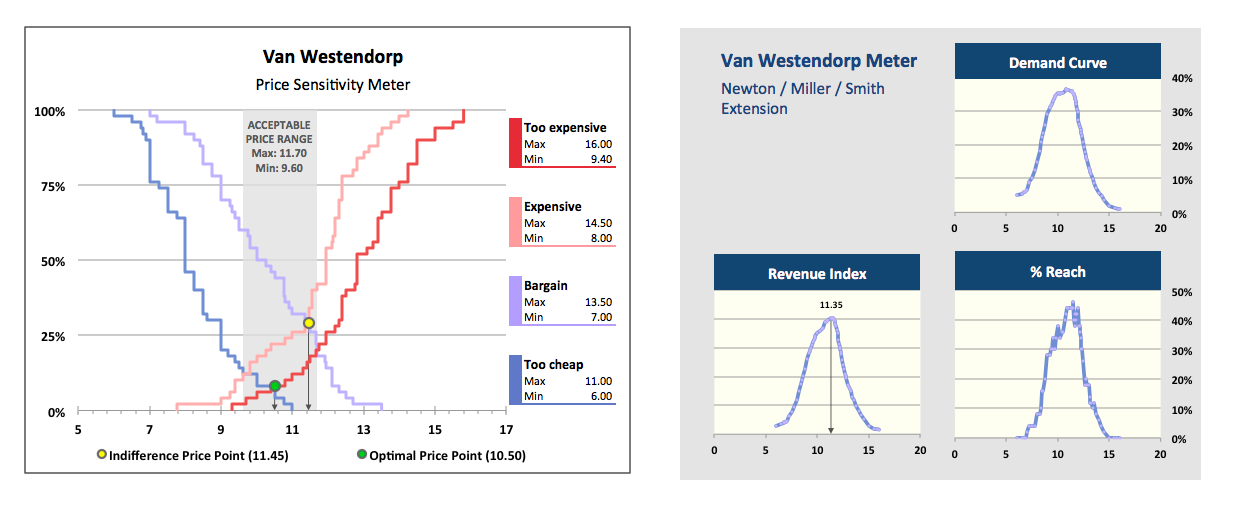
Van Westendorp’s Pricing Method
Determines optimal and acceptable price points, plots demand curves, estimates revenue maximisation points
Further information
Determine acceptable price ranges, optimal price positions, estimate demand and present the outputs graphically
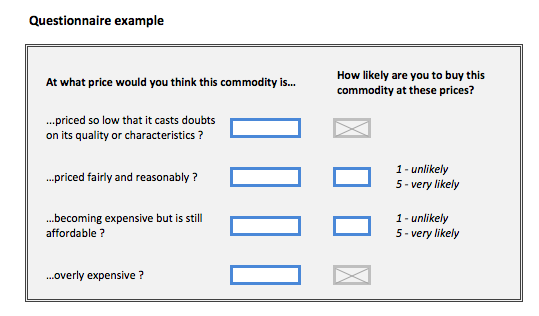
When you are going to analyse prices and estimate demand by way of collecting responses from prospective customers
n/a
