Stock utility model
Originally published: 23/12/2024 11:05
Publication number: ELQ-54217-1
View all versions & Certificate
certified

Stock utility model

Automated model to help with utility based on daily (Risk and Return) of the Dow Jones composite stocks.

Description
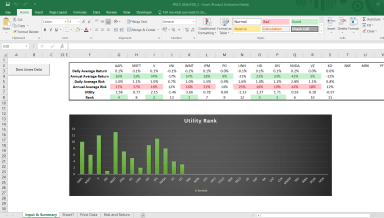
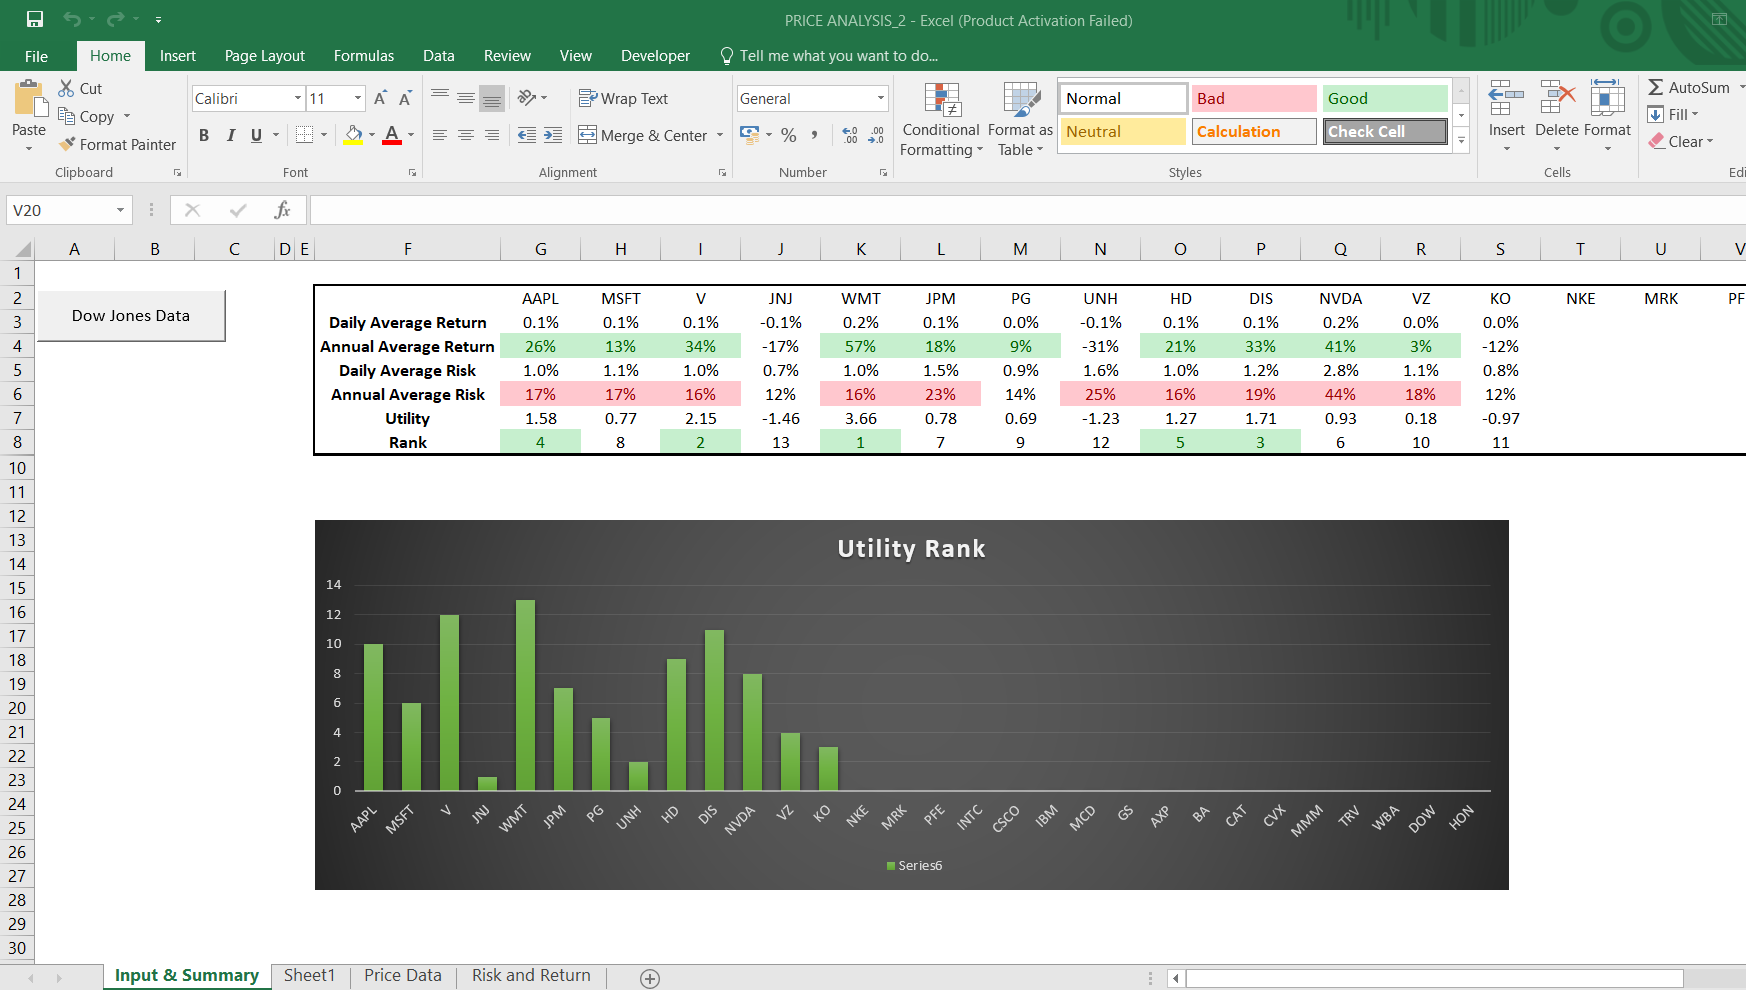
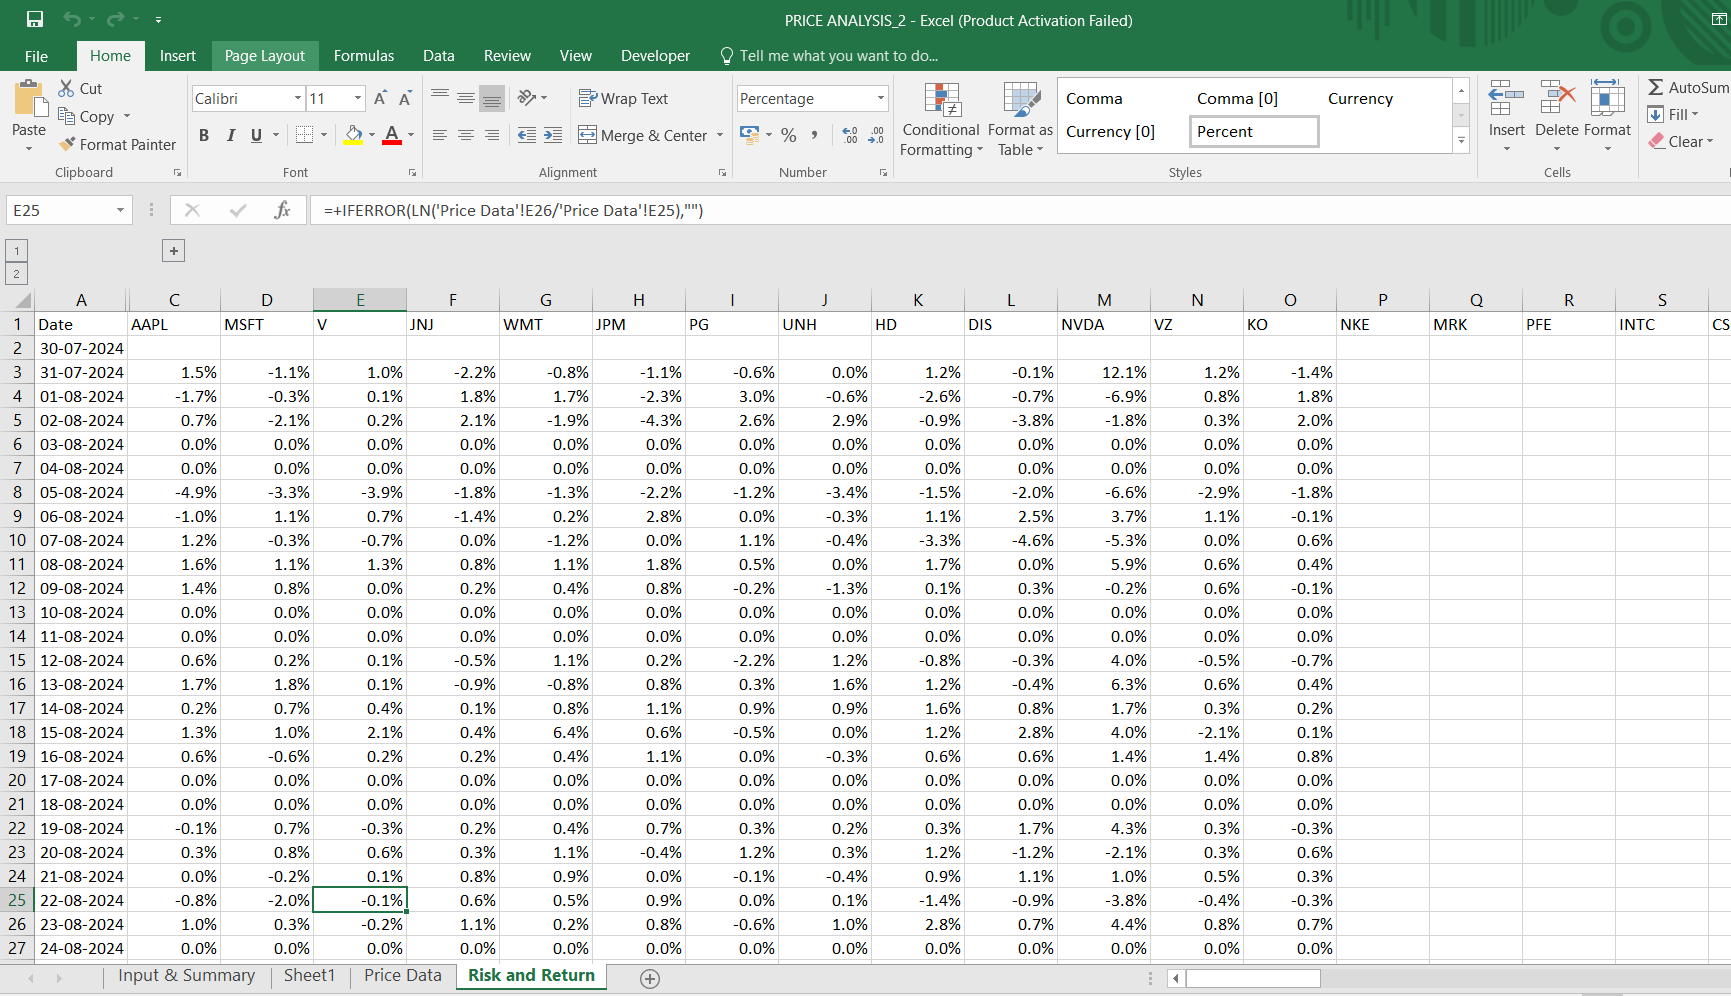
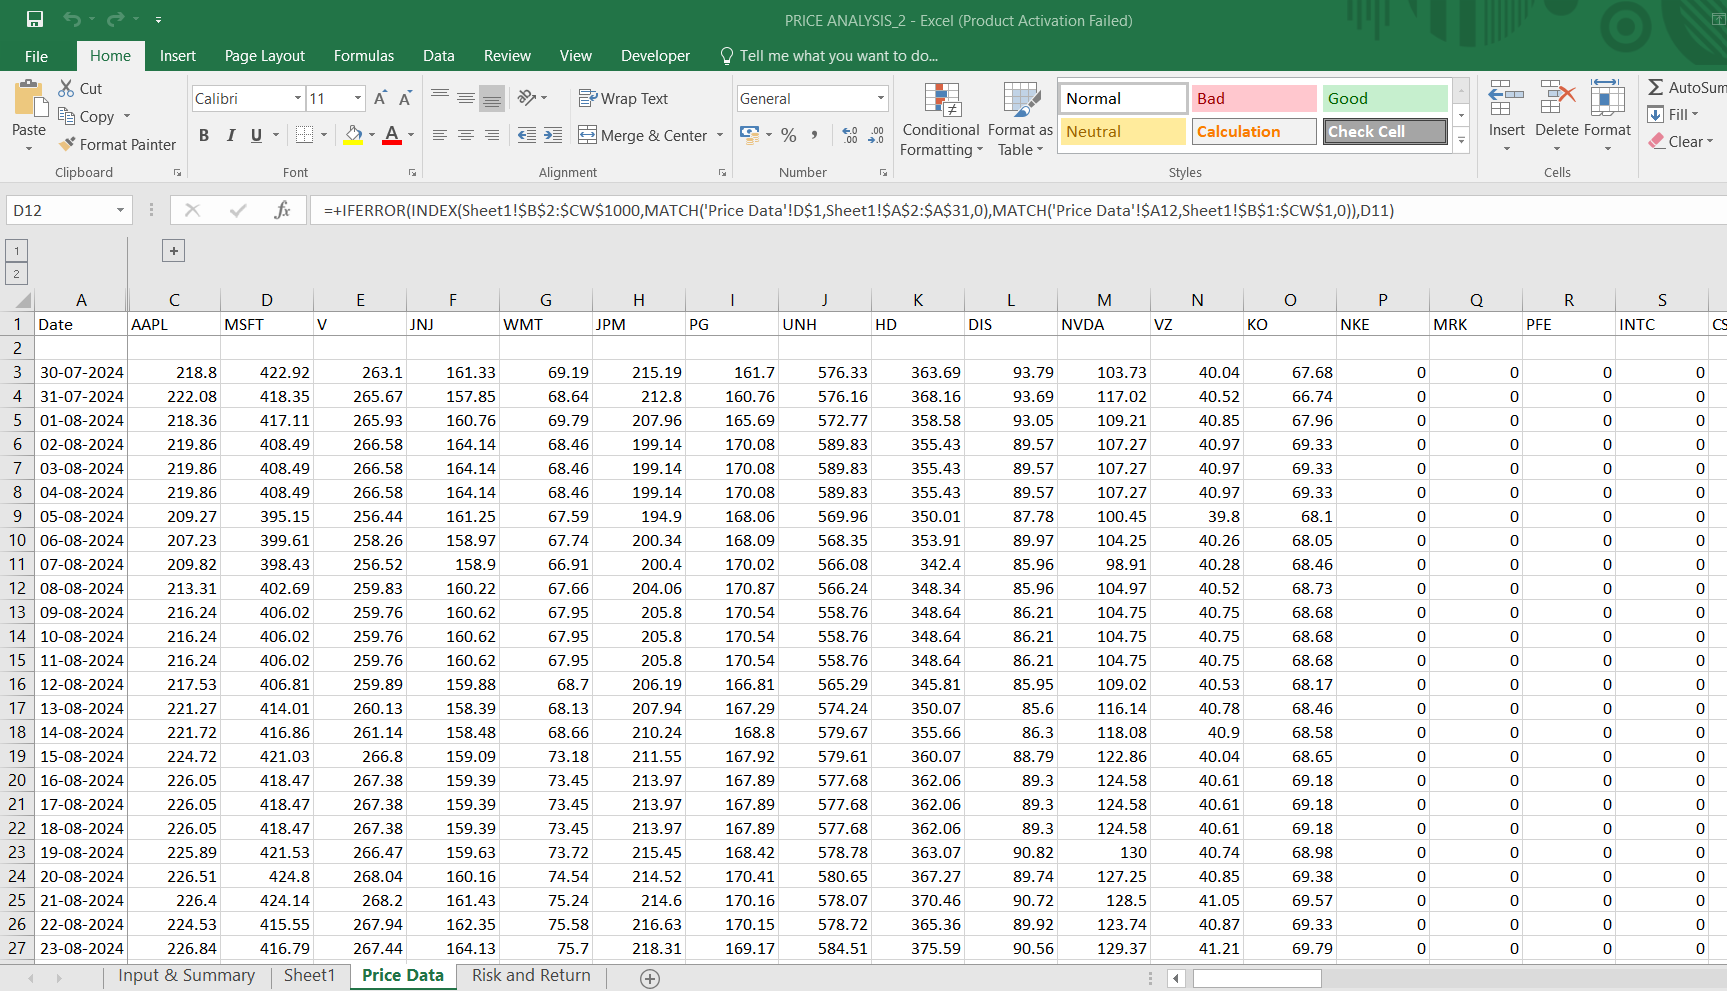
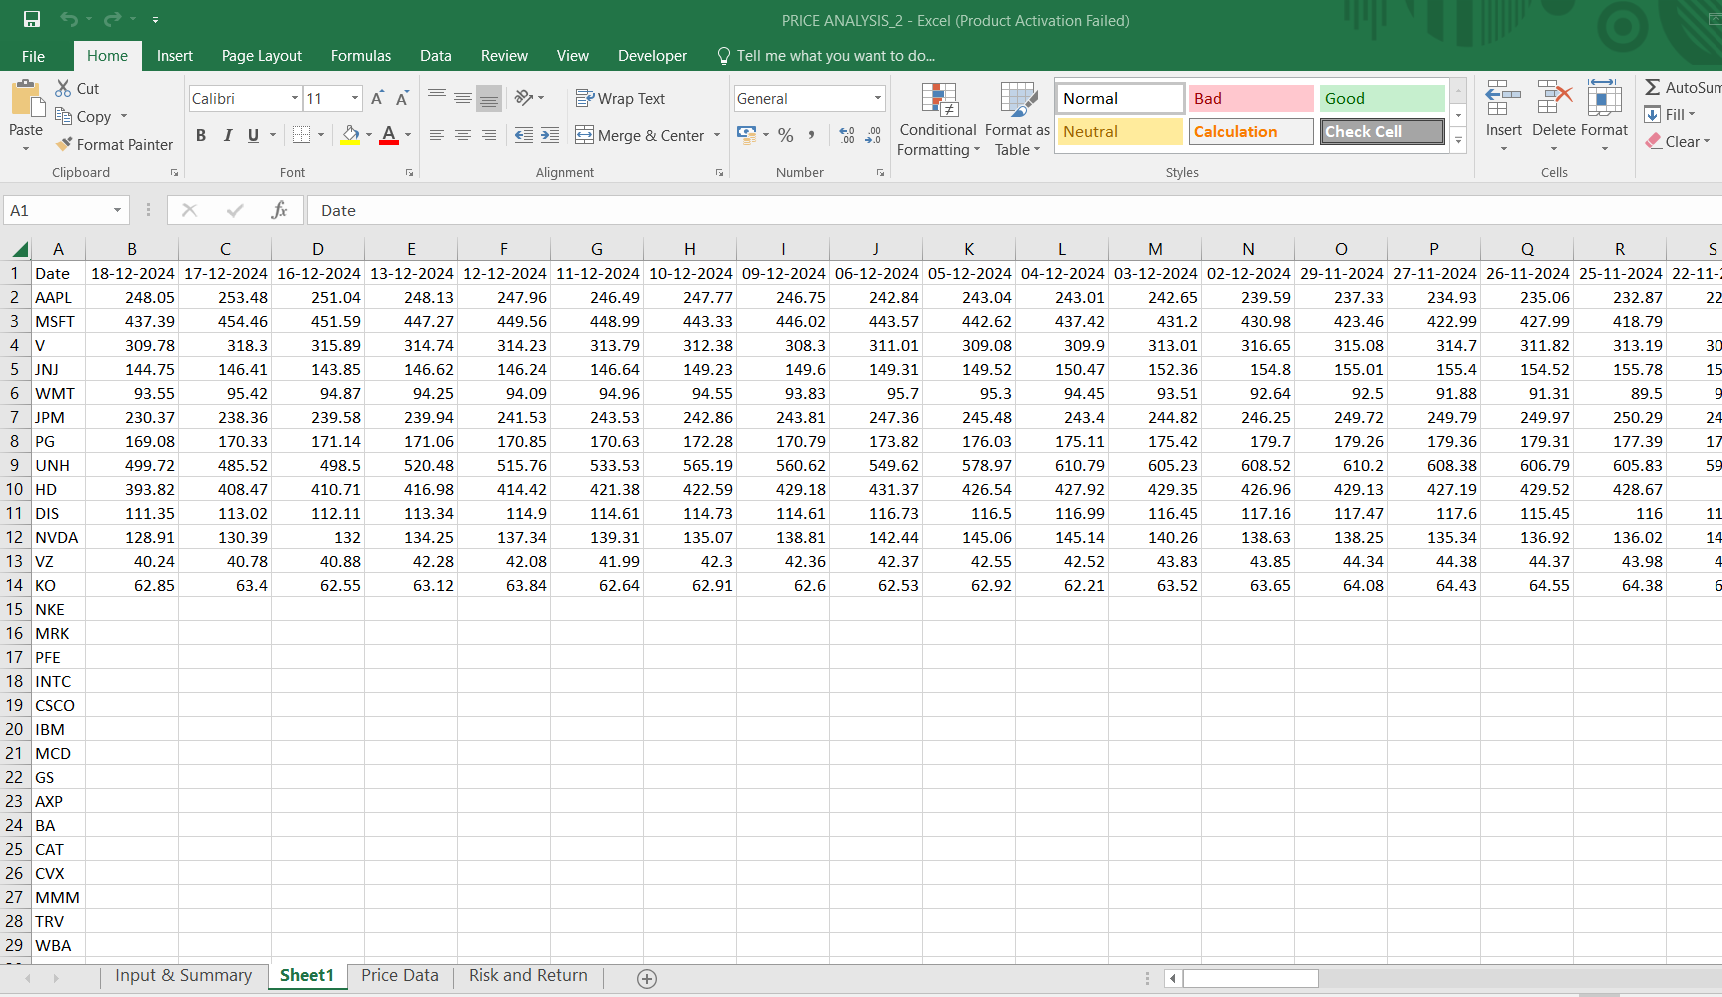
I have created a VBA-automated model that makes it easy to analyze daily returns and risks (based on std. deviation)  for stocks in the Dow Jones Composite Index. Using the past six months of closing price data, this model helps identify which stocks offer the best balance of low risk and good returns.


The model works by automatically pulling and processing stock data, saving time and reducing the chances of manual errors. It calculates two important metrics: the average daily return and the risk, which is measured by the standard deviation. Based on these metrics, the model ranks the stocks using a utility-based approach. Stocks with the least risk and decent returns are ranked at the top, with Rank 1 being the most favorable choice.


This tool is particularly useful for investors and analysts looking for a clear way to evaluate stocks based on risk-adjusted returns. The rankings are presented in a simple, easy-to-read format, making it accessible even for users with basic knowledge of stock analysis.


With its automated process and focus on key investment metrics, the model helps users quickly identify promising stocks in the Dow Jones Composite, supporting smarter and more strategic investment decisions.


It would be highly beneficial to combine it with my VBA DuPont analysis model found on my Eloquens channel:

https://www.eloquens.com/tool/zPgGHMVj/finance/excel-tips/vba-automated-excel-model-du-pont-analysis

This Best Practice includes
1 Excel file

Acquire business license for $39.00

Add to cart

Add to bookmarks

Discuss

Further information

Short term view of stock listed in Dow Jones

Combine with my best practice "VBA automated time series"

Standalonde


0.0 / 5 (0 votes)

please wait...